TTML: Pennant Breakout Signals Potential Upside
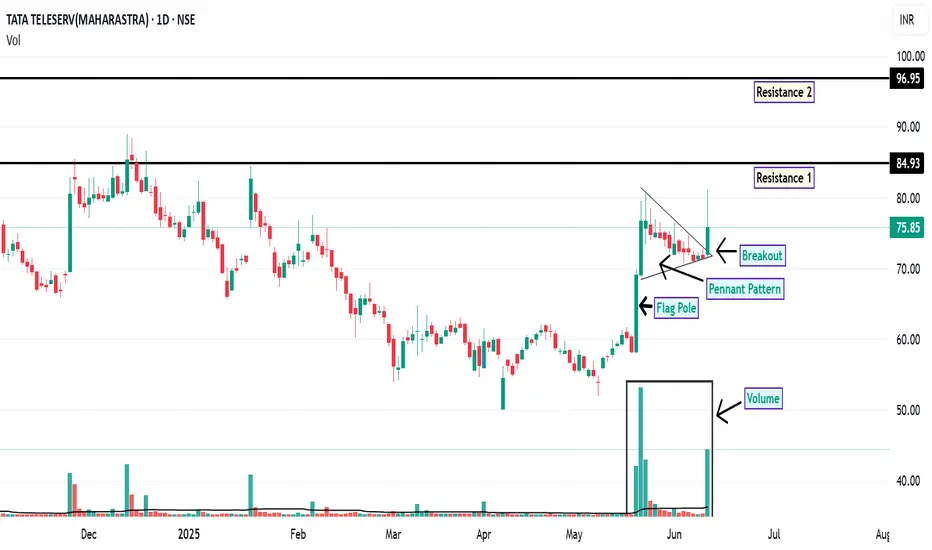
On the daily chart, TTML has recently exhibited a breakout from a pennant formation , a pattern often associated with potential continuation of the prevailing trend. This breakout is accompanied by a notable increase in trading volume, which may indicate growing market interest and participation.
Additionally, the price action has shown support at the 200-day EMA, a widely observed long-term trend indicator. This confluence of technical signals may suggest a strengthening bullish sentiment.
From a momentum perspective, both the RSI and MACD indicators are currently positioned in bullish territory on both the daily and weekly timeframes. This alignment across multiple timeframes can be interpreted as a sign of potential trend continuation.
Looking ahead, the price may revisit the ₹75 level, which could act as a demand zone. Should the stock manage to close and sustain above ₹76.40 , the next potential resistance levels to monitor are around ₹84.93 and ₹96.95 . For risk management, a suggested stop-loss level could be considered below ₹62 , based on recent support structures.
Disclaimer: This analysis is intended solely for informational and educational purposes. It does not constitute investment advice or a recommendation to buy or sell any financial instrument. Market participants are encouraged to conduct their own research or consult with a licensed financial advisor before making any investment decisions.
Trade ideas
TTML: Unlocking Potential with Elliott WavesHello friends, Welcome to RK Chaarts.!
Let’s analyse the chart of Tata Teleservices Maharashtra Limited from an Elliott wave perspective.
We can see that in March 2023, the stock formed a bottom around 49.65 and then moved upwards in an impulse wave. We can identify wave one as complete, ending around the July 2024 high.
After that, there was a sudden fall to the April 2025 low, which we assume to be the end of wave two. We expected it to reverse around the previous low, because wave II cannot retrace more than 100% of wave I (Elliott wave principles), and Same happened, it had reversed from that low to upside.
Looking at the weekly chart, we can see that post wave II, price has broken the 0-B trend line with strong volume intensity. If our wave counts are correct, we can measure wave I and project wave III’s target using Trend based Fib extensions as per Elliott wave theory.
According to the theory, wave III target could be around 150.70, which is 1.618 times the length of wave I.
Projected Targets as per Elliott waves:
So, friends, from an Elliott wave perspective, Tata Teleservices has strong potential to move upwards to around 150 rupees, with potential targets at 88, 112, 127, and 150 rupees.
Invalidation levels:
Please note that this analysis is for educational purposes only and involves multiple possibilities. The scenario presented focuses on one potential outcome, assuming the invalidation level of 49.65 is not triggered. If it is triggered, the chart would need to be reassessed, and wave counts would need to be reevaluated.
This is not a tip or advisory, but rather a educational analysis.
I am not Sebi registered analyst.
My studies are for educational purpose only.
Please Consult your financial advisor before trading or investing.
I am not responsible for any kinds of your profits and your losses.
Most investors treat trading as a hobby because they have a full-time job doing something else.
However, If you treat trading like a business, it will pay you like a business.
If you treat like a hobby, hobbies don't pay, they cost you...!
Hope this post is helpful to community
Thanks
RK💕
Disclaimer and Risk Warning.
The analysis and discussion provided on in.tradingview.com/u/RK_Charts/ is intended for educational purposes only and should not be relied upon for trading decisions. RK_Chaarts is not an investment adviser and the information provided here should not be taken as professional investment advice. Before buying or selling any investments, securities, or precious metals, it is recommended that you conduct your own due diligence. RK_Chaarts does not share in your profits and will not take responsibility for any losses you may incur. So Please Consult your financial advisor before trading or investing.

TTML Smashes Resistance After 3-Month Base MASSIVE 18% SURGE MASSIVE 18% SURGE in NSE:TTML Smashes Resistance After 3-Month Base - The Perfect Breakout Trade Blueprint! Also made a Beautiful Chart Structure of Kinda Triple Bottom Reversal Pattern today after Good Price and Volume action.
Price Action Analysis:
NSE:TTML is currently experiencing a significant bullish move, trading at ₹69.09 with an impressive 18.65% gain (₹10.86). The stock has made a decisive breakout from a well-defined range that had contained prices since March 2025. Today's powerful green candle has cleanly broken above the resistance zone at ₹62-64, showing strong momentum and conviction from buyers.
Volume Analysis:
The volume is exceptionally strong at 105.91M shares versus the average of 7.99M—over 13 times normal volume. This massive spike in participation confirms the legitimacy of the breakout and suggests institutional buying. High volume on breakouts is a classic confirmation signal that increases the probability of continued upward movement.
Support & Resistance Levels:
- Major Resistance (Now Broken): ₹62-64 zone (horizontal red box)
- Next Major Resistance: ₹74-76 area (upper horizontal red line)
- New Support: ₹62-64 (previous resistance now becomes support)
- Strong Base Support: ₹54-56 (multiple green arrows showing successful tests)
Technical Patterns:
1. Triple Bottom: Multiple tests of the ₹54-56 support zone (marked with green arrows) showing strong accumulation
2. Range Breakout: Clear break above the 3-month consolidation range between ₹54 and ₹64
Trade Setup:
- Entry Point: ₹68-70 on any minor pullback today or tomorrow
- Stop Loss: ₹61.50 (just below the broken resistance zone)
- First Target: ₹74-76 (previous resistance level)
- Second Target: ₹84-86 (previous swing high from December)
- Final Target: ₹95 (measured move projection from the range breakout)
Risk Management:
- Position sizing: Maximum 2% of trading capital at risk
- Risk-Reward Ratio: Approximately 1:1.5 based on the entry and the second target.
- Trailing stop: Once price moves above ₹76, move stop loss to breakeven, then trail below each higher low
Additional Insights:
The stock has formed a solid base over three months with multiple tests of support around ₹54-56, allowing for accumulation before this explosive move. The prior downtrend appears to have been arrested, with higher lows forming since March. The breakout comes with exceptional volume confirmation, suggesting this isn't a false move but potentially the beginning of a new uptrend.
The prior resistance at ₹74-76 (horizontal red line at the top) will be critical; clearing this level would confirm a complete trend reversal and potentially lead to a test of the December 2024 highs near ₹84-86.
Traders should be vigilant about potential pullbacks to the breakout zone (₹62-64), which would provide ideal secondary entry opportunities with tighter stop losses. The exceptional volume and percentage gain indicate strong momentum that could carry prices significantly higher in the coming weeks.
Keep in the Watchlist.
NO RECO. For Buy/Sell.
📌Thank you for exploring my idea! I hope you found it valuable.
🙏FOLLOW for more
👍BOOST if you found it useful.
✍️COMMENT below with your views.
Meanwhile, check out my other stock ideas on the right side until this trade is activated. I would love your feedback.
Disclaimer: "I am not a SEBI REGISTERED RESEARCH ANALYST AND INVESTMENT ADVISER."
This analysis is intended solely for informational and educational purposes and should not be interpreted as financial advice. It is advisable to consult a qualified financial advisor or conduct thorough research before making investment decisions.

Breakout Move in Tata Teleservices Tata Teleservices Ltd is engaged in the business of Wired and wireless telecommunication activities and holds a Unified License with Access Service Authorisation in Maharashtra and Goa and also as in Internet Service Provider Category
Breakout screener:
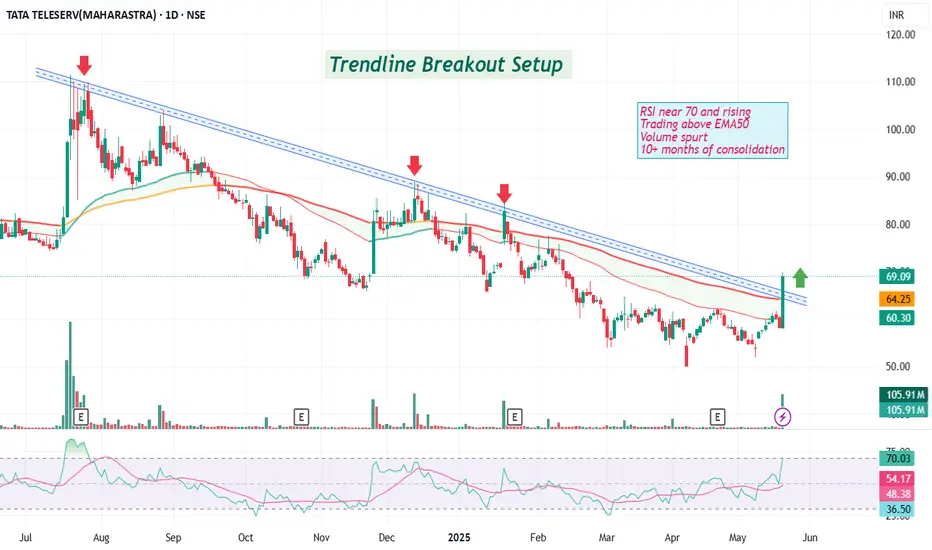
Trendline Breakout Setup
- RSI near 70 and rising
- Trading above EMA50
- Volume spurt
-10+ months of consolidation
Disc: for study, not a recommendation
Tata Teleservices (Maharashtra) Big breakout alert!Big Breakout Alert!
Price has convincingly broken out of a long-term descending trendline with high volume interest visible on the volume profile — signaling a potential change in trend.
🔹 CMP: ₹65.88 (▲ +13.14%)
🔹 Resistance levels: ₹79.00 → ₹104.00
🔹 Support zone: ₹54.10 (Volume Node & Horizontal Structure)
🔍 Technical Insights:
Volume Profile Analysis
🔸 High volume node between ₹54–₹66 suggests strong accumulation.
🔸 Sharp price rejection below ₹54 confirms it as a demand zone.
Descending Trendline Break
🔸 Price finally broke out after multiple rejections since August 2023.
🔸 Breakout has occurred with aggressive bullish momentum.
Roadmap Projection (Blue Path)
1. Possible retest near ₹62–₹64
2. Push toward ₹79 zone
3. Consolidation before breakout toward ₹92–₹104 (previous POC & supply zone)
🧠 Takeaway:
This breakout, backed by volume and structure, hints at a trend reversal. If price holds above ₹62–₹64 on a retest, the stock could enter a new bullish phase targeting ₹100+.
“The longer the base, the stronger the breakout.”
#TataTeleservices #TTML #BreakoutStock #VolumeProfile #TrendlineBreak #SwingTrading #ChartAnalysis #StockMarketIndia #PriceAction #TechnicalAnalysis

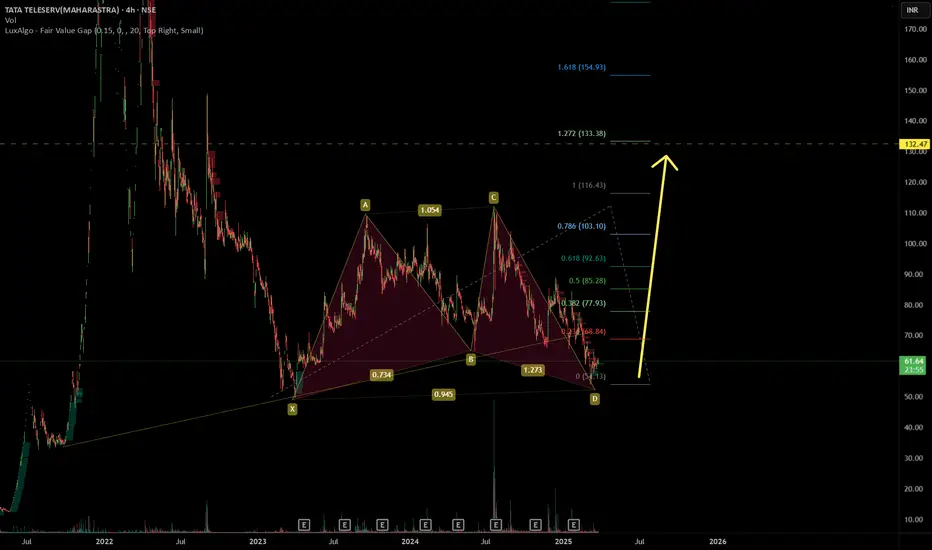
Bullish Bat patternHere's a possible description:
"TTML Price Update: bullish bat Pattern Forms, Breakout to first level 100 Level Imminent?
The TTML price chart is exhibiting a notable bat pattern, hinting at a potential support. If the pattern holds, TTML could witness a significant surge, targeting the 132 level. Will TTML price finally break free from its current range and reach new heights? Stay tuned for further updates!"
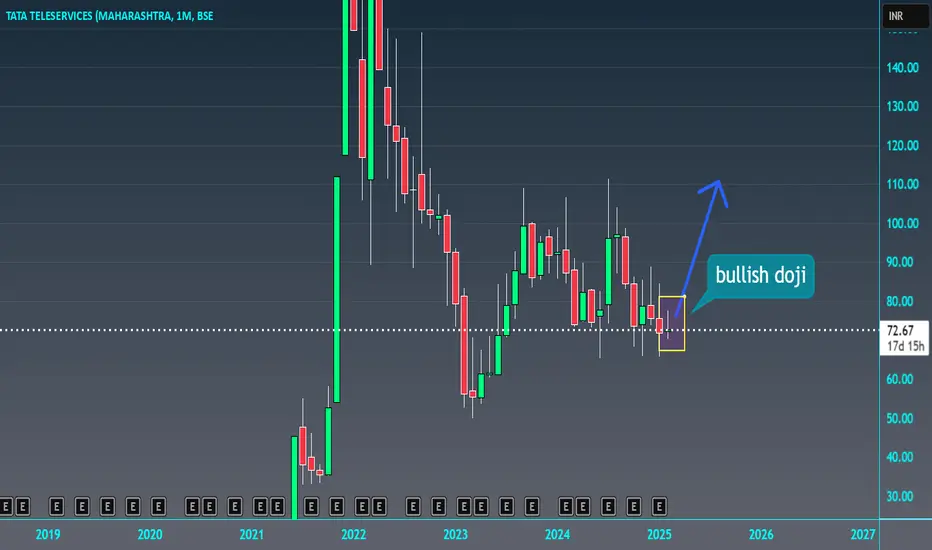
Tata Teleservices (Maharashtra) Ltd#TTML PERFECT REVERSAL CANDIDATE
TARGET - 82
ENTRY - 72
STOP LOSS - 70
TIME FRAME - MONTHLY
TECHNICALS - BULLISH DOJI CANDLE FORMED
THIS IS NOT ANY FINANCIAL ADVISE
As on 7th Feb 2025 TTML SHARE Price closed @ 72.04 and we RECOMMEND Strong Sell for LONG-TERM with Stoploss of 80.87 & Sell for SHORT-TERM with Stoploss of 76.08 we also expect STOCK to react on Following IMPORTANT LEVELS.
Ttml Ttml wonderful tradeline breakout .ready for 100/110 .closing above 110+ daily ttml turn out to b pushpa.. me jukega nahi ...150/200 minimum target

28% Upside Potential StockTTML Trendline Breakout with increasing volume in daily chart next target 109 will be reach shortly

Going to SHORT As per analysis, it will come to marked line . It may take time of 2 month ..
Market will go range for some days .

Tata Teleservices (Maharashtra) Ltd. @ 92.78Tata Teleservices (Maharashtra) Ltd. @ 92.78
Sector: Telecommunication - Service Provider
Promoters holding remains unchanged at 74.36% in Jun 2024 qtr
Mutual Funds have increased holdings from 0.06% to 0.07% in Jun 2024 qtr.
52 Week High 98
52 Week Low 58.63
All Time High 123.75
All Time Low 7.01
Book Value Per Share 25.66
Dividend Yield: 1.37
Sector PE 48.69
Face Value 2
Beta 1.13
Mkt Cap (Rs. Cr.) 7,151
Supports: 64, 49, 1.7
Resistances: 112, 291
As long as 49/1.7 holds support, I expect to see 116, 125-138, 161, 182, 219-228-243, 276
Ultimate targets: 116, 228, 276, 338-406, 516-557-626, 719, 802-846-914
NOTE: Not a BUY or SELL SIGNAL.
All updates are only for the educational and knowledge purpose.

TTML : Huge Volume accumulation at the bottom 🔰 TTML has shown a large volume built-up from its previous resistance area. It has a good potential upside for short to medium term timeframe.
🟢 Range : 90-92
🎯 Target : 105 / 145 / 180 / 210
🛑 SL : below 70 (WCB)
⚠️ It is not a buy/sell recommendation, view only for educational purposes.

Ascending triple pattern TTML is tata company. Ascendig triple pattern. Can break the level then entry.

Ascending triple pattern TTML is tata company. Ascendig triple pattern. Can break the level then entry.

TATA teleservicesTATA teleservices looking attractive for long term investment, Target and stop loss mentioned in the chart

TTML near IMP AreaHey Family, there is a one more stock Which is showing a great opportunity.
Key Points:-
* Formation of Ascending Triangle pattern in daily & Weekly TF.
* From Aug 2023 to July 2024 its in range.
* It's Near resistance Zone and trying to Break Resistance Zone with good volume.
* If resistance zone is break then we can see a good move.
* Volume Accumulation all time high volumes (Volume is Rising).
What is your view please comment it down and also boost the idea this help to motivate us. We are Certified. All views shared on this channel are my personal opinion and is shared for educational purpose and should not be considered advise of any nature.

TATA Teleservices - Weekly Analysis CMP 102.14 buy @ 90-80 rs TATA Teleservices - Weekly Analysis
CMP 102.14 buy @ 90-80 rs range For Target 145- 200- 290- 330+
SL below 47
Holding Period 2-3 years

TTML - Swing Trade Analysis - 17th July #stocksTTML (1W TF) - Swing Trade Analysis given on 17th July, 2024
Pattern: RECTANGLE BOX BREAKOUT
- Weekly Resistance Breakout Initiated - Done ✓
- Weekly Volume Buildup at Resistance - Done ✓
- Demand Zone Retest & Consolidation (for a small SL and a better RR) - In Progress
* Disclaimer

Tata Teleservices (maharashtra) LimitedTata Teleservices (Maharashtra) Limited
Cmp 81 Sl 70 Tar 140 Time Frame 4 Months Approximately
Weekly Rsi Near To Break Out
Price (Trendline ) Ready for Break out
Daily Chart Rsi Breakout Seen & Volume Is Increasing Step By Step


Investment Gem: (TTML) 2X,3X Return in 2-3 Years
Key Points:
Why Should We Invest in TTML:
1. 200 Moving Average Support
2. Promotors have 70+%
3. 1106 Cr last Year Earnings.
4. FII has a 2.46% holding
5. Trust in TATA SON'S
-----------------------------Detail Analysis:
About Company:
Tata Teleservices Limited along with its subsidiary, Tata Teleservices (Maharashtra) Limited, is a leading enabler of digital connectivity and cloud solutions to enterprises.
Holdings:
- Promotors has 70+%
- FII's has 2.46% holding
Earnings:
- Almost 1100 + Cr Business in each Year.
Merge News:
- Bharti Airtel (“Airtel”), India’s premier communications solutions provider, and Tata group announced a strategic partnership for implementing 5G network solutions for India.(2021 News)
Technical Analysis:
- Currently at LL and LH, Once trendline breakout then it will be in HH and HL.
- Support of 200 Moving Average is important and crucial (Hope that will not be break).
- RSI also in support.
Imp. Note: This analysis is provided for informational purposes only and does not constitute a direct recommendation to buy or sell stocks. Investors should conduct their own research and consult with financial advisors before making any investment decisions, as market conditions and individual circumstances may vary.
Market Risk: However, it's important to acknowledge the inherent risks associated with investing in the stock market, including but not limited to volatility, economic downturns, regulatory changes, and unforeseen events that can impact stock prices. It's crucial for investors to remain vigilant and diversify their portfolios to mitigate potential losses.
Thank you for Reading my complete Analysis,
Naveen

TTML - Weekly AnalysisIn the Weekly Chart of TTML ,
we can see that, it is at decision making point.
Possible momentums are shown in chart.

TTML Trade set up with 1:11 RR1. Set up: double bottom
2. Trade idea: Reversal
3. RR: 1:11+ RR
4. SL: Follow on closing basis
