Trade ideas

Usha Martin - 3 week Triangle/VCP BO post 9yr BreakoutMoving along with sector.
SL: Depending on your risk appetite: Below Weekly BO Candle / Below Daily BO Candle / 50% of Weekly BO candle / Below 20DMA
TGT: After a 10-15%+ vertical move, breakdown of 20MA on Hourly chart (on a daily close basis)
BUY GUIDANCE:
Never ever buy before 3PM. I have been burnt many many times.Try to buy between 3:15 - 3:30PM, later the better.
SELL GUIDANCE:
Selling in Profit:
Sell earlier in the session when the prices are higher, around 11AM.
Selling at SL:
Give your stock a chance to recover by end of session. If it doesn't recover, sell anywhere between 3:00 - 3:30PM.
Note: I reserve the right to be wrong.
For educational purposes only.


USHAMART - MULTI YEAR BREAKOUT Ushamart is given multi year breakout. This is the weekly chart of the Usha martin and has broken the trendline resistance even the horizontal resistance. Buy it now or on dips till it comes to support. The levels mentioned on the chart are Fibonacci levels and are working very well. You can buy now and hold for short term in the near future.


USHAMART | Triple bottom | Breakout | Long termThe stock reflects the classic triple bottom pattern which I initially began tracing as cup and handles only to notice later that these multiple back to back cups are actually a triple bottom pattern.
Classic price target {The breakout level + height } has been successfully achieved.
The strong back to back bullish candles with huge volumes and a aggressive MACD supports the long term trend which also confirmed by the 2.5 year resistance level breakout.

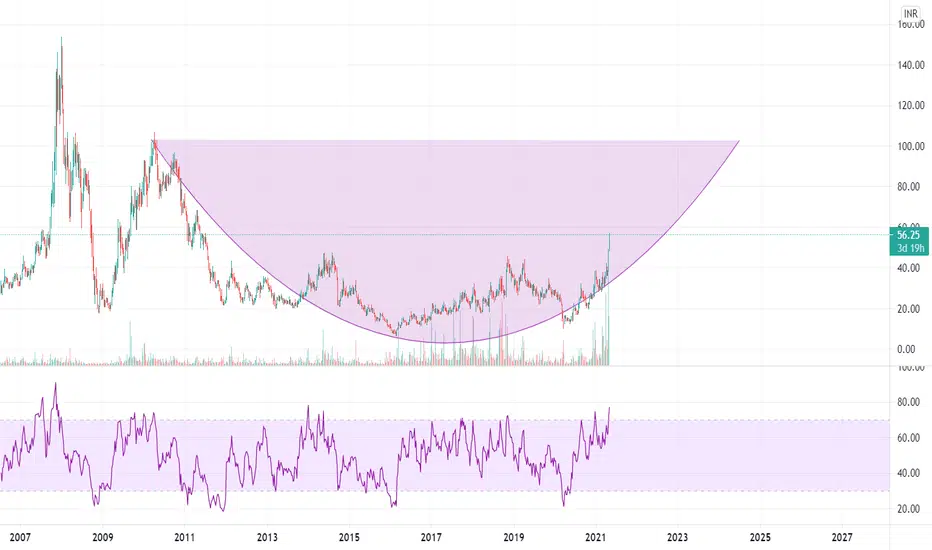
Usha Martin Round bottom pattern on Usha martin wekly chart . Medium to long term looks good for double from here as well
#UshaMartinDisclaimer: I am not a SEBI registered or authorized analyst. The charts/levels/stocks posted will be only for educational purpose and not a buy/sell recommendation. I will not be responsible for your any losses & profit. No any kind of legal actions will be entertained for the same.


FY21-22 Swing Trade Idea #12 : Long on USHAMART This is a public swing trade idea and is only for Learning and observational purpose. Please understand your risk and take full responsibility of your actions. We would comment on any further updates on our entry, targets and stop-loss on this idea, so make sure to follow it if you want to get further updates. Our objective to help anyone who wants to learn technical analysis using charts. You can post your queries in comment section here and we will try to answer asap.

MULTIBAGGER CUP PATTERN STOCK PICKUSHA MARTIN. BREAKOUT WITH CUP PATTERN AFTER 10 YEARS OF CONSOLIDATION
RSI ABOVE 60 , BREAKOUT WITH HIGH VOLUME
BUY ABOVE 52 , TARGET LEVELS MENTIONED ON CHARTS,
SL 5%


USHAMART good earning strategyUSHAMART broke y year resistance with high volume. We can use half quantity strategy. Buy half quantity now and half quantity after conformation. Target- Rs. 80 (71%) ; Stop Loss- Rs. 40; Risk to Reward- 5.2.

USHA MARTIN breaking 10 year resistance with towering volumesLooks good for long. Good volumes with strong candles

Ready to Fly* 10 years long consolidation breakout with high volume in monthly chart . A long trendline breakout also happened. Must traded chart Pattern .
Kindly Let us know if you have any question .


USHAMARTIN - A METAL FABRICATION a flavored sector to play in , keep in watchlist , and do your own research for this idea.


USHAMARTStock has taken support at important Pithfork Levels.
Keep n eye
Remain Bullish till trading in Pithfork
Staying above 38 Good moves may come.

USHAMART - TECHNICALLY IT IS A BREAKOUT STOCK.
#USHAMART - CMP 36.55. TECHNICALLY IT IS A BREAKOUT STOCK.
MADE INVERTED HEAD & SHOULDER PATTERN AND BREAKOUT WITH GOOD VOLUME.
GOOD SUPPORT NEAR 32-30. PRICE CAN GO FORWARD TILL 45-55-65+>> AND WEAK BELOW 28 CLOSING.
IT IS ALWAYS BETTER TO BUY NEAR 34-36 POTENTIAL RETURN IN SHORT OR MEDIUM TERM. 👇🏻
