VARROC 1 Day Time Frame 📈 Where VARROC stands now
Recent quotes put VARROC around ₹ 659 – ₹ 692 per share.
On a 1‑day / very short‑term basis, the stock recently showed a jump of ~4‑5%.
The 52‑week range for the stock has been roughly ₹ 374 – ₹ 674–689 — so current levels are near the upper end of that band.
⚠️ What to
Next report date
—
Report period
—
EPS estimate
—
Revenue estimate
—
9.10 INR
612.30 M INR
80.63 B INR
38.20 M
About Varroc Engineering Limited
Sector
Industry
CEO
Tarang Naresh Jain
Website
Headquarters
Aurangabad
Founded
1988
Identifiers
2
ISININE665L01035
Varroc Engineering Ltd. engages in the manufacture and supply of automotive components. Its products include polymer, electrical-electronics, metallic, and lighting systems. It operates through the Automotive and Others segments. The Automotive segment offers automobile products which comprises of auto parts for two-wheelers, three-wheelers, and four-wheelers. The company was founded by Jain Tarang on May 11, 1988 and is headquartered in Aurangabad, India.
Related stocks
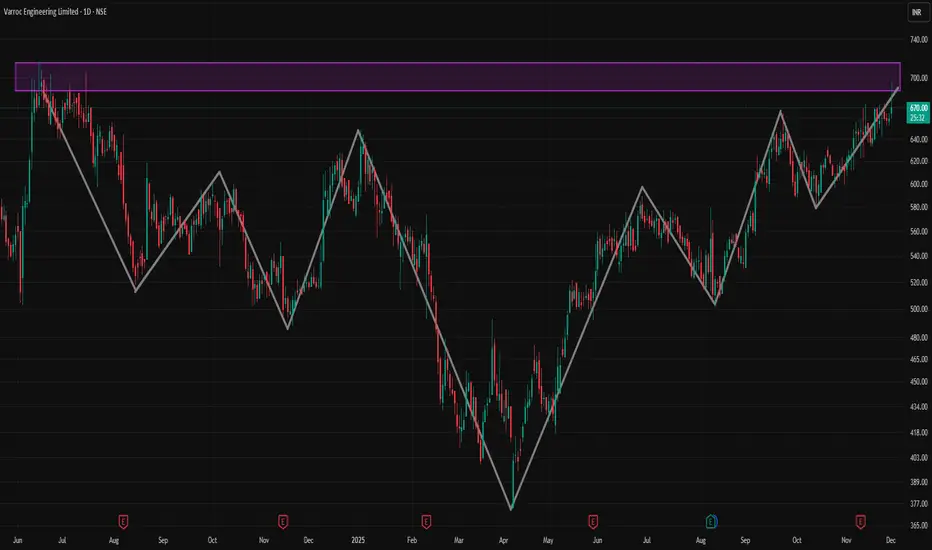
Varroc Engineering LtdThe Stock is taking support and consolidating in a range from a long time and also price is shifting up... so in few time we can see very good movement

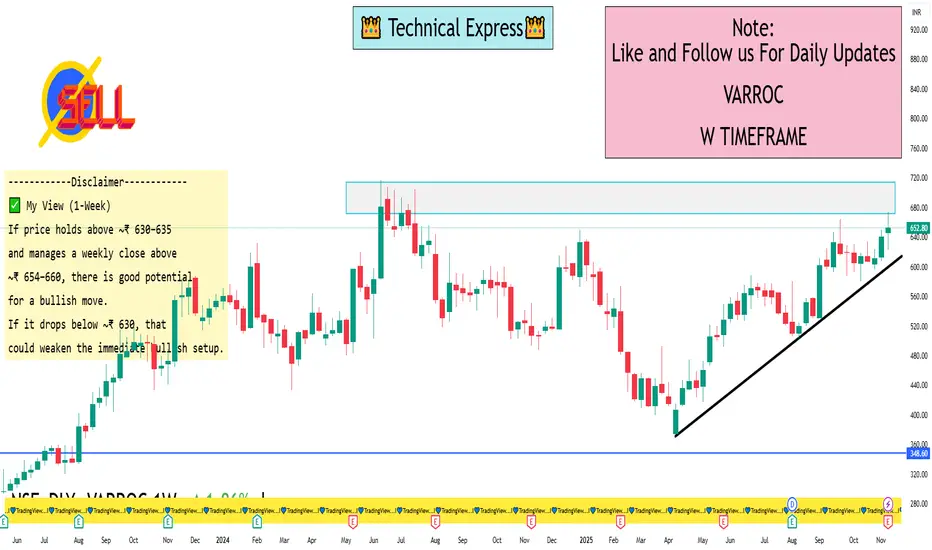
VARROC 1 Week View📊 VARROC – 1-Week (Current) Key Levels to Watch
1. Current Price
a) According to EtMoney, VARROC is around ₹ 652.45.
b) On Investing.com, the weekly technical summary is Strong Buy.
2. Support Levels (Weekly / Key Zones)
a) ~ ₹ 630–635: This zone emerges as a support area (near some pivot and
VARROC ENGINEERING VARROC ENG INDICATING CLEAR BUYING MOMENTUM
The Stock indicatiing clear Buying momentum
Now Trading Near 640 Range
Here we have the chance to enter near the price range of 580 TO 600
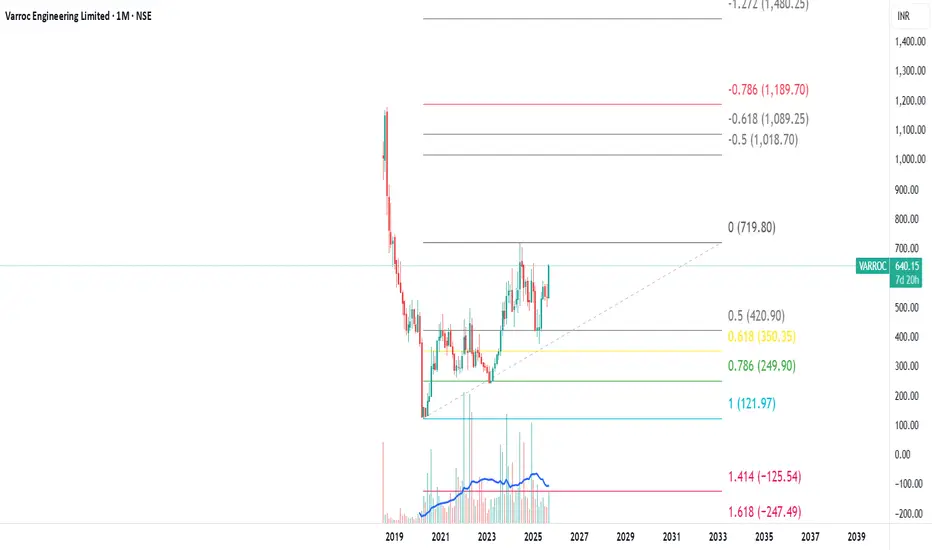
For Expected Momentum upto 720,883,1020
Varroc (Weekly Timeframe) - Potential BreakOut ??Varroc has been mostly in a sideways trend since Dec 2023. Key horizontal resistance zone was brokenout couple of times but that could not be sustained for long. Last week the stock surged by 12.68% with decent volume. With the surge it was able to breakout of a major angular resistance. Short-term
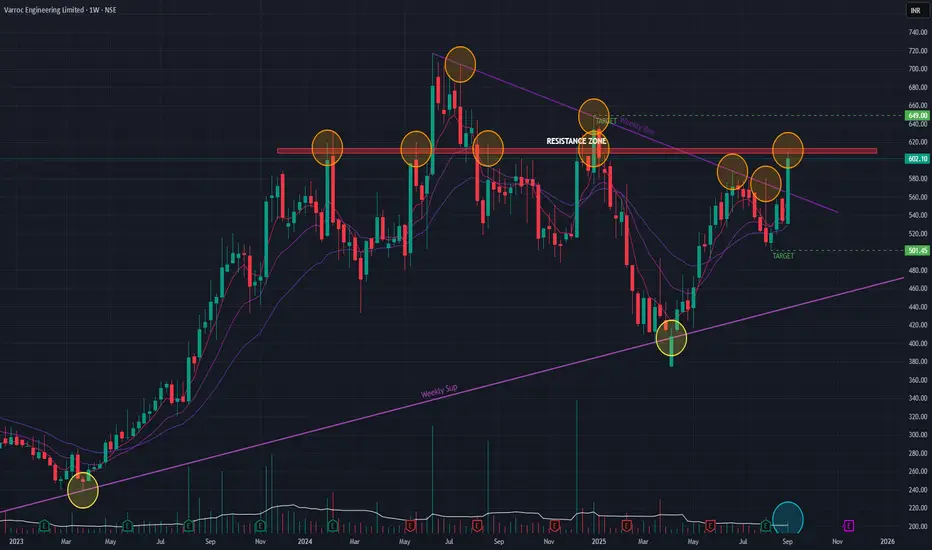
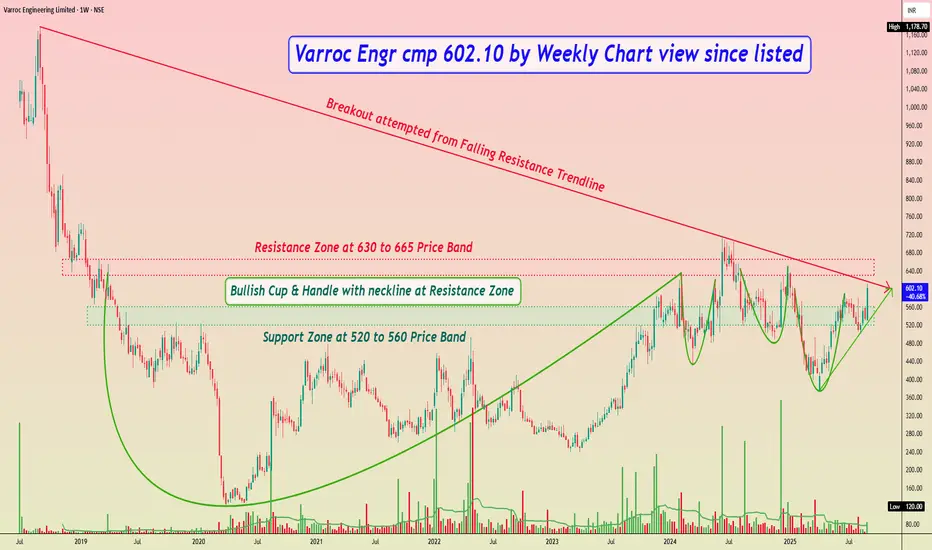
Varroc Engr cmp 602.10 by Weekly Chart view since listedVarroc Engr cmp 602.10 by Weekly Chart view since listed
- Support Zone at 520 to 560 Price Band
- Resistance Zone at 630 to 665 Price Band
- Breakout attempted from Falling Resistance Trendline
- Bullish Cup & Handle with neckline at Resistance Zone
- Bullish Rounding Bottoms also formed by Res
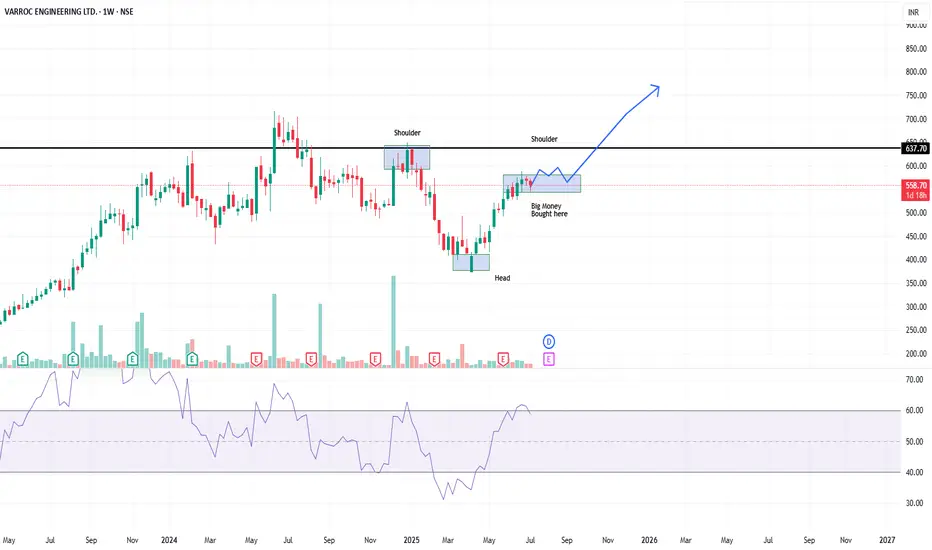
Technical analysis of the weekly chart of Varroc Engineering LtdPattern Details:
✅Left Shoulder: Formed around ₹635 in early 2024
✅Head: Major low near ₹370 in early 2025
✅Right Shoulder: Formed around ₹560–580 in mid-2025
✅Neckline: Strong horizontal resistance at ₹637.70 (clearly drawn)
✅Volume: Noticeable accumulation at the head and near right shoulder = "B
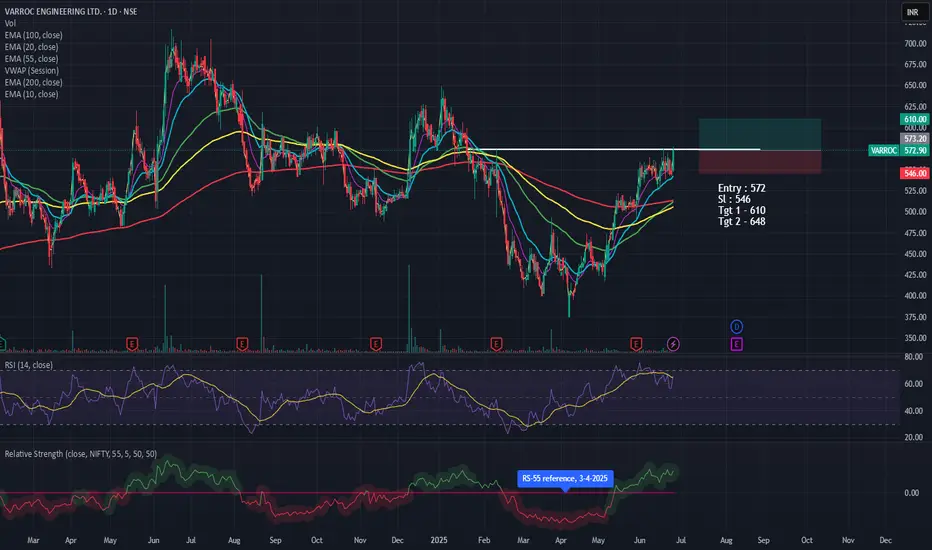
Breakout is clean, volume is strong Technical Analysis:
Parameter Observation
Structure - Rounded base breakout (clean cup-type) above major EMAs
Trend- Bullish – Higher highs, higher lows
Breakout Type- Horizontal breakout from 550–555 consolidation range
Volume- Volume spike visible (392K vs 30D avg 237K) – ✓ CONFIRMED VOLUME
Movin
VARROC ENGG - Bullish Flag & Pole Breakout (Daily T/F)Trade Setup
📌 Stock: VARROC ENGG. ( NSE:VARROC )
📌 Trend: Strong Bullish Momentum
📌 Risk-Reward Ratio: 1:3 (Favorable)
🎯 Entry Zone: ₹525 (Breakout Confirmation)
🛑 Stop Loss: ₹498.00 (Daily Closing Basis) (~5.1% Risk)
🎯 Target Levels:
₹544.00
₹562.70
₹581.10
₹603.65
₹627.70(Final Target)
Technic

Swing Traingle BO done at 596 which is also a closing above a resistance line of a triangle stock can go up to 650 in swing target

See all ideas
Summarizing what the indicators are suggesting.
Neutral
SellBuy
Strong sellStrong buy
Strong sellSellNeutralBuyStrong buy
Neutral
SellBuy
Strong sellStrong buy
Strong sellSellNeutralBuyStrong buy
Neutral
SellBuy
Strong sellStrong buy
Strong sellSellNeutralBuyStrong buy
An aggregate view of professional's ratings.
Neutral
SellBuy
Strong sellStrong buy
Strong sellSellNeutralBuyStrong buy
Neutral
SellBuy
Strong sellStrong buy
Strong sellSellNeutralBuyStrong buy
Neutral
SellBuy
Strong sellStrong buy
Strong sellSellNeutralBuyStrong buy
Displays a symbol's price movements over previous years to identify recurring trends.
Frequently Asked Questions
The current price of VARROC is 644.10 INR — it has decreased by −0.93% in the past 24 hours. Watch Varroc Engineering Limited stock price performance more closely on the chart.
Depending on the exchange, the stock ticker may vary. For instance, on NSE exchange Varroc Engineering Limited stocks are traded under the ticker VARROC.
VARROC stock has risen by 0.94% compared to the previous week, the month change is a −0.12% fall, over the last year Varroc Engineering Limited has showed a 11.44% increase.
We've gathered analysts' opinions on Varroc Engineering Limited future price: according to them, VARROC price has a max estimate of 800.00 INR and a min estimate of 550.00 INR. Watch VARROC chart and read a more detailed Varroc Engineering Limited stock forecast: see what analysts think of Varroc Engineering Limited and suggest that you do with its stocks.
VARROC reached its all-time high on Sep 3, 2018 with the price of 1,178.70 INR, and its all-time low was 120.00 INR and was reached on Apr 3, 2020. View more price dynamics on VARROC chart.
See other stocks reaching their highest and lowest prices.
See other stocks reaching their highest and lowest prices.
VARROC stock is 2.45% volatile and has beta coefficient of 1.55. Track Varroc Engineering Limited stock price on the chart and check out the list of the most volatile stocks — is Varroc Engineering Limited there?
Today Varroc Engineering Limited has the market capitalization of 99.00 B, it has decreased by −1.12% over the last week.
Yes, you can track Varroc Engineering Limited financials in yearly and quarterly reports right on TradingView.
Varroc Engineering Limited is going to release the next earnings report on Feb 16, 2026. Keep track of upcoming events with our Earnings Calendar.
VARROC earnings for the last quarter are 4.20 INR per share, whereas the estimation was 5.75 INR resulting in a −26.96% surprise. The estimated earnings for the next quarter are 6.30 INR per share. See more details about Varroc Engineering Limited earnings.
Varroc Engineering Limited revenue for the last quarter amounts to 22.07 B INR, despite the estimated figure of 22.16 B INR. In the next quarter, revenue is expected to reach 22.19 B INR.
VARROC net income for the last quarter is 609.51 M INR, while the quarter before that showed 1.05 B INR of net income which accounts for −41.99% change. Track more Varroc Engineering Limited financial stats to get the full picture.
Yes, VARROC dividends are paid annually. The last dividend per share was 1.00 INR. As of today, Dividend Yield (TTM)% is 0.15%. Tracking Varroc Engineering Limited dividends might help you take more informed decisions.
Varroc Engineering Limited dividend yield was 0.23% in 2024, and payout ratio reached 24.95%. The year before the numbers were 0.00% and 0.00% correspondingly. See high-dividend stocks and find more opportunities for your portfolio.
As of Dec 16, 2025, the company has 27.6 K employees. See our rating of the largest employees — is Varroc Engineering Limited on this list?
EBITDA measures a company's operating performance, its growth signifies an improvement in the efficiency of a company. Varroc Engineering Limited EBITDA is 7.94 B INR, and current EBITDA margin is 8.55%. See more stats in Varroc Engineering Limited financial statements.
Like other stocks, VARROC shares are traded on stock exchanges, e.g. Nasdaq, Nyse, Euronext, and the easiest way to buy them is through an online stock broker. To do this, you need to open an account and follow a broker's procedures, then start trading. You can trade Varroc Engineering Limited stock right from TradingView charts — choose your broker and connect to your account.
Investing in stocks requires a comprehensive research: you should carefully study all the available data, e.g. company's financials, related news, and its technical analysis. So Varroc Engineering Limited technincal analysis shows the neutral today, and its 1 week rating is buy. Since market conditions are prone to changes, it's worth looking a bit further into the future — according to the 1 month rating Varroc Engineering Limited stock shows the buy signal. See more of Varroc Engineering Limited technicals for a more comprehensive analysis.
If you're still not sure, try looking for inspiration in our curated watchlists.
If you're still not sure, try looking for inspiration in our curated watchlists.