Buy, Sell, or Skip? Multi Timeframe Support ZonesUncover how support levels across multiple timeframes help clarify key buy/sell decisions—purely for technical education.
Chart used is 3 months old for educational purposes only.
VASCONEQ trade ideas

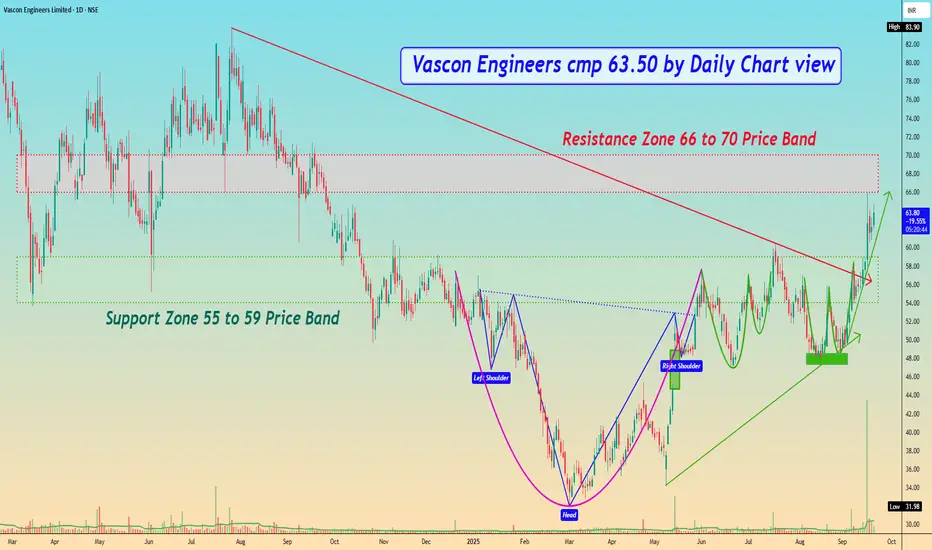
Vascon Engineers cmp 63.50 by Daily Chart viewVascon Engineers cmp 63.50 by Daily Chart view
- Support Zone 55 to 59 Price Band
- Resistance Zone 66 to 70 Price Band
- Heavy Volumes surge based breakout above Support Zone earlier Resistance Zone
- Multiple Bullish Patterns made around Support Zone with Head & Shoulders, Rounding Bottoms, Cup and Handle
Vascon Eng (Daily Timeframe) - Is this the trend reversal ?Vascon is showing strong indications of a major trend reversal. After forming a series of higher lows since March 2025, the stock has now broken out of a clear Inverted Head & Shoulder pattern on the weekly timeframe.
The breakout is particularly significant as it occurred at a confluence of two major resistance zones: a long-term horizontal trendline dating back to February 2012 and the more recent descending trendline from January 2024. This bullish move was accompanied by a +7.06% surge on high volume and is supported by a positive crossover in the short-term EMAs.
If the bullish momentum continues, the next potential target is the 86 level . Conversely, a failure to sustain the breakout could see the price retrace to support around the 46 level .
Vascon Engineers cmp 55.70 by Weekly Chart viewVascon Engineers cmp 55.70 by Weekly Chart view
- Support Zone 49.50 to 53.50 Price Band
- Resistance Zone 49.50 to 53.50 Price Band
- Volumes are getting close to average traded quantity
- Common Technical Indicators BB, EMA, SAR, MACD, RSI indicating positive trend
- Multiple Bullish Technical Chart patterns have emerged on the Daily and Weekly Charts
- Rounding Bottom, Head & Shoulders, Cup & Handle, VCP, as one may observe and interpret

Vascon Engineers – Weekly CT BreakoutA clean Weekly CT breakout supported by strong volume (19M+), signaling strength. Key levels and structure:
🔍 Technical Breakdown:
📏 CT Line (White): Clean breakout from weekly closing-based counter-trendline
🕵️ Hidden Line (Dotted White): Secondary hidden resistance cleared
🟧 ₹45.49 Zone: Major gap-up area on DTF – key retracement demand zone
🔵 200 DEMA (Blue Line): Historical resistance now flipped – strength confirmed
🟥 Supply Zone (₹78–₹83): Overhead resistance – long-term target zone
📈 Volume: 🔥 Spiked to 19M+ – highest since Jan ‘24 – confirms breakout strength

Vascon Engineers Ltd ₹ 63.6Vascon Engineers Ltd
₹ 63.6
-0.76%
27 Sep - close price
EXPORT TO EXCEL
FOLLOW
vascon.com
BSE: 533156
NSE: VASCONEQ
ABOUT
Incorporated in 1986, Vascon Engineers
Ltd is a is a Pune-based player, engaged in engineering, procurement and construction (EPC), real estate construction and development
KEY POINTS
Landmark Projects
Company has executed 200+ projects with a construction area of over 50 mn Sq ft. Some of the Landmark projects are Ruby Mills (Mumbai), Suzlon One Earth (Pune), Symbiosis College (Pune), IGI Airport Multilevel Car Parking (New
Delhi), and it also received its 1st redevelopment project in Mumbai

Vascon EnginneringLooking good for long term target of 200 , nice retracement and breakout with w patter
Volume and candlestick supporting breakout

Vascon Engg long Term Chart Vascon Engg long Term Chart
Fibonacci levels
Expecting Tar
Rest market is Supreme


Vascon Engineering can be a good candidate for swing buyLogic of the prescribed trade:
1. Top down approach- Realty sector in strong uptrend
2. The stock is above 60 on all the monthly, weekly and daily RSI's
3. The stock has confirmed the RSI's PRD by an immediate positive candle.
(22/1/24)
Atharva Dhokte

Rounding bottom pattern Breakout in VASCON ENGINEERSRBL Bank reached an ATH of 196.25 in Aug 2010 and corrected approximately 97% to reach 6.25 in the month of Mar'20. It then took support at lower trend line of the round bottom and rose 6.7x in 3 years i.e. till Nov'22. The price faced correction for next 4 months and has again started the upward journey rising 71% in last 3 months.
Stop Loss: 40 (daily closing price)

VASCONEQ bullish; above 85 ? - Tuesday 16 Jan.The above information does not constitute investment/trading recommendation and it is purely for educational purpose. Please check the Strategy below...
SWING Trading Strategy:
Position is created, only upon stock closing above the entry price on day closing basis and is held on for 5-10 trading sessions for larger gains (5-10%)
INTRADAY Trading Strategy:
1) Impulse upmove stage: The strong upmove (nearly upto 2% from breakoutprice) happens within five to 15 minutes. "High Risk Traders" buy in hope of another 2% upmove intraday.
"High Risk Traders" patiently wait through the Pullback-Consolidation stage to realize profits. High risk/High reward set up as breakouts may fakeout (reversal)also
2) Pullback-Consolidation stage: After the above "Impulse upmove stage"; the price may then pull back and move sideways (between "Open" price and "High" of the above "Impulse upmove stage").
Safe traders with minimum risk profile wait for a breakout from the consolidation to enter at this stage to relize high profits in the final intraday final "Breakout continuation" stage
3) Breakout continuation: Stocks often in the third stage breaks up above the "High" of the first "Impulse upmove stage" and continue to go higher again.
Both Safe Traders/High Risk Traders book profits at this stage
This do not constitute, financial, investment, trading, or other types of advice or recommendation.

Resistance Breakout - VASCONENGPlease look into the chart for a detailed understanding.
Consider these for short-term & swing trades with 2% profit.
For BTST trades consider booking
target for 1%-2%
For long-term trades look out for resistance drawn above closing.
Please consider these ideas for educational purpose
Please note that, if there are some big targets, those are drawn thinking for long term.

VASCONEQ Create falling flag pattern - wait for proper breakout
- stock target - 84.85 ( for day )
- stock entry - 78.50-79
- stock sl - 72-71

Flag Breakout & Retest Done-flag breakout with decent volume
-ema breakout
-expecting good momentum above 76 keep in radar

Vascon engineers has Ready to moveVascon engineers make piercing pattern, and get trend line support... It will go up for next move......


Vascon Engineers Ltd: Symmetrical TriangleVascon Engineers Ltd: Symmetrical Triangle pattern
Levels mentioned on chart & given targets seems achievable.
Plan your trade accordingly.
Views are for ‘’EDUCATIONAL PURPOSE ONLY’’,trade at your own risk.
"Trade what you see, Not what You Think"
Happy Trading(:)

BREAKOUT, VASCON ENGINEERS, 135% RETURNS!!!BUY - VASCON ENGINEERS LTD
CMP - Rs. 76
Target - 1: Rs. 112
Target - 2: Rs. 150
Target - 3: Rs. 180
.
Timeframe - 4 months - 10 months
.
Technicals - Trendline Breakout
.
This is just a view by an expert analyst, please invest at your own risk.
.
Follow me for more!

Vascon Engineers Ltd - On a Rally moodVascon Engineers Ltd is an engineering company engaged in real estate. Hospitality, manufacturing with an operating revenue of more than 700 crores . Stock is now in a rally mode with its 52 week high. Stock is now testing it's 3 year long resistance trend line. If it breaks then a 100% move can be expected in 3--6 months time. It's also can be considered as a long term bet. Momentum is also very strong now. Company declared an interim dividend recently. Roce & ROE also improving comparing to previous years.

Vascon Engineers Cmp 70 Weekly Cup & Handle BOVascon Engineers Cmp 70 dated 5-10-2023
Weekly Chart (Positional View)
1. Cup & Handle Pattern Bo @ 70.50
2. Price Rise with Volume rise
Buy above 71 target 75-80-85-90-95-100 SL 58
It is just a view, please trade at your own risk.
