#LONG for Long Term on VENUS REMEDIES
Venus Remedies reached an ATH of 639 on 9th Aug '21and then corrected by approximately 77% to reach a low of 145.80 on 22nd Feb'23. In the month of Feb'23, the scrip took support on the base and has resumed uptrend, forming a triangle pattern in the process.
On 30th May'23, the scrip opened w
40.20 INR
453.15 M INR
6.48 B INR
7.39 M
About Venus Remedies Limited
Sector
Industry
CEO
Ashutosh Jain
Website
Headquarters
Panchkula
Founded
1989
ISIN
INE411B01019
FIGI
BBG000F5NZD4
Venus Remedies Ltd. engages in the manufacture and trade of pharmaceutical products. Its products include analgesic, analgesic and antipyretic, anti diabetic, antibiotic, cardiac, disinfectant and antiseptic, gastro therapy, hand sanitizer, hormone, iron supplement, neurology, oncology, pain management, respiratory, skin care, stress reliever, urology, vitamins/minerals/nutrients, and wound management. The company was founded by Pawan Chaudhary on September 15, 1989 and is headquartered in Panchkula, India.
Related stocks

Buy Venus Remedies Short Term Trading Advice by Goodluck Capital
Buy Venus Remedies
Buy Range- 423 - 438
Target- 470 - 480
StopLoss- below 406
Upside Potential- 9% -11%
Approx trade duration 12 - 14 days

Venus remedies cup and handle pattern break out in 2 yearVenus remedies has broken out in cup and handle pattern with in 2 year cup. Immediate resistance is at 480 with target of 520. SL can be 375 levels.
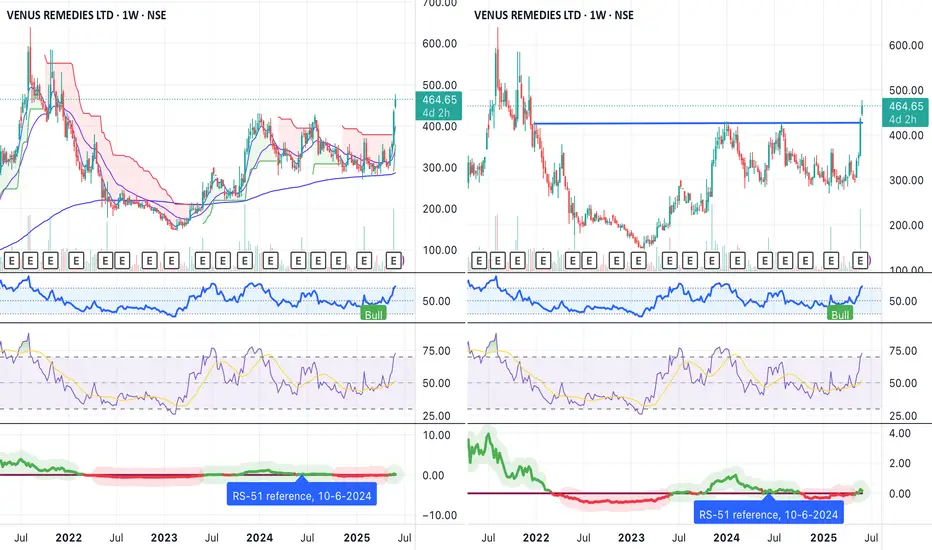
Amazing breakout on WEEKLY Timeframe - VENUSREMCheckout an amazing breakout happened in the stock in Weekly timeframe, macroscopically seen in Daily timeframe. Having a great favor that the stock might be bullish expecting a staggering returns of minimum 25% TGT. IMPORTANT BREAKOUT LEVELS ARE ALWAYS RESPECTED!
NOTE for learners: Place the break
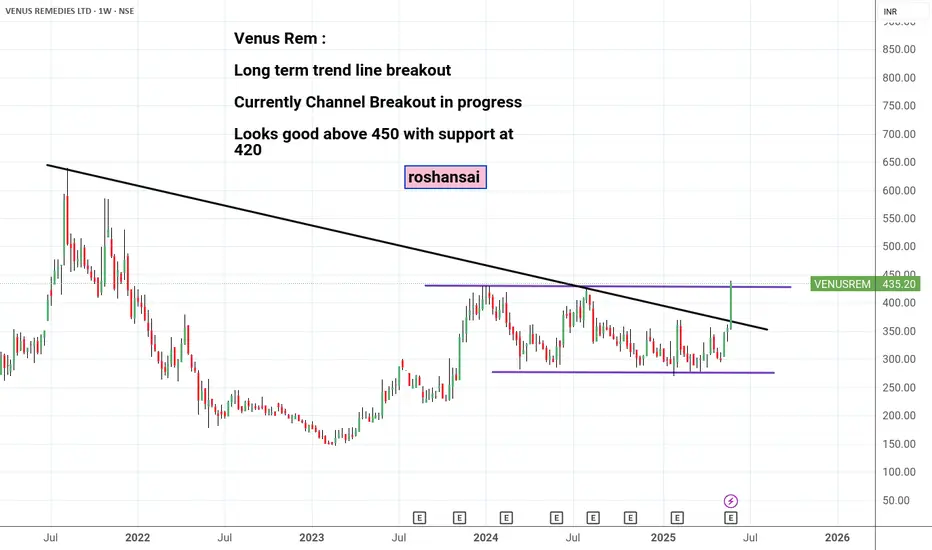
Venus Remedies - Long term breakoutVenus Rem :
Long term trend line breakout
Currently Channel Breakout in progress
Looks good above 450 with support at 420
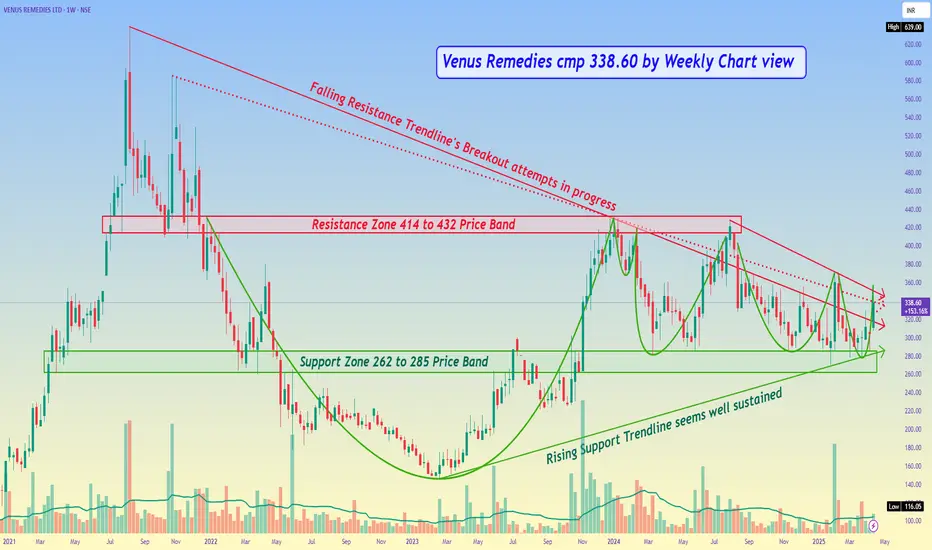
Venus Remedies cmp 338.60 by Weekly Chart viewVenus Remedies cmp 338.60 by Weekly Chart view
- Support Zone 262 to 285 Price Band
- Resistance Zone 414 to 432 Price Band
- Rising Support Trendline seems well sustained
- Falling Resistance Trendline's Breakout attempts in progress
- Bullish Rounding Bottoms with considerate VCP seems in the ma
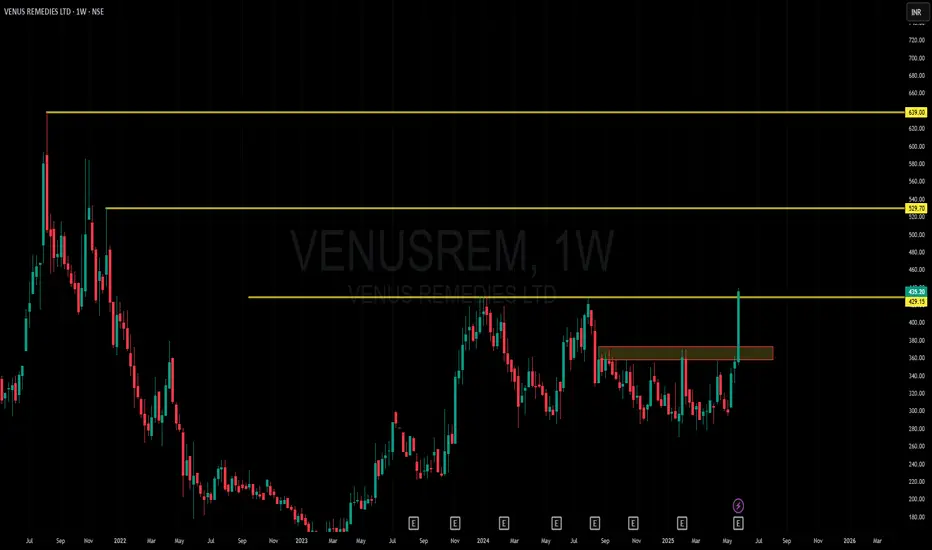
TRENLINE BREAKS IN VENUS REMEDIESVIEW SWING : Entry at cmp stock has broken trendline and getting ready for a good bull swing targets are as per the retracement


Amazing breakout on Weekly / Daily Timeframe - VENUSREMCheckout an amazing breakout happened in the stock in Weekly timeframe, macroscopically seen in Daily timeframe. Having a great favour that the stock might be bullish expecting a staggering returns of minimum 25% TGT. IMPORTANT BREAKOUT LEVELS ARE ALWAYS RESPEECTED!
NOTE for learners: Place the br

Venus RemediesVenus Remedies
Good Set up on Weekly Time Frame ( Double Bottom Breaking out With Impulse Move)
Wait For Cross 270+
SL Below Out Level
Don't think ke aaj 16% about chal gaya he_Agar himmat nai ho rhi then Low Qty se kam kro

See all ideas
Summarizing what the indicators are suggesting.
Oscillators
Neutral
SellBuy
Strong sellStrong buy
Strong sellSellNeutralBuyStrong buy
Oscillators
Neutral
SellBuy
Strong sellStrong buy
Strong sellSellNeutralBuyStrong buy
Summary
Neutral
SellBuy
Strong sellStrong buy
Strong sellSellNeutralBuyStrong buy
Summary
Neutral
SellBuy
Strong sellStrong buy
Strong sellSellNeutralBuyStrong buy
Summary
Neutral
SellBuy
Strong sellStrong buy
Strong sellSellNeutralBuyStrong buy
Moving Averages
Neutral
SellBuy
Strong sellStrong buy
Strong sellSellNeutralBuyStrong buy
Moving Averages
Neutral
SellBuy
Strong sellStrong buy
Strong sellSellNeutralBuyStrong buy
Displays a symbol's price movements over previous years to identify recurring trends.
Frequently Asked Questions
The current price of VENUSREM is 451.90 INR — it has decreased by −0.99% in the past 24 hours. Watch Venus Remedies Limited stock price performance more closely on the chart.
Depending on the exchange, the stock ticker may vary. For instance, on NSE exchange Venus Remedies Limited stocks are traded under the ticker VENUSREM.
VENUSREM stock has fallen by −0.67% compared to the previous week, the month change is a 0.84% rise, over the last year Venus Remedies Limited has showed a 26.94% increase.
VENUSREM reached its all-time high on Aug 9, 2021 with the price of 639.00 INR, and its all-time low was 18.80 INR and was reached on Jul 19, 2019. View more price dynamics on VENUSREM chart.
See other stocks reaching their highest and lowest prices.
See other stocks reaching their highest and lowest prices.
VENUSREM stock is 2.64% volatile and has beta coefficient of 1.29. Track Venus Remedies Limited stock price on the chart and check out the list of the most volatile stocks — is Venus Remedies Limited there?
Today Venus Remedies Limited has the market capitalization of 6.15 B, it has increased by 1.90% over the last week.
Yes, you can track Venus Remedies Limited financials in yearly and quarterly reports right on TradingView.
VENUSREM net income for the last quarter is 96.00 M INR, while the quarter before that showed 210.00 M INR of net income which accounts for −54.29% change. Track more Venus Remedies Limited financial stats to get the full picture.
No, VENUSREM doesn't pay any dividends to its shareholders. But don't worry, we've prepared a list of high-dividend stocks for you.
As of Oct 18, 2025, the company has 1.3 K employees. See our rating of the largest employees — is Venus Remedies Limited on this list?
EBITDA measures a company's operating performance, its growth signifies an improvement in the efficiency of a company. Venus Remedies Limited EBITDA is 623.80 M INR, and current EBITDA margin is 10.18%. See more stats in Venus Remedies Limited financial statements.
Like other stocks, VENUSREM shares are traded on stock exchanges, e.g. Nasdaq, Nyse, Euronext, and the easiest way to buy them is through an online stock broker. To do this, you need to open an account and follow a broker's procedures, then start trading. You can trade Venus Remedies Limited stock right from TradingView charts — choose your broker and connect to your account.
Investing in stocks requires a comprehensive research: you should carefully study all the available data, e.g. company's financials, related news, and its technical analysis. So Venus Remedies Limited technincal analysis shows the sell today, and its 1 week rating is buy. Since market conditions are prone to changes, it's worth looking a bit further into the future — according to the 1 month rating Venus Remedies Limited stock shows the buy signal. See more of Venus Remedies Limited technicals for a more comprehensive analysis.
If you're still not sure, try looking for inspiration in our curated watchlists.
If you're still not sure, try looking for inspiration in our curated watchlists.