V-GUARD IND LTD. (NSE)_Head & Shoulders Neckline Resistance: ₹400–₹410 zone
This is a critical level — a break and close above ₹410 would confirm the breakout.
📈 Trend Outlook
Short-Term: Bullish bias, but needs breakout confirmation.
Medium-Term: If breakout occurs, potential for a strong uptrend targeting ₹430–₹450.
✅ Bullish Signals
Next report date
—
Report period
—
EPS estimate
—
Revenue estimate
—
6.65 INR
3.14 B INR
55.66 B INR
161.06 M
About V-Guard Industries Limited
Sector
Industry
CEO
Mithun Kochouseph Chittilappilly
Website
Headquarters
Kochi
Founded
1977
ISIN
INE951I01027
FIGI
BBG000CN3ZZ6
V-Guard Industries Ltd. engages in manufacturing, trading, and selling of electronic and electro mechanical products. It operates through the following segments: Electronics, Electrical, and Consumer Durables. The Electronics segment includes stabilizers, digital UPS, UPS, and solar inverters. The Electrical segment comprises of polyvinyl chloride insulated cables, LT cables, switch gears, single phase pumps, three phase pumps, and modular switches. The Consumer Durables segment involves electric water heaters, solar water heaters, fans, induction cooktops, mixer grinders, rice cookers, glass-top gas stoves, and air coolers. The company was founded by Kochouseph Chittilappilly in 1977 and is headquartered in Kochi, India.
Related stocks

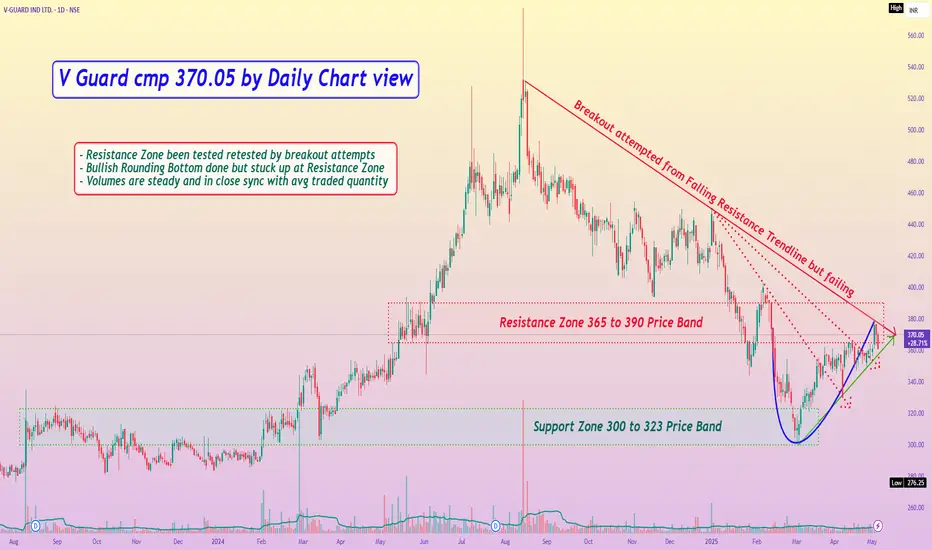
V Guard cmp 370.05 by Daily Chart viewV Guard cmp 370.05 by Daily Chart view
- Support Zone 300 to 323 Price Band
- Resistance Zone 365 to 390 Price Band
- Resistance Zone been tested retested by breakout attempts
- Bullish Rounding Bottom done but stuck up at Resistance Zone
- Volumes are steady and in close sync with avg traded quan
VGUARD reversing from supportVGUARD reversing from support
last session is a good green candle with increase in volume,
good for swing trade

V guard can take a pullback nowThe Price can take a pullback now, and I have marked on the chart from where Price can reverse again, and we can plan or swing Trade wisely

Consolidation breakout is on the cards!Vguard has been consolidating from 2018 in a rising wedge pattern.
Today, the stock has given a breakout of its ATH and is currently looking bullish.
However, the best entry for the stock is 255-260 with a SL of below 235 DCB for minimum target of 300.
The stock can give multibagger after a upward b

Buy V-Guard Short Term Trading Advice by Goodluck Capital
Buy V-Guard
Buy Range- 404 - 410
Target- 430 - 435
StopLoss- below 390
Potential Return- 6-7%
Approx trade duration 14 - 15 days

VGUARD OUTLOOKI used Trend Break and Fibonacci retracement tools to discover VGUARD stock's recent uptrend break and then reversed to previous levels to find probable support levels.
Analysis:
Starting Point: Mentioned on the chart
Ending Point: Mentioned on the chart
Disclaimer: This is for educational purpo

VGUARD is at multi year resistance and there will be long chanceVGUARD is at multi year resistance and there will be long chance and there is a weekly trendline to be broken along with the resistance and a upward channel, if a daily candle closes above the channel and resistance zone and trendline then we can take positional trade and stoploss should be below sw

VGUARD AnlaysisFOR LEARNING PURPOSE
VGUARD- I am going to buy this stock because of the reasons as follows-
1. Its coming out from a good consolidation
2. The breakout candle is good with great volume
3. It is showing better relative strength
4. The risk and reward is favourable
5. Recent results have been good.

Amazing breakout on Weekly / Daily Timeframe - VGUARDCheckout an amazing breakout happened in the stock in Weekly timeframe, macroscopically seen in Daily timeframe. Having a great favour that the stock might be bullish expecting a staggering returns of minimum 25% TGT. IMPORTANT BREAKOUT LEVELS ARE ALWAYS RESPEECTED!
NOTE for learners: Place the br

See all ideas
Summarizing what the indicators are suggesting.
Neutral
SellBuy
Strong sellStrong buy
Strong sellSellNeutralBuyStrong buy
Neutral
SellBuy
Strong sellStrong buy
Strong sellSellNeutralBuyStrong buy
Neutral
SellBuy
Strong sellStrong buy
Strong sellSellNeutralBuyStrong buy
An aggregate view of professional's ratings.
Neutral
SellBuy
Strong sellStrong buy
Strong sellSellNeutralBuyStrong buy
Neutral
SellBuy
Strong sellStrong buy
Strong sellSellNeutralBuyStrong buy
Neutral
SellBuy
Strong sellStrong buy
Strong sellSellNeutralBuyStrong buy
Displays a symbol's price movements over previous years to identify recurring trends.
MOSMALL250
Motilal Oswal Nifty Smallcap 250 ETF Units Exchange Traded FundWeight
0.35%
Market value
49.86 K
USD
HESC
HSBC ETFs PLC - HSBC MSCI Emerging Markets Small Cap Screened UCITS ETFWeight
0.09%
Market value
37.28 K
USD
Explore more ETFs
Frequently Asked Questions
The current price of VGUARD is 363.55 INR — it has increased by 0.99% in the past 24 hours. Watch V-Guard Industries Limited stock price performance more closely on the chart.
Depending on the exchange, the stock ticker may vary. For instance, on NSE exchange V-Guard Industries Limited stocks are traded under the ticker VGUARD.
VGUARD stock has risen by 3.34% compared to the previous week, the month change is a −2.53% fall, over the last year V-Guard Industries Limited has showed a −17.32% decrease.
We've gathered analysts' opinions on V-Guard Industries Limited future price: according to them, VGUARD price has a max estimate of 470.00 INR and a min estimate of 340.00 INR. Watch VGUARD chart and read a more detailed V-Guard Industries Limited stock forecast: see what analysts think of V-Guard Industries Limited and suggest that you do with its stocks.
VGUARD reached its all-time high on Aug 14, 2024 with the price of 577.45 INR, and its all-time low was 2.55 INR and was reached on Oct 27, 2008. View more price dynamics on VGUARD chart.
See other stocks reaching their highest and lowest prices.
See other stocks reaching their highest and lowest prices.
VGUARD stock is 2.32% volatile and has beta coefficient of 1.22. Track V-Guard Industries Limited stock price on the chart and check out the list of the most volatile stocks — is V-Guard Industries Limited there?
Today V-Guard Industries Limited has the market capitalization of 156.96 B, it has decreased by −2.09% over the last week.
Yes, you can track V-Guard Industries Limited financials in yearly and quarterly reports right on TradingView.
V-Guard Industries Limited is going to release the next earnings report on Oct 29, 2025. Keep track of upcoming events with our Earnings Calendar.
VGUARD earnings for the last quarter are 1.70 INR per share, whereas the estimation was 1.95 INR resulting in a −12.82% surprise. The estimated earnings for the next quarter are 1.58 INR per share. See more details about V-Guard Industries Limited earnings.
V-Guard Industries Limited revenue for the last quarter amounts to 14.66 B INR, despite the estimated figure of 15.19 B INR. In the next quarter, revenue is expected to reach 13.68 B INR.
VGUARD net income for the last quarter is 738.50 M INR, while the quarter before that showed 911.30 M INR of net income which accounts for −18.96% change. Track more V-Guard Industries Limited financial stats to get the full picture.
Yes, VGUARD dividends are paid annually. The last dividend per share was 1.50 INR. As of today, Dividend Yield (TTM)% is 0.42%. Tracking V-Guard Industries Limited dividends might help you take more informed decisions.
V-Guard Industries Limited dividend yield was 0.42% in 2024, and payout ratio reached 20.93%. The year before the numbers were 0.42% and 23.75% correspondingly. See high-dividend stocks and find more opportunities for your portfolio.
As of Oct 18, 2025, the company has 7.18 K employees. See our rating of the largest employees — is V-Guard Industries Limited on this list?
EBITDA measures a company's operating performance, its growth signifies an improvement in the efficiency of a company. V-Guard Industries Limited EBITDA is 4.81 B INR, and current EBITDA margin is 9.19%. See more stats in V-Guard Industries Limited financial statements.
Like other stocks, VGUARD shares are traded on stock exchanges, e.g. Nasdaq, Nyse, Euronext, and the easiest way to buy them is through an online stock broker. To do this, you need to open an account and follow a broker's procedures, then start trading. You can trade V-Guard Industries Limited stock right from TradingView charts — choose your broker and connect to your account.
Investing in stocks requires a comprehensive research: you should carefully study all the available data, e.g. company's financials, related news, and its technical analysis. So V-Guard Industries Limited technincal analysis shows the neutral today, and its 1 week rating is sell. Since market conditions are prone to changes, it's worth looking a bit further into the future — according to the 1 month rating V-Guard Industries Limited stock shows the neutral signal. See more of V-Guard Industries Limited technicals for a more comprehensive analysis.
If you're still not sure, try looking for inspiration in our curated watchlists.
If you're still not sure, try looking for inspiration in our curated watchlists.