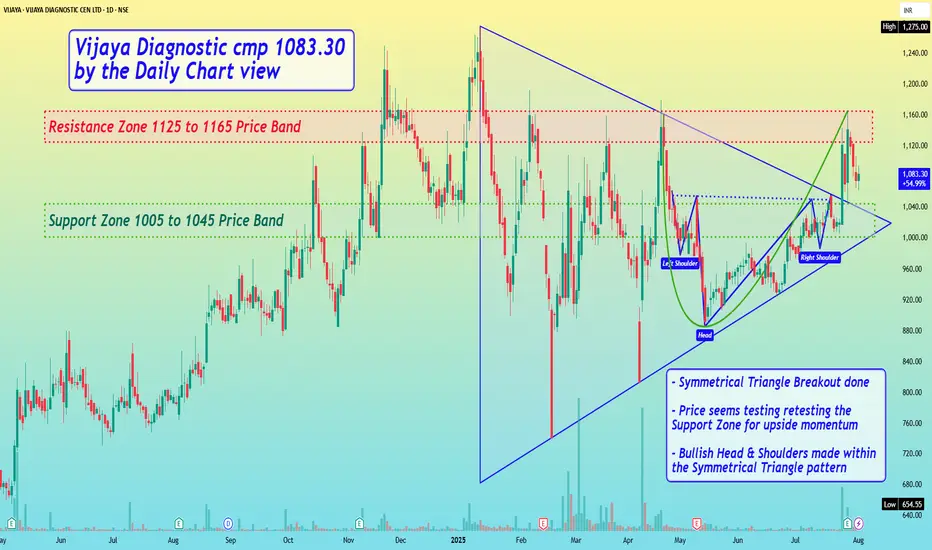
Vijaya Diagnostic cmp 1083.30 by the Daily Chart viewVijaya Diagnostic cmp 1083.30 by the Daily Chart view
- Support Zone 1005 to 1045 Price Band
- Resistance Zone 1125 to 1165 Price Band
- Symmetrical Triangle Breakout done
- Price seems testing retesting the Support Zone for upside momentum
- Bullish Head & Shoulders made within the Symmetrical Tr
Vijaya Diagnostic Centre Ltd.
No trades
Next report date
—
Report period
—
EPS estimate
—
Revenue estimate
—
14.75 INR
1.43 B INR
6.81 B INR
48.75 M
About Vijaya Diagnostic Centre Ltd.
Sector
Industry
CEO
Suprita Reddy Sura
Website
Headquarters
Hyderabad
Founded
1981
IPO date
Sep 14, 2021
IPO offer price
7.26 USD
Identifiers
2
ISININE043W01024
Vijaya Diagnostic Centre Ltd. engages in the provision of diagnostic services, spanning pathological investigations, basic and high-end radiology, nuclear medicine, and related healthcare services. The firm also offers laboratory, radiology, and advanced radiology services. The company was founded by Surendranath Reddy Sura in 1981 and is headquartered in Hyderabad, India.
Related stocks
Vijaya Diagnostic Centre LtdLong time consolidation is going on in Vijaya expecting a very strong and powerful upside moementum as good volume came in

SWING - VIJAYA DIAGNOSTICS
Script taking support from trendline , displaying higher high around 1080 and Breakout from resistance may attempt for higher swing resistance around 1300 levels

Vijaya Diagnostic Centre Ltd: Nearing a Breakout with Bullish PoVijaya Diagnostic Centre Ltd’s stock is getting close to a key level of ₹1,220, while it’s currently at ₹1,061. If it climbs past ₹1,220, it might show the stock’s ready to surge upward. Possible next stops could be ₹1,240, ₹1,280, and ₹1,300

BUY TODAY SELL TOMORROW for 5%DON’T HAVE TIME TO MANAGE YOUR TRADES?
- Take BTST trades at 3:25 pm every day
- Try to exit by taking 4-7% profit of each trade
- SL can also be maintained as closing below the low of the breakout candle
Now, why do I prefer BTST over swing trades? The primary reason is that I have observed that

VIJAYA#VIJAYA - After the low volume pull back, the price is taking the support from 50MA and trying to move up. Stop loss level is on the chart.

Vijaya Diagnostic cmp 1191.00 by Daily Chart viewVijaya Diagnostic cmp 1191.00 by Daily Chart view
- Price Band 1010 to 1030 Support Zone
- Price Breakout sustained above Falling Resistance Trendline
- Price shouldering and respecting along the Rising Support Trendline
- Volumes are spiking heavily over the past few weeks indicating strong demand

Broadening Pattern Support idea with a Counter Trend Twist I daily make educational content for swing / positional trading
The chart displays a classic broadening pattern defined by the yellow ascending trendline and the red resistance line, which form a widening range. A white counter-trendline has emerged, offering a subtle confirmation of a potential re

BUY TODAY SELL TOMORROW for 5%DON’T HAVE TIME TO MANAGE YOUR TRADES?
- Take BTST trades at 3:25 pm every day
- Try to exit by taking 4-7% profit of each trade
- SL can also be maintained as closing below the low of the breakout candle
Now, why do I prefer BTST over swing trades? The primary reason is that I have observed that

Vijaya Diagnostics looks good Positionally. #tradeideas #Vijayadiagnostics. Medium/Long-term idea.
🟢Trying to Breakout From base.
🟢HH-HL structure intact.
🟢Good RSI.
🟢Good quarterly results.
🟢Trading above 50 DMA.
🟢Pharma/Diagnostics/Healthcare sector shows
promise.
🔴Volume needs a bit more improvement.
🔴Weak Market and chances of

See all ideas
Summarizing what the indicators are suggesting.
Neutral
SellBuy
Strong sellStrong buy
Strong sellSellNeutralBuyStrong buy
Neutral
SellBuy
Strong sellStrong buy
Strong sellSellNeutralBuyStrong buy
Neutral
SellBuy
Strong sellStrong buy
Strong sellSellNeutralBuyStrong buy
An aggregate view of professional's ratings.
Neutral
SellBuy
Strong sellStrong buy
Strong sellSellNeutralBuyStrong buy
Neutral
SellBuy
Strong sellStrong buy
Strong sellSellNeutralBuyStrong buy
Neutral
SellBuy
Strong sellStrong buy
Strong sellSellNeutralBuyStrong buy
Displays a symbol's price movements over previous years to identify recurring trends.
ASAO
abrdn Sustainable Asian Opportunities Active ETF Exchange Traded Fund UnitsWeight
0.89%
Market value
467.18 K
USD
MOSMALL250
Motilal Oswal Nifty Smallcap 250 ETF Units Exchange Traded FundWeight
0.24%
Market value
35.82 K
USD
MULTICAP
Mirae Asset Nifty500 Multicap 502525 ETF Exchange Traded Fund UnitsWeight
0.06%
Market value
3.39 K
USD
Explore more ETFs
Frequently Asked Questions
The current price of VIJAYA is 1,029.65 INR — it has increased by 1.24% in the past 24 hours. Watch Vijaya Diagnostic Centre Ltd. stock price performance more closely on the chart.
Depending on the exchange, the stock ticker may vary. For instance, on NSE exchange Vijaya Diagnostic Centre Ltd. stocks are traded under the ticker VIJAYA.
VIJAYA stock has risen by 3.26% compared to the previous week, the month change is a 0.36% rise, over the last year Vijaya Diagnostic Centre Ltd. has showed a −3.40% decrease.
We've gathered analysts' opinions on Vijaya Diagnostic Centre Ltd. future price: according to them, VIJAYA price has a max estimate of 1,275.00 INR and a min estimate of 950.00 INR. Watch VIJAYA chart and read a more detailed Vijaya Diagnostic Centre Ltd. stock forecast: see what analysts think of Vijaya Diagnostic Centre Ltd. and suggest that you do with its stocks.
VIJAYA reached its all-time high on Jan 13, 2025 with the price of 1,275.00 INR, and its all-time low was 295.00 INR and was reached on Jun 14, 2022. View more price dynamics on VIJAYA chart.
See other stocks reaching their highest and lowest prices.
See other stocks reaching their highest and lowest prices.
VIJAYA stock is 2.23% volatile and has beta coefficient of 1.01. Track Vijaya Diagnostic Centre Ltd. stock price on the chart and check out the list of the most volatile stocks — is Vijaya Diagnostic Centre Ltd. there?
Today Vijaya Diagnostic Centre Ltd. has the market capitalization of 103.12 B, it has increased by 0.48% over the last week.
Yes, you can track Vijaya Diagnostic Centre Ltd. financials in yearly and quarterly reports right on TradingView.
Vijaya Diagnostic Centre Ltd. is going to release the next earnings report on Feb 18, 2026. Keep track of upcoming events with our Earnings Calendar.
VIJAYA net income for the last quarter is 432.83 M INR, while the quarter before that showed 383.39 M INR of net income which accounts for 12.90% change. Track more Vijaya Diagnostic Centre Ltd. financial stats to get the full picture.
Yes, VIJAYA dividends are paid annually. The last dividend per share was 2.00 INR. As of today, Dividend Yield (TTM)% is 0.20%. Tracking Vijaya Diagnostic Centre Ltd. dividends might help you take more informed decisions.
Vijaya Diagnostic Centre Ltd. dividend yield was 0.20% in 2024, and payout ratio reached 14.34%. The year before the numbers were 0.16% and 8.60% correspondingly. See high-dividend stocks and find more opportunities for your portfolio.
As of Dec 24, 2025, the company has 2.22 K employees. See our rating of the largest employees — is Vijaya Diagnostic Centre Ltd. on this list?
EBITDA measures a company's operating performance, its growth signifies an improvement in the efficiency of a company. Vijaya Diagnostic Centre Ltd. EBITDA is 2.91 B INR, and current EBITDA margin is 40.50%. See more stats in Vijaya Diagnostic Centre Ltd. financial statements.
Like other stocks, VIJAYA shares are traded on stock exchanges, e.g. Nasdaq, Nyse, Euronext, and the easiest way to buy them is through an online stock broker. To do this, you need to open an account and follow a broker's procedures, then start trading. You can trade Vijaya Diagnostic Centre Ltd. stock right from TradingView charts — choose your broker and connect to your account.
Investing in stocks requires a comprehensive research: you should carefully study all the available data, e.g. company's financials, related news, and its technical analysis. So Vijaya Diagnostic Centre Ltd. technincal analysis shows the buy rating today, and its 1 week rating is buy. Since market conditions are prone to changes, it's worth looking a bit further into the future — according to the 1 month rating Vijaya Diagnostic Centre Ltd. stock shows the buy signal. See more of Vijaya Diagnostic Centre Ltd. technicals for a more comprehensive analysis.
If you're still not sure, try looking for inspiration in our curated watchlists.
If you're still not sure, try looking for inspiration in our curated watchlists.