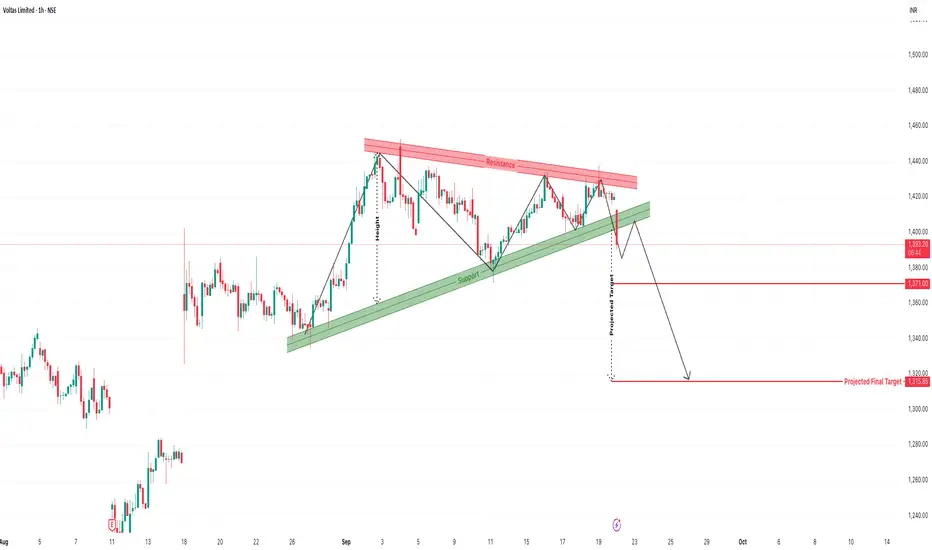
Voltas Bearish Breakdown: Rising Wedge PatternVoltas Ltd, on the 1-hour chart, has recently shown a classic bearish chart pattern — a rising wedge — which has now broken down. This setup often leads to sharp corrective moves, especially when the pattern forms after a strong rally, as seen in this case.
1. Formation of the Rising Wedge
Over the last few trading sessions, Voltas formed a rising wedge pattern, where the price was making higher highs and higher lows, but within a narrowing channel. This usually indicates weakening bullish momentum and sets the stage for a breakdown once the lower support trendline is breached.
2. Breakdown Confirmation
A decisive breakdown below the wedge's support line has been witnessed. This move was backed by a sharp red candle, confirming that bears have taken control. The price is now trading below ₹1400, a psychological round level, adding more weight to the breakdown signal.
3. First Downside Target: ₹1371
Post-breakdown, the immediate short-term target stands at ₹1371. This level may act as temporary support where some buyers might step in. Traders who have entered short trades can consider partial profit-booking at this zone.
4. Final Projected Target: ₹1315.85
If bearish momentum sustains, we can expect a full breakdown as per the wedge height projection, which brings the price target close to ₹1315.85. This would complete the measured move from the wedge breakdown and could serve as a key reversal or bounce zone.
5. Ideal Entry and Stop Loss Levels
Traders looking to ride this move can consider re-entries near ₹1390–1395 on minor pullbacks. A stop loss above ₹1415 would protect against false breakdowns or sudden reversals. This setup offers a high reward-to-risk ratio if managed correctly.
6. Momentum Shifting to the Bears
The breakdown structure shows a shift in control from buyers to sellers. If broader market sentiment also turns weak, Voltas can continue its downward trajectory over the coming sessions. Momentum traders should closely monitor for follow-through price action.
7. Important Trading Note
This is a trend reversal structure. Avoid counter-trend trades until strong support confirmation is seen. Always trail your stop loss once Target 1 is achieved, and don’t hold overnight positions without risk assessment if you’re trading with leverage.
VOLTAS trade ideas
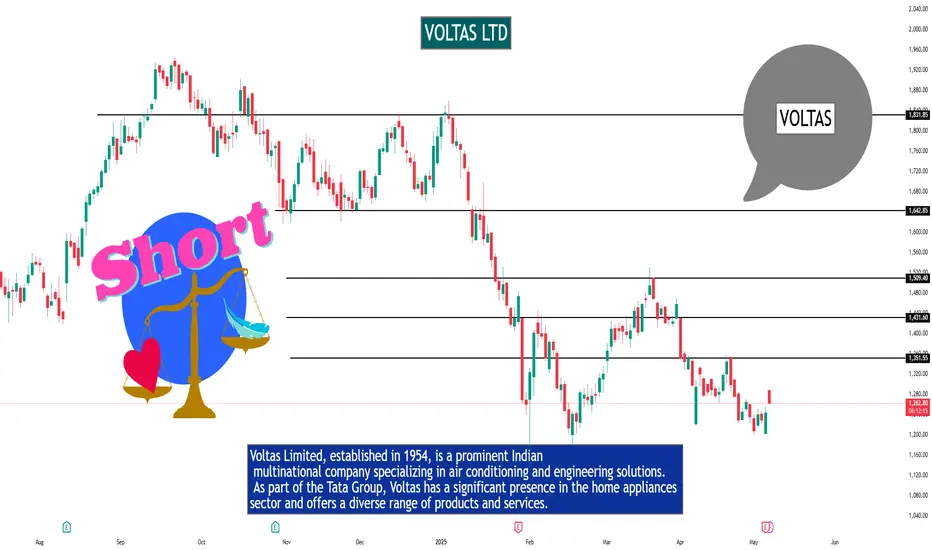
VoltasPrice is facing double top resistance at the 1434 - 1438 zone and had a pullback towards the 1410 zone. Nearby strong support is at 1400.
1400 and 1412 are buying(support) levels. Buy can be initiated depending on the price movement at these levels.
Buy above 1412 with the stop loss of 1400 for the targets 1422, 1430, 1442, 1454, and 1466.
If the price opens below 1410 and moves towards 1400, we can buy when the price shows bullish strength above 1400.
Price is bearish below 1400. Sell below 1395 with the stop loss of 1405 for the targets 1386, 1374, and 1362.
Voltas Ready for a Breakout from Rounding bottom
resistance zone ₹1,416–1,420.
Breakout above 1420 = target ₹1,550 → ₹1,635.
Support: ₹1,360.
⚡ Consumer durables joining the sector rotation trend."
voltas tested ₹1,416 Fib level but faced rejection. RSI remains strong (65+), MACD supportive, indicating trend is still intact. Needs breakout above ₹1,420 for confirmation.
VOLTAS 1HRSWING TRADE
- EARN WITH ME DAILY 10K-20K –
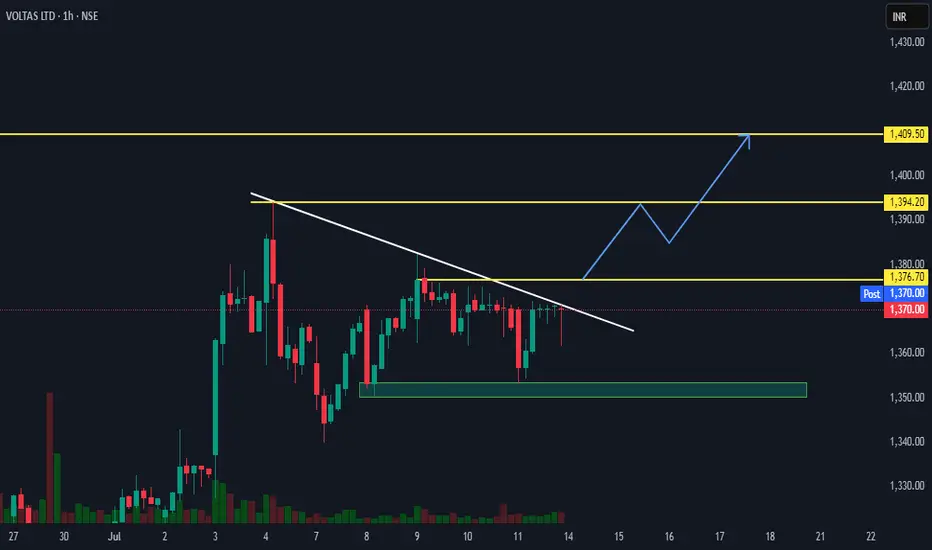
VOLTAS Looking good for upside..
When it break level 1376 and sustain.. it will go upside...
BUY@ 1376
Target
1st 1394
2nd 1409
FNO
VOLTAS JUL FUT – LOT 9 (Qty-3375)
VOLTAS JUL 1360 CE – LOT 9 (Qty-3375)
Enjoy trading traders.. Keep add this STOCK in your watch list..
Big Investor are welcome to join the ride ..
Like this Post??? Hit like button..!!!
Follow me for FREE Educational Post and Alert..
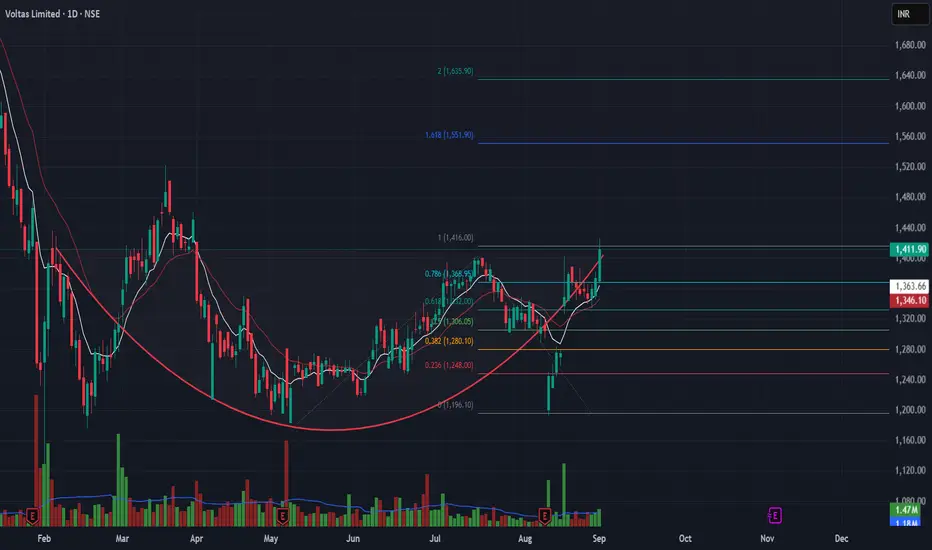
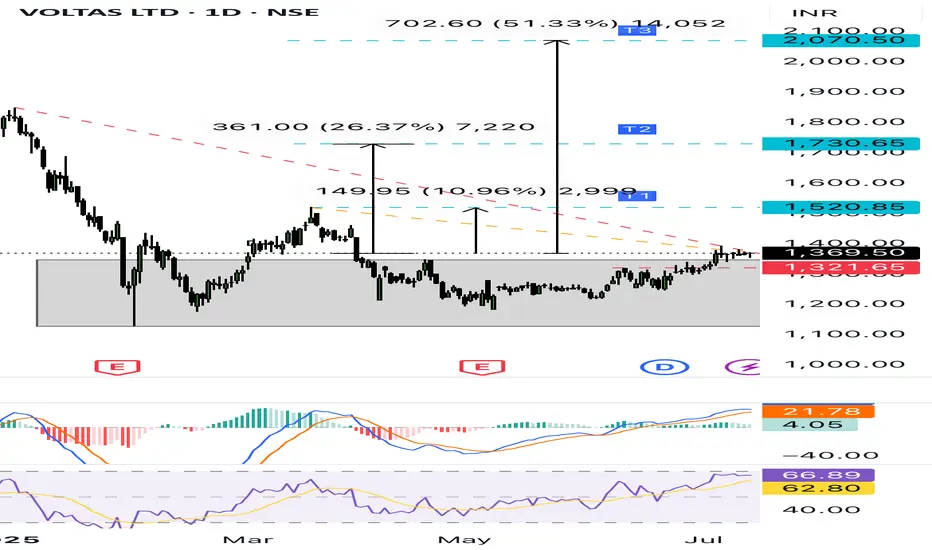
“Voltas Breakout From Multi Month Base | T1₹1520 —> T3 ₹2070”Voltas Ltd is showing a strong base breakout after a long consolidation between ₹1220–1370.
Breakout from multi-month range
MACD crossover just triggered with histogram flip
Descending trendline breakout retested
T1: ₹1520 (10.96%)
T2: ₹1730 (26.37%)
T3: ₹2070 (51.33%)
Stop Loss: ₹1321.65
Disclaimer :- This is an educational idea, not financial advice.
#Voltas #Breakout #SwingTrade #PriceAction #MACD #RSI #TechnicalAnalysis #NSEStocks #IndianStocks
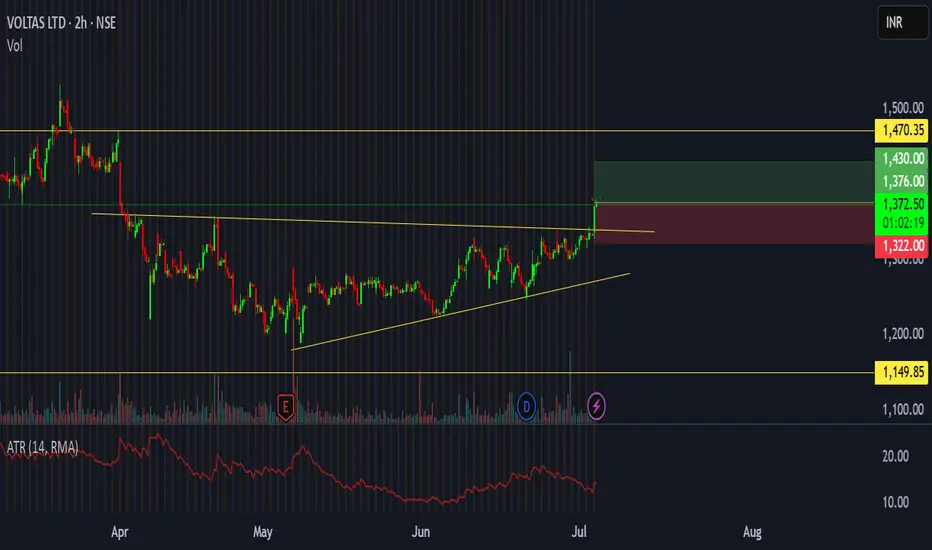
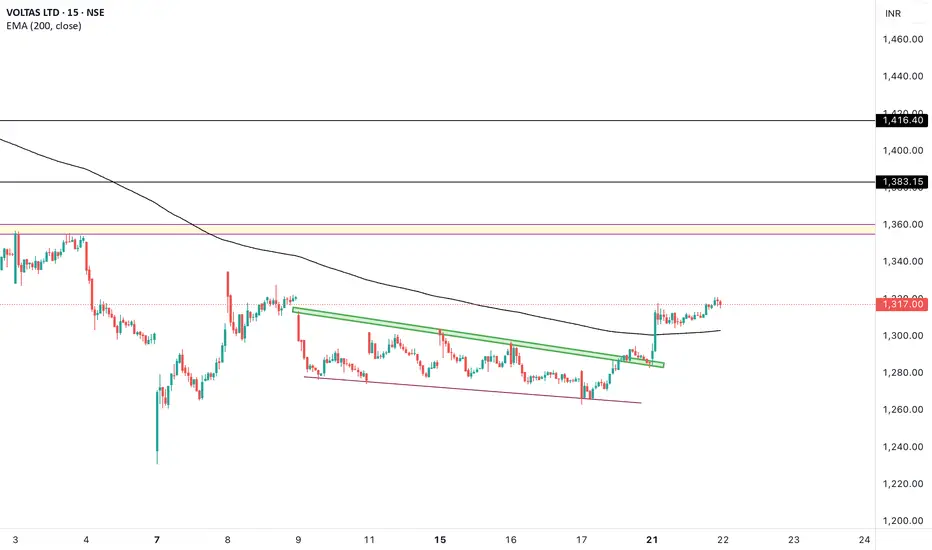
Voltas Short Term TradeThe stock failed to breach the higher time frame support of 1150,
and after bouncing from the support, it has formed a wedge like pattern, with tightening price range,
On breakout , volume and atr surge is also visible,
Thus, for a short term trade,
tgt 1430, sl 1322
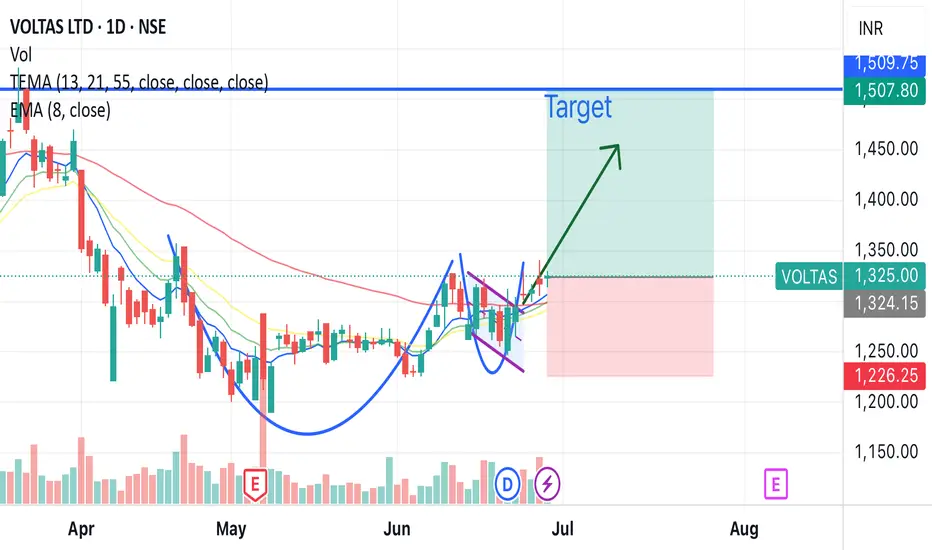
Voltas breakout soon cup and handle patternVoltas will soon be flying, cup and handle breakout pattern, pattern is very prominent, high chances of breakout in short term 15% profit.
Also reaching golden crossover
Buying range - 1310 - 1330
Target - 1507 (15%)
Hold duration - 1-2 month
Voltas belongs to Tata groups and have good fundamentals.
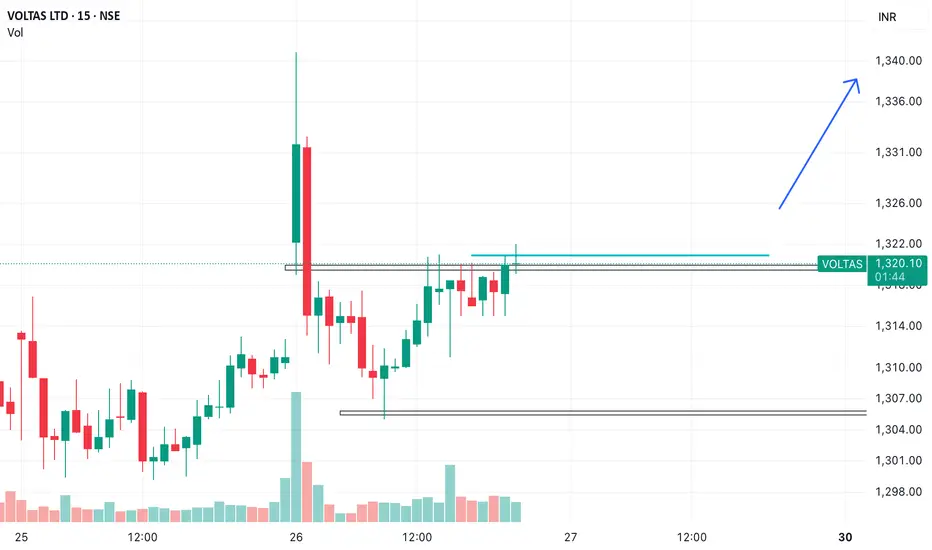
When the Market Hits the Ceiling, But Refuses to Fall
This is one of those patterns where the market shows its hand — then pretends it didn’t. The spike at ₹1,344 was the signal, but the way price retraced and consolidated just below the breakout level is the setup.
What we’re seeing here is not noise — it’s preparation.
⸻
Structure Breakdown:
• False Rejection? Not Quite. That large wick and retracement may look like a rejection, but price has calmly walked back and parked itself just under resistance — suggesting strength, not weakness.
• Compression Below Supply: The consolidation below ₹1,322 resembles a coil loading energy. Classic bull continuation pattern — buyers aren’t rushing, they’re waiting for confirmation.
• Volume Response: Spikes in green volume bars without follow-through selling confirm demand is willing to absorb. This isn’t panic. This is positioning.
• Market Context: A base has been built intraday with higher lows forming, and the stock is respecting its immediate support.
⸻
The Trade – Patience with a Trigger
• Entry Trigger: Break and close above ₹1,322 with volume
• Stop Loss: Below ₹1,312 (structure invalidation)
• Target 1: ₹1,332 (minor hurdle)
• Target 2: ₹1,342–₹1,344 (previous high revisit)
• Risk-Reward: ~1:2 – clean, efficient structure
⸻
Why This Matters
Markets don’t always need to break violently. Sometimes they just refuse to fall — and that’s enough. Voltas is showing intent through inaction — by holding the range and building pressure. When this moves, it could reclaim the earlier high quietly, while the rest of the market is still waiting for another test.
⸻
Don’t chase the wick.
Trade the base it left behind.
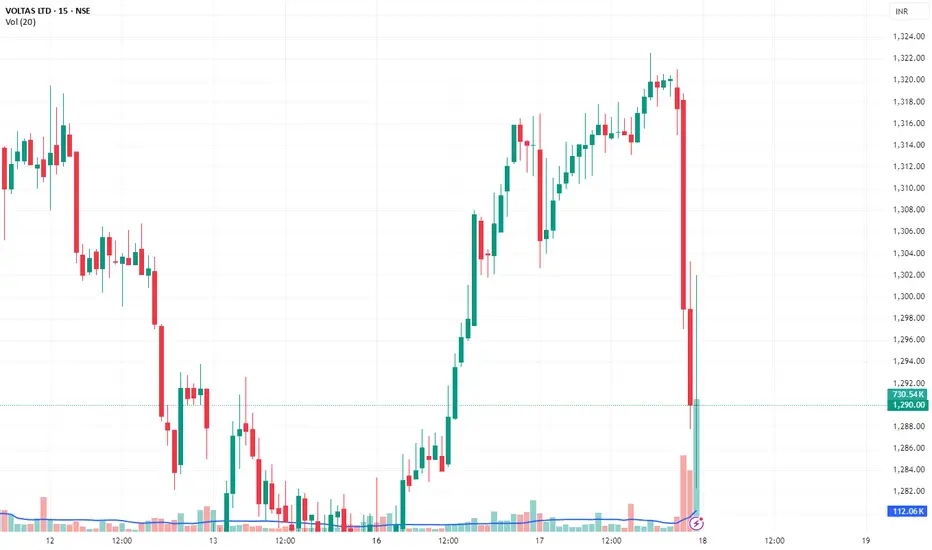
VOLTAS – Fresh Momentum Seen After Breakout from RangeVOLTAS – Fresh Momentum Seen After Breakout from Range
CMP ₹1294.20 | Time Frame: 5-min | Date: June 17, 2025
📊 Chart Summary:
Voltas has broken out above its recent resistance zone near ₹1280 on rising volume.
Price action shows strong higher highs & higher lows, confirming bullish momentum.
A healthy intraday consolidation around ₹1290–₹1295 suggests strength and buyer interest.
🔍 Technical Levels:
Immediate Resistance: ₹1305–₹1312
Support Zone: ₹1278–₹1285 (previous resistance → new support)
Volume Surge: Confirms buying participation on breakout
🎯 Trade Setup:
✅ Buy on Dips Around: ₹1288–1292
→ Target 1: ₹1305
→ Target 2: ₹1320
→ Stoploss: ₹1275
❌ Avoid Shorts Unless: Price falls below ₹1270 with volume
🧠 Bias: Bullish Continuation
📈 Momentum Score: 75%
⚠️ Look for follow-through candles and volume > 5-min avg
🔧 Voltas looks primed for short-term swing towards ₹1320+ if ₹1305 is crossed with strength.
#VOLTAS #BreakoutTrade #SwingSetup #VolumeBreakout #NSEIndia #TradingViewIdea
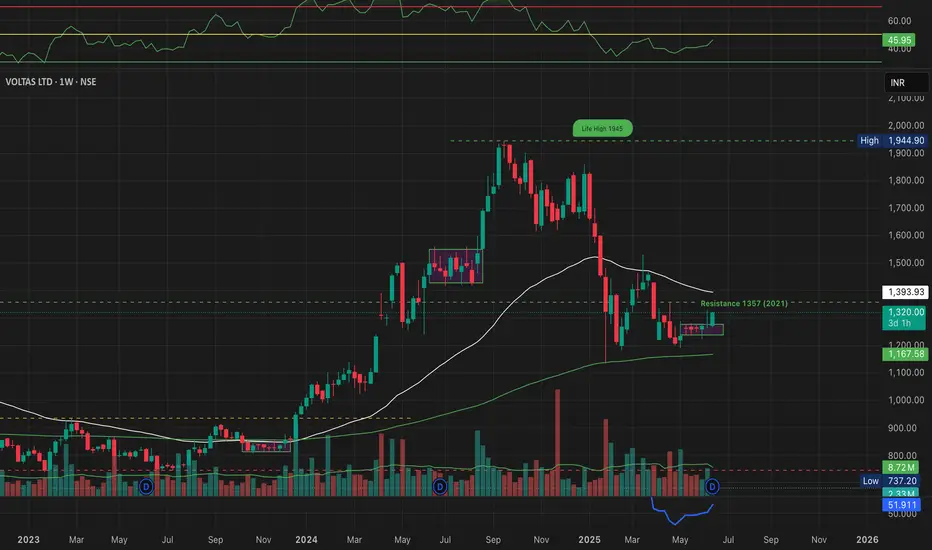
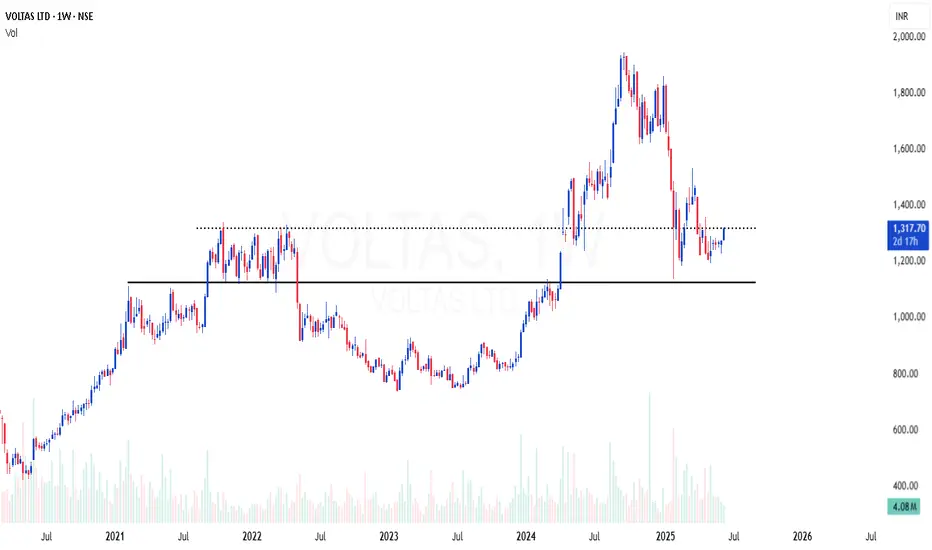
Is This the Right Time to Accumulate Voltas for a Mid-Term Rall?This weekly chart of Voltas Ltd (NSE: VOLTAS) suggests a potential recovery phase after a prolonged downtrend, with key technical levels being tested.
Key Technical Highlights:
• 🟩 Current Price: ₹1,319.90, noticeable volume spike.
• 📏 Resistance Ahead: ₹1,357 — a historic level from 2021, now acting as a critical resistance zone.
• 📉 Life High: ₹1,945 remains the long-term target in case of sustained uptrend.
• ⚙️ RSI Indicator: At 45.95, RSI is neutral but showing early signs of momentum.
• 🔄 Chart Pattern: Recent breakout from tight consolidation, along with increasing volume, could be an early sign of trend reversal.
Investors may watch closely how the price reacts near ₹1,357 — a breakout above could trigger a fresh bullish wave.
⸻
Analysis By Mayur Jayant Takalikar --For
LEARNING & OBSERVATIONAL USE ONLY.
⚠️ Disclaimer:
I am not a SEBI-registered investment advisor.
The analysis is purely for educational and informational purposes. This is not a buy/sell recommendation. Always consult with a certified financial advisor before making investment decisions. Stock market trading involves risks — do your own research.
Aircons ready to fly!
Voltas has broken out above a well-defined resistance zone near ₹1,316–₹1,318 after consolidating for several sessions. The breakout has occurred with momentum, and the price is now attempting to sustain above the previous supply area.
Trade Plan:
• Buy on retest: ₹1,314–₹1,316 (retest of the breakout zone)
• Stop-loss: Below ₹1,307 (structure invalidation)
• Targets: ₹1,330 / ₹1,344
The price action indicates strength after the breakout, and a successful retest of the support-turned-resistance zone could offer a low-risk entry point.

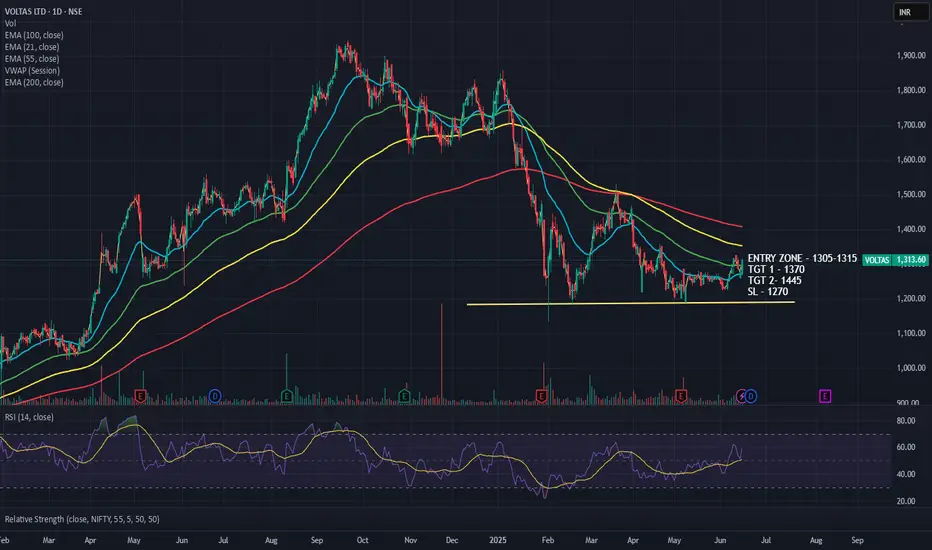
VOLTAS – Ready for Reversal? Swing Breakout in Progress📈 Trade Idea
Voltas has formed a rounded base over the past few weeks and is now showing signs of a strong breakout.
✅ Price above EMA21, EMA55, EMA100
✅ RSI climbing (58.6) = bullish momentum building
✅ Volume spike with breakout candle
✅ Sectoral rotation into capital goods + cooling segment
⚠️ Resistance near ₹1350–1370, but risk-reward looks favorable
🎯 Trade Plan
Entry: ₹1305–1315
Stoploss: ₹1270 (closing basis)
Target 1: ₹1370
Target 2: ₹1445
Time Frame: 5–10 trading sessions
📊 Why This Works
Tata-backed brand with strong infra exposure
Summer orders + Q2 delivery cycle driving demand
Capital goods sector showing early leadership
Ideal accumulation breakout, RSI + VWAP confirm setup
💬 Comment below if you're tracking it. Will update levels live if breakout sustains.
#Voltas #SwingTrade #NSEStocks #Breakout #TradingViewIndia #CapitalGoods #SniperSetup
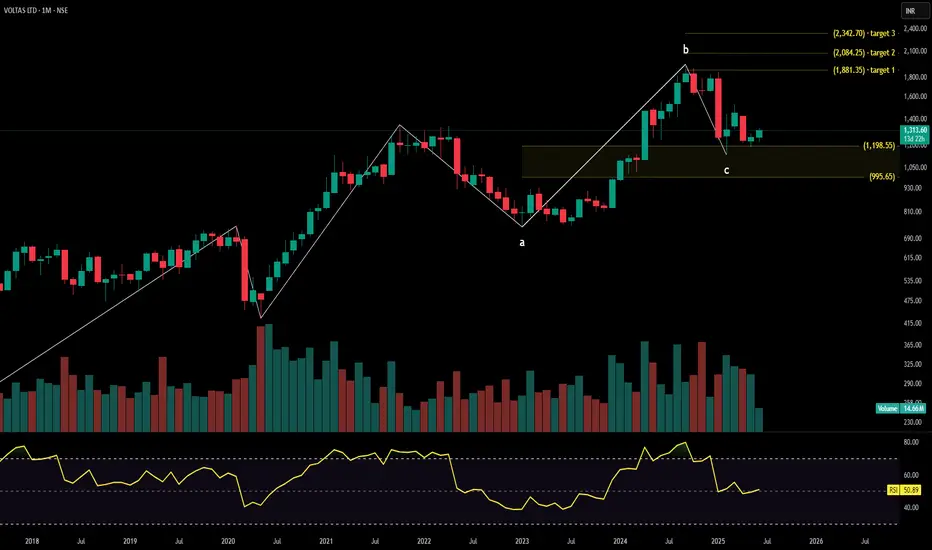
VOLTAS techno-funda analysisVoltas Ltd. (NSE: VOLTAS) is currently trading at INR 1,313.60, reflecting a recent price consolidation. The company is a key player in the air conditioning and engineering services sector, with a strong presence in consumer electronics and infrastructure projects.
Key Levels
Support Levels: INR 995.65, INR 1,198.55, INR 1,326.15
Swing Level: INR 1,444.40
Possible Upside Levels: INR 1,881.35, INR 2,084.25, INR 2,342.70
Technical Indicators
RSI: The Relative Strength Index (RSI) is at 50.89, indicating neutral momentum, suggesting neither strong buying nor selling pressure.
Volume: Trading volume is 14.66M, showing strong investor participation. Higher volume near resistance levels could validate bullish movements.
Sector and Market Context
Voltas Ltd. operates in the consumer durables and engineering projects sector, benefiting from seasonal demand for cooling solutions and ongoing infrastructure development. The industry has seen steady growth, supported by urbanization, rising disposable incomes, and government investments in smart cities and construction. However, raw material price fluctuations, competition from domestic and global brands, and macroeconomic factors could influence the stock’s performance. Investors continue to track consumer demand trends and real estate-driven appliance sales.
Latest News and Developments
Market Trends: Strong institutional interest in home appliance and engineering service stocks due to India’s focus on infrastructure expansion.
Analyst Ratings: Recent reports indicate positive long-term prospects, citing new product launches and partnerships for sustainable cooling solutions.
Quarterly Results: Voltas Ltd. reported stable revenue growth, backed by higher seasonal sales and operational efficiencies.
Dividend Update: The company has announced a dividend payout of ₹5 per share, reinforcing investor confidence in its financial strength.
Analysis Summary
Voltas Ltd. presents a stable technical setup, with RSI and volume suggesting neutral positioning with breakout potential. Sector trends remain favorable, supported by consumer-driven demand for cooling products and ongoing infrastructure projects, though macro risks such as input costs and competition should be monitored. Investors should track price action near resistance levels, industry-wide shifts, and upcoming earnings releases before making investment decisions.
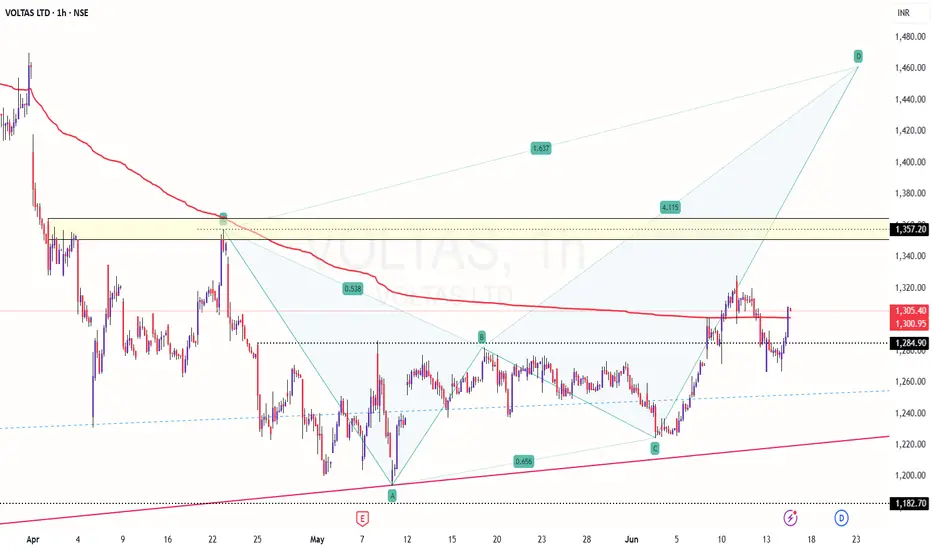
Voltas for 1400+ Bearish Bat Harmonic Pattern in playCMP: 1306
TF: 1 hour
Price is exhibiting HH-HL structure
Bearish Bat Harmonic Pattern formation seen
Price is trading above 200 Period EMA on hourly
A close above 1330 (Daily Super Trend) on Daily TF, could provide further thrust for this script to go up.
1340-60 seem to post a short term resistance, if taken out decisively, price could go past 1400
Disclaimer: I am not a SEBI registered Analyst and this is not a trading advise. Views are personal and for educational purpose only. Please consult your Financial Advisor for any investment decisions. Please consider my views only to get a different perspective (FOR or AGAINST your views). Please don't trade FNO based on my views. If you like my analysis and learnt something from it, please give a BOOST. Feel free to express your thoughts and questions in the comments section.
voltas (swing trade)The double bottom is a classic bullish reversal pattern in technical analysis. It resembles the letter "W", forming after a downtrend when the price hits a support level twice before breaking out upwards.
Key Features:
- Two distinct lows at roughly the same price level.
- A peak (neckline) between the two lows.
- Breakout confirmation when the price moves above the neckline.
Trading Strategy:
- Entry: Traders often enter a long position once the price breaks above the neckline.
- Stop-loss: Placed below the second bottom to manage risk.
- Target price: Typically measured by the distance between the neckline and the bottoms, projected upwards.
Would you like an example of how this pattern plays out in real market conditions?

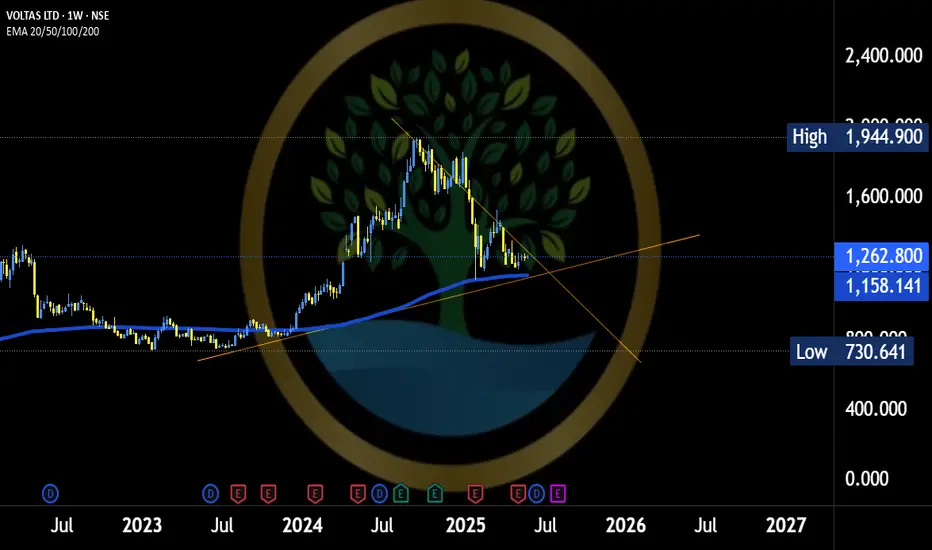
VOLTAS | Excellent area of value in weekly time frameVOLTAS | Excellent area of value in weekly time frame
Weekly 200 EMA support
RSI bullish divergence
Good risk reward
Quality stock at decent correction , looking good for reversal from here
Voltas Ltd Chart AnalysisHere is a **detailed business model for Voltas Ltd**, a leading Indian company in the air conditioning and engineering solutions space.
---
# **Voltas Ltd – Detailed Business Model**
## **1. Company Overview**
* **Name:** Voltas Limited
* **Founded:** 1954
* **Headquarters:** Mumbai, Maharashtra, India
* **Parent Group:** Tata Group
* **Sector:** Engineering, Cooling & Project Services
* **Stock Listing:** NSE and BSE (Ticker: VOLTAS)
---
## **2. Value Proposition**
Voltas delivers reliable and energy-efficient cooling and engineering solutions to both consumers and businesses. Its key value offerings include:
* High-quality, affordable air conditioning and cooling products
* Technical expertise in HVAC (Heating, Ventilation, and Air Conditioning) and MEP (Mechanical, Electrical, and Plumbing) services
* Strong after-sales service network
* Trusted Tata brand legacy
---
## **3. Key Business Segments**
Voltas operates across three main business divisions:
### **A. Unitary Cooling Products (UCP)**
* **Products:**
* Room Air Conditioners (RACs)
* Commercial Refrigeration (freezers, water coolers, etc.)
* Air Coolers, Air Purifiers
* **Brands:**
* Voltas (core AC brand)
* Voltas Beko (joint venture for home appliances)
### **B. Electro-Mechanical Projects & Services (EMPS)**
* **Services:**
* HVAC, MEP contracting, and turnkey project execution
* Infrastructure projects like airports, hospitals, malls, IT parks
* **Markets:**
* India and Middle East (UAE, Qatar, Saudi Arabia)
### **C. Engineering Products & Services (EPS)**
* **Products/Services:**
* Textile machinery, mining & construction equipment, water management
* After-sales service and spares
---
## **4. Customer Segments**
### **A. Retail Consumers (B2C)**
* Middle-income and upper-income households (for ACs, refrigerators, washing machines)
* Small businesses and shops (for commercial refrigeration)
### **B. Businesses & Institutions (B2B)**
* Corporates, real estate developers, industrial clients
* Government agencies (airports, public infrastructure)
* International contractors in the Middle East
---
## **5. Channels (Distribution Model)**
### **A. Consumer Products**
* Multi-brand outlets, retail chains (e.g., Croma, Reliance Digital)
* Voltas exclusive showrooms
* E-commerce platforms (Amazon, Flipkart, Tata CLiQ)
### **B. Project Business**
* Direct sales through business development teams and tender-based contracts
* Partnerships with contractors and consultants
### **C. After-Sales Services**
* Wide service network across India
* AMC (Annual Maintenance Contracts), installation, and servicing
---
## **6. Key Activities**
* R\&D for product design and energy efficiency
* Manufacturing and assembly (ACs, refrigerators, washing machines)
* Marketing and branding
* Project execution for MEP/HVAC
* Customer service and technical support
* Joint venture management (Voltas Beko)
---
## **7. Key Resources**
* Manufacturing plants in Uttarakhand, Gujarat, and others
* Joint Venture with Arçelik (Turkey) for Voltas Beko
* Skilled engineers and technicians
* Tata Group brand reputation and financial backing
* Strong retail and service distribution network
---
## **8. Revenue Streams**
### **A. Unitary Cooling Products (UCP):**
* \~50–55% of total revenue
* Seasonal peak during summer (Q1)
* RACs contribute the majority
### **B. EMPS:**
* \~35–40% of revenue
* Long-cycle project contracts
* Domestic and international markets
### **C. EPS:**
* \~5–10% of revenue
* Industrial and B2B focus
---
## **9. Cost Structure**
* Raw materials (copper, aluminum, plastics)
* Manufacturing and assembly labor
* Marketing and advertising
* Logistics and dealer margins
* Project-specific costs (engineering, site labor, equipment)
* R\&D and quality control
---
## **10. Partnerships**
* **Arçelik (Turkey):** 50:50 JV for Voltas Beko home appliances
* **Tata Group Companies:** Shared services, brand leverage
* **Contractors and builders:** For HVAC and MEP projects
* **Dealers and retailers:** Distribution and sales
---
## **11. Sustainability & CSR Initiatives**
* Focus on **energy-efficient** and **eco-friendly appliances**
* Green buildings and sustainable MEP solutions
* **Skill development programs** for technicians
* Community upliftment and education under Tata CSR framework
---
## **12. Competitive Advantage**
* Market leader in **Room ACs** with \~20–25% market share
* Strong brand loyalty backed by Tata
* Extensive **distribution and service network**
* Integrated portfolio of B2C and B2B services
* Joint venture with Arçelik to tap into growing appliance market
---
## **13. Challenges**
* Intense competition from global brands (LG, Samsung, Daikin, Blue Star)
* Seasonality of air conditioning sales
* Price-sensitive Indian consumer base
* Import dependency for components (especially compressors, PCB boards)
* Execution risks in large projects (cost overruns, delays)
---
## **14. Growth Strategies**
* **Expand Voltas Beko** footprint in refrigerators, washing machines
* **Rural and Tier 2/3 city penetration** for cooling products
* Investment in **inverter ACs and green cooling tech**
* Strengthen **e-commerce and D2C** sales
* Grow international project business in Middle East and Africa
* Enhance **after-sales service quality** and digital customer support
---
## **15. Business Model Canvas (Summary)**
| **Key Partners** | **Key Activities** | **Value Proposition** | **Customer Relationships** | **Customer Segments** |
| ------------------------------------------- | ------------------------------------------- | ------------------------------------------------------------ | ------------------------------------------------------ | ------------------------------------------------------------------ |
| Arçelik, retailers, contractors, Tata Group | Manufacturing, marketing, project execution | Reliable, energy-efficient cooling and engineering solutions | After-sales service, retail support, B2B relationships | Retail consumers, real estate, institutions, government, exporters |
| **Key Resources** | **Channels** | **Cost Structure** | **Revenue Streams** |
| ------------------------------------ | ---------------------------------------------------- | ---------------------------------------------------------- | ------------------------------------------------------------- |
| Factories, JV, Tata brand, workforce | Retail outlets, e-commerce, B2B tenders, D2C service | Manufacturing, raw materials, project execution, marketing | Product sales (ACs, appliances), project income, service fees |
---
Let me know!
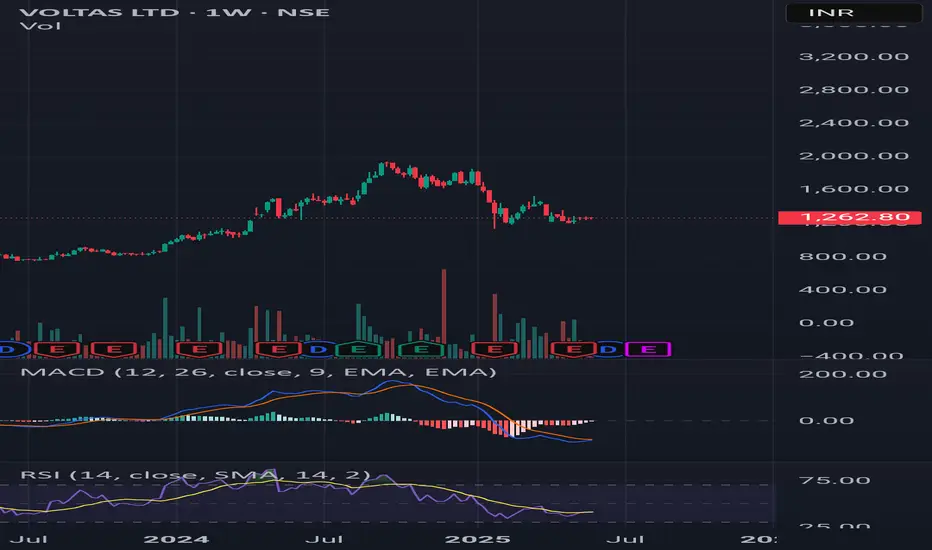
VOLTAS As per weekly chart set, Positive divergence in MACD and RSI is being noticed, the stock was in uptrend from last one year, now stock is trading at 1262 levels from all time high which was 1915, reversal can be seen in next 6 months, one can look for the stock.
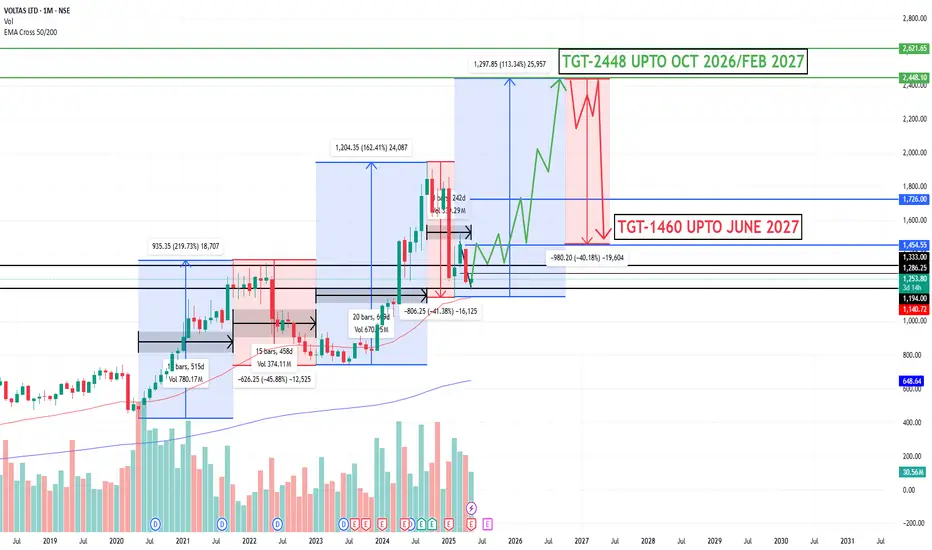
VOLTAS WILL BE SOON FLYING!!!!Here from back MAY 2020 a pattern of 67% correction is continuing.
So from top to cmp exact 67% retracement is been done.
So one can look for long trades at cmp...
CBSL:1000/1100
TGT :2448/2668
TIME PERIOD : 18/20 MONTHS
NO RECOS!
VOLTAS LTDVoltas India Ltd view for Intraday 8th May #VOLTAS
Resistance 1260 Watching above 1263 for upside movement...
Support area 1230 Below 1240 ignoring upside momentum for intraday
Watching below 1228 for downside movement...
Above 1240 ignoring downside move for intraday
Charts for Educational purposes only.
Please follow strict stop loss and risk reward if you follow the level.
Falling wedgeToday if the price falls down and takes support at 200 EMA forming a bullish candle, we can go long.
VOLTAS - Price Analysis & Overview | Bullish1. Clear BO and retest done and now already near tp1
2. I'm not interested in any new entry as RRR is not favourable.
3. It can continue to run to hit the above marked tp points.
- Stay tuned for further insights, updates and trade safely!
- These are my personal views.
- If you liked the analysis, don't forget to leave a comment and boost the post. Happy trading!
Disclaimer: This is NOT a buy/sell recommendation. This post is meant for learning purposes only. Please, do your due diligence before investing.
Thanks & Regards,
Anubrata Ray

VOLTAS: 50% Upside potential⚡ Price Analysis:
1. Simple Setup of Breakout & Retest.
2. EMA supporting the views.
⚠️ Disclaimer: This is NOT a buy/sell recommendation. For learning ONLY. Views are personal. Please, do your due diligence before investing.⚠️
🍀Cheers! 🔥
