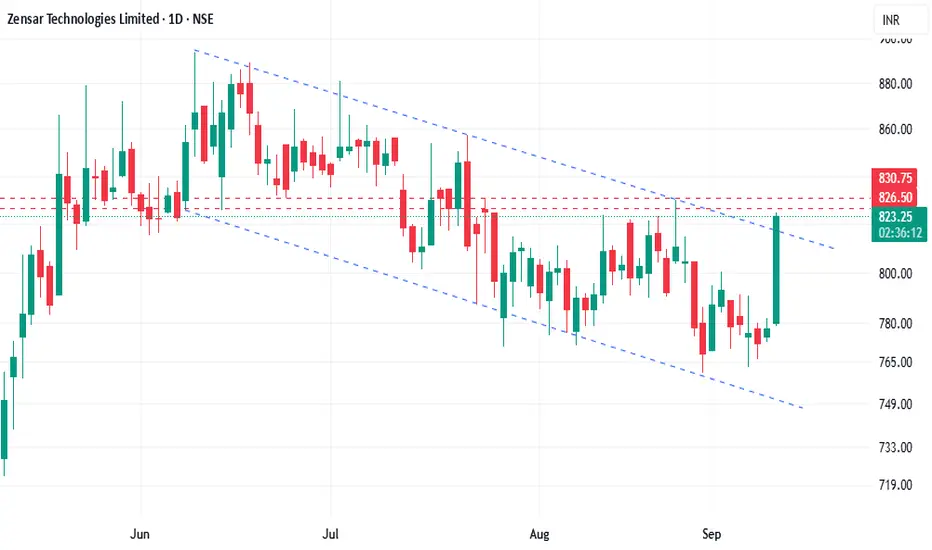
Zensar Technologies Ltd – Technical Analysis (Daily, NSE)Current Price: ₹821.30 (+5.59%)
Trend: The stock has been trading within a falling channel since June, indicating a bearish structure.
Key Development:
A strong bullish breakout candle today, breaking above the mid-channel resistance and approaching the upper trend line of the channel.
Resistance Levels:
Primary Resistance: ₹826.50 – ₹830.75
Next target in case of breakout: ₹850 – ₹865 (previous swing highs).
Support Levels:
Immediate Support: ₹780 – ₹790 zone
Strong support near ₹765 – ₹770.
Price Target (on confirmed breakout):
Short-term target: ₹850 – ₹865.
Conservative target: ₹835 – ₹840 if momentum slows near resistance.
Risk Management:
Place stop-loss below ₹780 to protect against false breakouts.
Monitor volume: Higher volume on the breakout strengthens validity.
If the stock fails to sustain above ₹830, expect consolidation or a potential retest of lower support.
⚠️ Disclaimer:
This analysis is for informational purposes only and should not be considered financial advice or a recommendation to buy or sell any security. Investors should conduct their own research or consult a qualified financial advisor before making investment decisions. Market conditions can change rapidly, and past performance is not indicative of future results.
Trade ideas
Zensar Technologies Ltd. (ZENSARTECH) Stock Analysis### **Zensar Technologies Ltd. (ZENSARTECH) Stock Analysis**
---
#### **Fundamental Analysis:**
- **Company Overview:**
Zensar Technologies Ltd. is a global IT services and consulting company headquartered in India. It provides a range of technology solutions such as digital transformation, cloud computing, enterprise solutions, AI, data analytics, and IT infrastructure management. Zensar serves a diverse set of industries, including retail, manufacturing, financial services, and healthcare, with a focus on delivering innovative solutions to help businesses optimize their operations and customer experiences.
- **Revenue & Profit Growth:**
- **Revenue Trends:** Zensar has been seeing a steady increase in revenue, driven by its focus on digital and cloud transformation services. However, it has faced some challenges in maintaining consistent growth in certain traditional IT services. The company’s revenue growth in the most recent quarters has been strong, particularly in its key markets in North America.
- **Profitability:** Zensar's profitability has improved due to a focus on high-margin services such as cloud, AI, and automation. The company’s operating margins have also seen improvement as it drives cost efficiencies and shifts toward higher-value services.
- **Valuation (as of Feb 2025):**
- **P/E Ratio:** 17.2 (which is fairly priced considering its growth potential in digital services, compared to industry peers)
- **Price-to-Book Ratio:** 2.4 (indicating a reasonable valuation relative to the company's book value, with room for potential upside)
- **Dividend Yield:** 0.8% (Zensar offers a modest dividend, reflecting its reinvestment strategy aimed at expansion and growth)
- **Key Ratios:**
- **Return on Equity (ROE):** 14.6% (a good level, indicating efficient use of equity capital)
- **Return on Assets (ROA):** 6.5% (reflecting decent asset management but room for improvement)
- **Debt-to-Equity Ratio:** 0.1 (low debt levels suggest minimal financial risk and a conservative approach to leveraging)
- **Outlook:**
Zensar Technologies is well-positioned in the growing digital and cloud services market, benefiting from the continued demand for digital transformation across industries. The company’s focus on AI, automation, and cloud solutions aligns well with market trends, making it a promising player for long-term growth. However, its performance will depend on execution in expanding its global footprint, managing competition from larger players, and navigating macroeconomic challenges.
---
#### **Technical Analysis:**
- **Current Price:** ₹380 (as of February 2025)
- **Chart Overview:**
Zensar’s stock has had a volatile ride in the last year, showing a mix of periods of strong growth followed by consolidations. The stock is now in a consolidation phase, with key technical indicators pointing to a potential breakout or a pullback, depending on the broader market movements and news related to its business performance.
- **Support and Resistance Levels:**
- **Immediate Support:** ₹370 (a recent low where the stock has consistently found buying interest)
- **Next Major Support:** ₹340 (a critical support level where the stock could stabilize in case of a broader market correction)
- **Immediate Resistance:** ₹400 (the recent high, which could act as a resistance point in the short term)
- **Next Major Resistance:** ₹420 (the next psychological resistance level, if the stock sees sustained upside)
- **Moving Averages:**
- **50-Day Moving Average (50-DMA):** ₹375 (suggesting that the stock is currently trading slightly above its short-term average, indicating a neutral to slightly bullish trend)
- **200-Day Moving Average (200-DMA):** ₹350 (a solid support level, showing the stock has a positive long-term trend)
- **Relative Strength Index (RSI):**
- RSI stands at 55, which is neutral, indicating that the stock is neither overbought nor oversold. This suggests there could be potential for either a break higher or a short-term correction depending on broader market movements.
- **MACD:**
- The MACD is showing a slight bullish crossover, suggesting that the stock could see some upward momentum. However, the momentum is not strong enough to indicate a significant rally, so investors should watch for a breakout above ₹400 for further confirmation.
---
#### **Key Metrics:**
- **Market Capitalization:** ₹15,000 crore (approx.)
- **52-Week High:** ₹415
- **52-Week Low:** ₹330
---
#### **Risk Considerations:**
- **Competition:** Zensar operates in a highly competitive IT services market, where it faces competition from larger, more established players such as Tata Consultancy Services (TCS), Infosys, and Wipro. Intense competition could put pressure on margins and pricing.
- **Execution Risks:** As Zensar focuses more on high-growth areas like cloud computing and AI, it faces the challenge of executing these strategies effectively and keeping pace with technological advancements.
- **Geopolitical Risks:** Zensar derives a significant portion of its revenue from international markets, particularly North America. Any changes in trade policies, regulations, or economic conditions in these markets could impact the company's performance.
- **Currency Risks:** Zensar, like most Indian IT companies, is exposed to currency fluctuations, particularly the INR/USD exchange rate. A significant depreciation of the rupee could negatively affect margins, especially if the company faces revenue volatility from international clients.
---
### **Conclusion:**
Zensar Technologies Ltd. is a promising player in the IT services sector, with a strong focus on digital transformation, cloud computing, and AI. The company’s steady revenue growth, improving profitability, and low debt levels are attractive for long-term investors. Technically, the stock is in a consolidation phase, with immediate support at ₹370 and resistance around ₹400. A breakout above ₹400 could signal further upside potential, but investors should be cautious of broader market fluctuations.
Zensar's growth trajectory in digital services and automation makes it an attractive option for those seeking exposure to the IT sector. However, the company needs to continue executing its strategy and managing competition from larger players. The relatively low dividend yield and modest growth in profitability might be a consideration for income-focused investors.
---
**Disclaimer:** This analysis is based on publicly available information, and I am not a SEBI-registered advisor. Please conduct your own research and consult a certified financial advisor before making any investment decisions. This is for informational purposes only and should not be considered as financial advice.

zensar technologies Ltd#ZENSARTECH
Stock has taken good support near 880 levels. After crossing 920 levels, more move is possible.
Time period: Swing/Positional call
Target 920/985
Stop loss 882
I am just representing my views
For educational purposes only.
Zensar Technologies is forecast to grow earnings and revenue by 13.6% and 11.6% per annum respectively. EPS is expected to grow by 13.4% per annum. Return on equity is forecast to be 17.4% in 3 years.

Amazing breakout on WEEKLY Timeframe - ZENSARTECHCheckout an amazing breakout happened in the stock in Weekly timeframe, macroscopically seen in Daily timeframe. Having a great favor that the stock might be bullish expecting a staggering returns of minimum 25% TGT. IMPORTANT BREAKOUT LEVELS ARE ALWAYS RESPECTED!
NOTE for learners: Place the breakout levels as per the chart shared and track it yourself to get amazed!!
#No complicated chart patterns
#No big big indicators
#No Excel sheet or number magics
TRADE IDEA: WAIT FOR THE STOCK TO BREAKOUT IN WEEKLY TIMEFRAME ABOVE THIS LEVEL.
Checkout an amazing breakout happened in the stock in Weekly timeframe.
Breakouts happening in longer timeframe is way more powerful than the breakouts seen in Daily timeframe. You can blindly invest once the weekly candle closes above the breakout line and stay invested forever. Also these stocks breakouts are lifelong predictions, it means technically these breakouts happen giving more returns in the longer runs. Hence, even when the scrip makes a loss of 10% / 20% / 30% / 50%, the stock will regain and turn around. Once they again enter the same breakout level, they will flyyyyyyyyyyyy like a ROCKET if held in the portfolio in the longer run.
Time makes money, GREEDY & EGO will not make money.
Also, magically these breakouts tend to prove that the companies turn around and fundamentally becoming strong. Also the magic happens when more diversification is done in various sectors under various scripts with equal money invested in each N500 scripts.
The real deal is when to purchase and where to purchase the stock. That is where Breakout study comes into play.
LET'S PUMP IN SOME MONEY AND REVOLUTIONIZE THE NATION'S ECONOMY!

ZENSARTECH bullish breakout above 847..?? - 23 Jan. ZENSARTECH: Bullish if ~6 month long consolidation range (@840)is broken on good volumes and sustains.
The above information does not constitute investment/trading recommendation and it is purely for educational purpose....
INTRADAY Trading Strategy in 3 stages of breakouts:
1) Impulse upmove stage: The strong upmove (nearly upto 1.5% from trigger-price) happens within five minutes. "High Risk Traders" buy on breakouts in hope of continuation of upmove. "High Risk Traders" may have to patiently wait through the Pullback-Consolidation stage to realize profits. High risk:High reward set up as breakouts may fakeout (reversal)also
2) Pullback-Consolidation stage: After the above "Impulse upmove stage"; the price may then pull back and move sideways (between "Open" price and "High" of the above "Impulse upmove stage"). "Safe traders" with minimum risk profile wait for a breakout from the consolidation stage to enter into trade , to book high profits in the final "Breakout continuation" stage
3) Breakout continuation: Stocks often in the third stage breaks up above the "High" of the first "Impulse upmove stage" and continue to go higher again.(another 2-3%)
Both Safe Traders/High Risk Traders book profits at this stage
SWING Trading Strategy:
Position is kept open, only upon stock closing above the entry price on day closing basis and is held on for 5-10 trading sessions for larger gains (5-10%)
The above information do not constitute, financial, investment, trading, or other types of advice or recommendation. It is purely for educational purpose....

BUY TODAY SELL TOMORROW for 5%DON’T HAVE TIME TO MANAGE YOUR TRADES?
- Take BTST trades at 3:25 pm every day
- Try to exit by taking 4-7% profit of each trade
- SL can also be maintained as closing below the low of the breakout candle
Now, why do I prefer BTST over swing trades? The primary reason is that I have observed that 90% of the stocks give most of the movement in just 1-2 days and the rest of the time they either consolidate or fall
Resistance Breakout in ZENSARTECH
BUY TODAY SELL TOMORROW for 5%

#ZENSARTECH - Add to Watchlist📊 Script: ZENSARTECH
Key highlights: 💡⚡
📈 IHNS Formation in Daily chart.
📈 Price gave a good up move.
📈 Went into a Side Ways consolidation for over a Six months.
📈 Volume spike seen.
📈 MACD Cross Over.
📈 One can go for Swing Trade.
🟢 If you have any questions regarding the setup , please feel free to leave your inquiries in the comments , and I will respond promptly.
BUY ONLY ABOVE 850 DCB
⏱️ C.M.P 📑💰- 823
🟢 Target 🎯🏆 – NA%
⚠️ Stoploss ☠️🚫 – NA%
⚠️ Important: Always Exit the trade before any Event.
⚠️ Important: Always maintain your Risk & Reward Ratio.
✅#Boost, #Like & #Follow to never miss a new idea! ✅
Disclaimer: I am not SEBI Registered Advisor. My posts are purely for training and educational purposes.
Eat🍜 Sleep😴 TradingView📈 Repeat 🔁
Happy learning with MMT. Cheers!🥂

ZENSAR ATH BREAKOUTZensar, 840, gave all time high breakout after multiple attempts. Volumes are supporting. Strong results are backing the stock. Buy with small stop of 815-820 for 880/920/950/1120. Stock also gave breakout of Inverse H&S pattern.

Zensar Technologies W pattern Breakout. 🚨 Zensar Technologies Trade Alert 🚨
🔍 Setup at a Glance:
Pattern: W-pattern forming within a trading channel 📈
Breakout Level: ₹840
Support Zones:
Channel support
200 DMA (holding since March 2024)
Trend: Overall uptrend, trading above key DMAs ✅
Volume: 🚀 2x-3x higher than previous sessions today!
RSI: Strong and supportive – signaling momentum.
💡 Trading Plan:
Entry: Above ₹840 (start small; e.g., buy just 10% of your usual quantity).
If the stock closes above ₹840, you can consider adding more.
Target (T1): ₹1025 (channel top) – +21% upside potential 🎯
Stop Loss (SL): ₹709 – -16% downside risk 🔻
Risk-Reward Ratio (RR): ⚖️ 1:1.3
⚠️ Key Risks & Considerations:
Market Structure:
Currently in a Lower High - Higher Low (LH-HL) sequence.
This trade goes against the broader trend – a higher probability of failure!
Why Consider It?
Exceptional volume and strong RSI, combined with a well-defined W-pattern and breakout level, make this setup compelling.
🚦 Risk Management Tip:
Example Position Sizing: If you usually buy 100 shares, start with only 10 shares initially.
⚠️ Disclaimer: This analysis is for educational purposes only.
Please assess your own risk tolerance and consult with a financial advisor before trading. 📘
💬 What’s your view on Zensar? Let’s discuss in the comments below! 👇

Breakout Soon Candidate! Breakout Soon Candidate!
ZENSARTECH
1- Hovering below Resistance
2- Uptrend is intact
3- Basing Pattern
Keep on Radar.
Potential Upside Stock!

ZENSARTECH - BUYThis stock has following attributes
1) Price > 50 DMA
2) 50 DMA > 200 DMA and diverging
3) Dailiy vol > Avg 30 D Vol
4) Supertrend 14,3 Buy zone
5) ADX > 25 and rising - Momentum increasing
Fibonacci retracement target # 1 - 873 onwards to 1009 where the stock can consolidated since weekly price action offer higher resistance then daily. Has a potential to break out the weekly price action and move northwards as per the daily price action
Analysis for purely academic purpose and doesn't recommend investment


Zensartech LtdBreakout & Retest level..
200 ema as support on daily tf
plan your trades accordingly..

Stock in downtrend: Zensar TechnologiesZensar has been in a downtrend for a long time.
It was trading in a range between 728 to 798 for four months.
It has just broken the support of 728 and trading around 691.
20EMA (Black line) is looking weak and may fall below 50 EMA (Orange line) if the trend continues.
Support levels: 652, 606, 561
The bearishness could be due to the marginal dip in net profit in Jun 2024 quarter (Rs. 157 cr) when compared with Mar 2024 (Rs. 173 cr).

Zensar TechnologiesZensar is trading at a Time Frame of 760-780. Stock Showing buying above 760.
It is right to invest.
Zensar Technologies
Buy Range - 790-800
Tgt - 920 - 960
Sl - 740
Time Frame - 1 Month
The company has reduced debt.
The company is almost debt-free.
The company has been maintaining a healthy dividend payout of 30.8%.

Zensar Weekly W-Pattern Breakout – Bullish Momentum Above 815Observation:
Zensar has been consolidating within a W-pattern over the past weeks, forming higher lows, which indicates increasing buying pressure. The breakout above 815 is significant as it coincides with the trendline resistance, adding to the bullish sentiment.
Description:
With the breakout of the W-pattern and a strong close above 815, Zensar is showing signs of a potential uptrend. One trendline has already been breached, signaling possible upward momentum. This setup offers a swing trading opportunity, but it’s essential to follow your risk management strategy for optimal entry and exit points.

ZENSAR TECHNOLOGIESZensar Technologies is a leading digital solutions and technology services company. It is a part of the Mumbai-based RPG group and is headquartered in Pune, India. It operates in two segments: Application Management Service and Infrastructure management service. It is focused on industry verticals, such as Hitech & manufacturing, consumer services, and banking, financial services, and insurance. They have offices located in India, the USA, UK, Europe, and Africa
Revenue Segments FY24
Hitech : 27%
Manufacturing & Consumer Service: 25%
Banking & financial Services: 38%
Healthcare & Life Sciences: 10%
Geographical Mix FY24
USA : 67%
Europe: 21%
Africa: 12%
Major Clients FY24
Top 5 clients - 31% revenue
Top 10 clients - 42%
Top 20 clients - 68%

ZENSARTECHZensartech is moving after giving a reversal candle. Stock looks promising for a target of 650-750
NOTE: I'm not a SEBI REG. Study before investing.

Ready for Big Breakout Zensar Tech 👀
👉Ready for Big Breakout
👉Huge Volume On Friday
👉Chart Looks Strong
👉Trending Theme
#Zensar #breakoutstock
