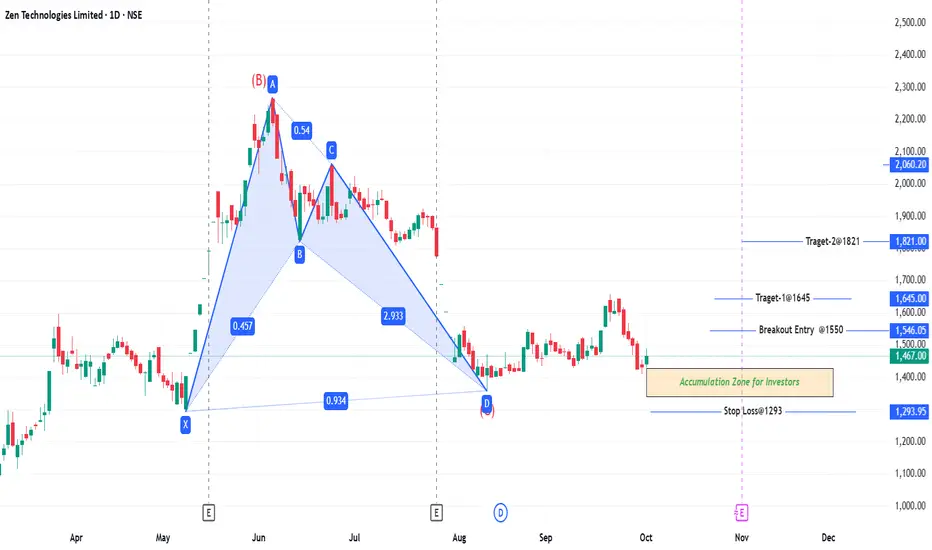
Zen Technologies Limited (ZENTEC) @ critical junctureZENTEC – Technical Outlook; CMP: ₹1467
Based on a comprehensive technical analysis of Zen Technologies Limited (ZENTEC), the stock is currently positioned at a critical juncture, with both Elliott Wave theory and the Bat Harmonic pattern indicating potential trading opportunities.
Elliott Wave A
Next report date
—
Report period
—
EPS estimate
—
Revenue estimate
—
28.25 INR
2.80 B INR
9.74 B INR
45.64 M
About Zen Technologies Limited
Sector
Industry
Website
Headquarters
Hyderabad
Founded
1993
ISIN
INE251B01027
FIGI
BBG000BTLZV8
Zen Technologies Ltd. engages in the provision of training systems and counter-drone solutions. The firm serves police and para-military forces, armed forces, security forces, and government departments such as transport, mining, infrastructure, and civilian market. It offers anti drone system, advanced weapons simulator, containerised tubular shooting range, driving simulator, live ranges, live simulation, shoot edge, and virtual simulation. The company was founded by Kishore Dutt Atluri on June 29, 1993 and is headquartered in Hyderabad, India.
Related stocks
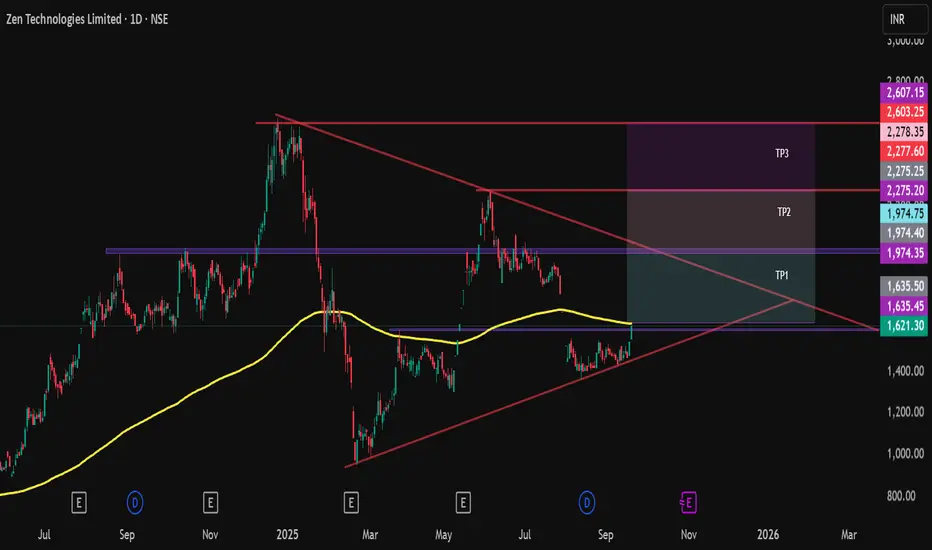
Zen Technology-Breakout Watch at 1630Description:
Zen Technologies (NSE: ZENTECH) is testing a key breakout at the ₹1,630–1,635 zone (200-day MA + horizontal resistance). A daily close above this area with strong volume could trigger targets at ₹1,950 and ₹2,275+. Support lies at ₹1,555 and trendline near ₹1,450.
Recent catalysts incl
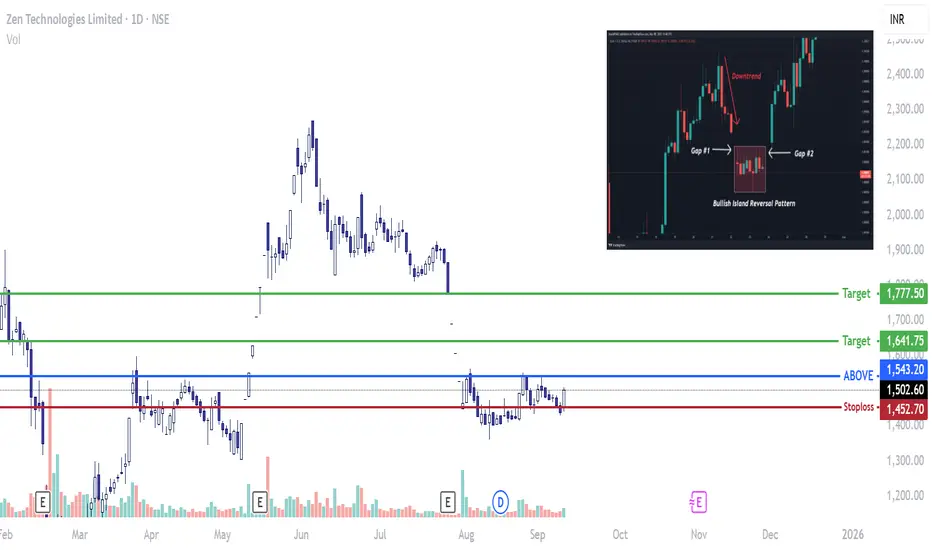
ZEN TECHNOLOGIES - Bullish Island Reversal?A very prominent contender in the Drone Space amongst the defence companies.
Mediocre results plummeted the stock to lower levels but the growth is still intact.
Look out for a gap up opening in days to come.
Low Risk High Reward Setup.
Stoploss is mandatory.
Price Research says Zen technologies Hit 1684 As per price behaviour Zen technologies will hit 1684 soon in 4 to 5 trading sessions.
This is not a trading advice, only education purpose.

A Bullish Continuation Wedge + Elliott WaveIn NSE:ZENTEC the upward movement is likely to resume.
PLEASE NOTE THAT:
This chart analysis is only for reference purpose.
This is not buying or selling recommendations.
I am not SEBI registered.
Please consult your financial advisor before taking any trade

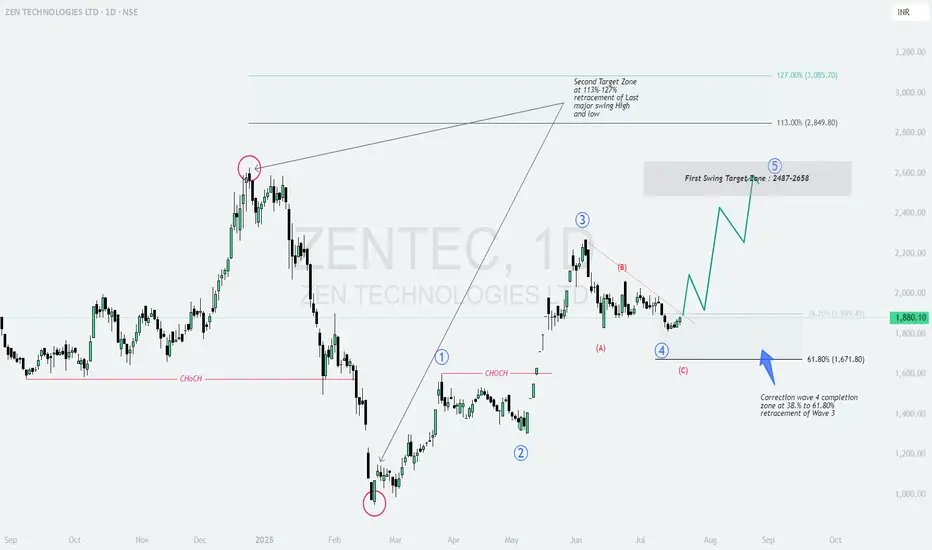
ZENTEC: Wave 4 Correction Complete – Ready for the Next wave?ZEN TECHNOLOGIES LTD (NSE: ZENTEC) – Daily Chart Analysis 🚀
Elliott Wave Structure | Fibonacci Retracement | Swing Targets
1. Why This Setup? 🤔
ZEN Technologies is showing a classic Elliott Wave structure, and the recent price action suggests a high-probability bullish reversal. Here’s why:
BUY TODAY SELL TOMORROW for 5% By Kapil-MittalDON’T HAVE TIME TO MANAGE YOUR TRADES?
- Take BTST trades at 3:25 pm every day
- Try to exit by taking 4-7% profit of each trade
- SL can also be maintained as closing below the low of the breakout candle
Now, why do I prefer BTST over swing trades? The primary reason is that I have observed that

ZEN TECHNOLOGIES - AT OLD SUPPORT - DAILY CHARTZen Technology has taken support at an old support, you may clearly see that in the chart.
Stock is trading under 50ema - almost 22% under 50ema and about 35% down from the ATH.
It is taking support at the same level for the 6th time, so this gives us an edge to decide it is a strong support.
This

Invest in ZENTEC: Pioneering Next-Gen Defence Solutions◉ Abstract
Zen Technologies Ltd is set for strong growth in the Indian defense market. The market is expected to rise from USD 17.40 billion in 2024 to USD 23.05 billion by 2029. The company focuses on advanced training and counter-drone solutions, and is benefiting from government initiatives of p

Zen Technologies Limited - Breakout Setup, Move is ON...#ZENTEC trading above Resistance of 2143
Next Resistance is at 2623
Support is at 1589
Here are previous charts:
Chart is self explanatory. Levels of breakout, possible up-moves (where stock may find resistances) and support (close below which, setup will be invalidated) are cl

See all ideas
Summarizing what the indicators are suggesting.
Neutral
SellBuy
Strong sellStrong buy
Strong sellSellNeutralBuyStrong buy
Neutral
SellBuy
Strong sellStrong buy
Strong sellSellNeutralBuyStrong buy
Neutral
SellBuy
Strong sellStrong buy
Strong sellSellNeutralBuyStrong buy
An aggregate view of professional's ratings.
Neutral
SellBuy
Strong sellStrong buy
Strong sellSellNeutralBuyStrong buy
Neutral
SellBuy
Strong sellStrong buy
Strong sellSellNeutralBuyStrong buy
Neutral
SellBuy
Strong sellStrong buy
Strong sellSellNeutralBuyStrong buy
Displays a symbol's price movements over previous years to identify recurring trends.
MODEFENCE
Motilal Oswal Nifty India Defence ETF Units Exchange Traded FundWeight
2.94%
Market value
2.17 M
USD
SMALLCAP
Mirae Asset Nifty Smallcap 250 Momentum Quality 100 ETF Units Exchange Traded FundWeight
1.20%
Market value
925.69 K
USD
GROWWDEFNC
Groww Nifty India Defence ETF Units Exchange Traded FundWeight
2.33%
Market value
603.34 K
USD
MIDSMALL
Mirae Asset Nifty MidSmallcap400 Momentum Quality 100 ETFWeight
0.48%
Market value
199.84 K
USD
Explore more ETFs
Frequently Asked Questions
The current price of ZENTEC is 1,419.00 INR — it has increased by 0.33% in the past 24 hours. Watch Zen Technologies Limited stock price performance more closely on the chart.
Depending on the exchange, the stock ticker may vary. For instance, on NSE exchange Zen Technologies Limited stocks are traded under the ticker ZENTEC.
ZENTEC stock has fallen by −3.74% compared to the previous week, the month change is a −2.41% fall, over the last year Zen Technologies Limited has showed a −20.37% decrease.
We've gathered analysts' opinions on Zen Technologies Limited future price: according to them, ZENTEC price has a max estimate of 2,225.00 INR and a min estimate of 1,550.00 INR. Watch ZENTEC chart and read a more detailed Zen Technologies Limited stock forecast: see what analysts think of Zen Technologies Limited and suggest that you do with its stocks.
ZENTEC reached its all-time high on Dec 24, 2024 with the price of 2,627.00 INR, and its all-time low was 21.30 INR and was reached on Mar 31, 2020. View more price dynamics on ZENTEC chart.
See other stocks reaching their highest and lowest prices.
See other stocks reaching their highest and lowest prices.
ZENTEC stock is 2.72% volatile and has beta coefficient of 1.93. Track Zen Technologies Limited stock price on the chart and check out the list of the most volatile stocks — is Zen Technologies Limited there?
Today Zen Technologies Limited has the market capitalization of 127.01 B, it has increased by 1.58% over the last week.
Yes, you can track Zen Technologies Limited financials in yearly and quarterly reports right on TradingView.
Zen Technologies Limited is going to release the next earnings report on Nov 3, 2025. Keep track of upcoming events with our Earnings Calendar.
Zen Technologies Limited revenue for the last quarter amounts to 1.58 B INR, despite the estimated figure of 2.50 B INR. In the next quarter, revenue is expected to reach 1.65 B INR.
ZENTEC net income for the last quarter is 477.53 M INR, while the quarter before that showed 1.01 B INR of net income which accounts for −52.74% change. Track more Zen Technologies Limited financial stats to get the full picture.
Yes, ZENTEC dividends are paid annually. The last dividend per share was 2.00 INR. As of today, Dividend Yield (TTM)% is 0.14%. Tracking Zen Technologies Limited dividends might help you take more informed decisions.
Zen Technologies Limited dividend yield was 0.14% in 2024, and payout ratio reached 6.24%. The year before the numbers were 0.10% and 6.47% correspondingly. See high-dividend stocks and find more opportunities for your portfolio.
As of Oct 10, 2025, the company has 739 employees. See our rating of the largest employees — is Zen Technologies Limited on this list?
EBITDA measures a company's operating performance, its growth signifies an improvement in the efficiency of a company. Zen Technologies Limited EBITDA is 3.27 B INR, and current EBITDA margin is 38.79%. See more stats in Zen Technologies Limited financial statements.
Like other stocks, ZENTEC shares are traded on stock exchanges, e.g. Nasdaq, Nyse, Euronext, and the easiest way to buy them is through an online stock broker. To do this, you need to open an account and follow a broker's procedures, then start trading. You can trade Zen Technologies Limited stock right from TradingView charts — choose your broker and connect to your account.
Investing in stocks requires a comprehensive research: you should carefully study all the available data, e.g. company's financials, related news, and its technical analysis. So Zen Technologies Limited technincal analysis shows the sell today, and its 1 week rating is sell. Since market conditions are prone to changes, it's worth looking a bit further into the future — according to the 1 month rating Zen Technologies Limited stock shows the neutral signal. See more of Zen Technologies Limited technicals for a more comprehensive analysis.
If you're still not sure, try looking for inspiration in our curated watchlists.
If you're still not sure, try looking for inspiration in our curated watchlists.