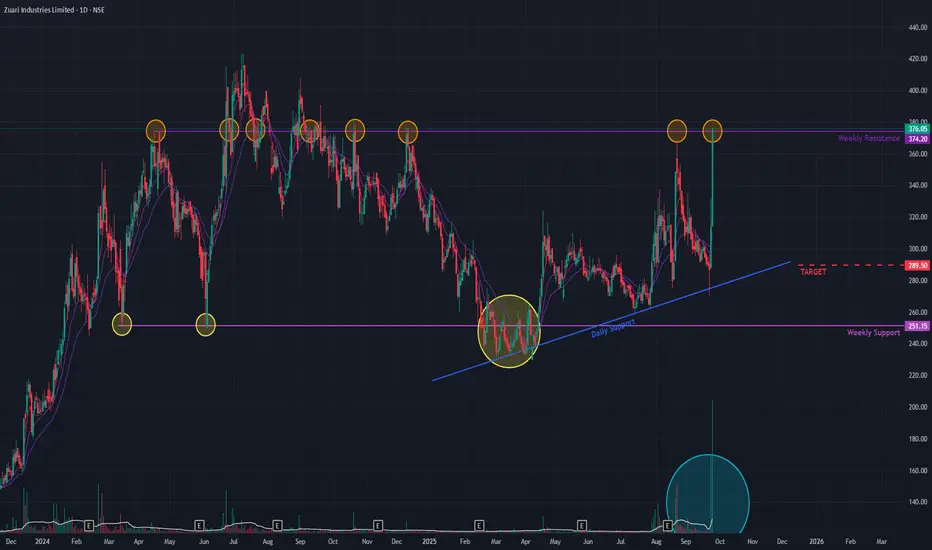
Zuari Ind (D) - Executes a Powerful BreakoutZuari Industries has decisively broken out of a prolonged consolidation phase, signaling a significant shift in momentum. Over the past two trading sessions, the stock has surged an incredible +29.72% , a move backed by a massive volume spike that validates the breakout from a key horizontal resist
−20.10 INR
−932.19 M INR
9.68 B INR
10.56 M
About Zuari Industries Limited
Sector
Industry
CEO
Athar Shahab
Website
Headquarters
Gurgaon
Founded
1967
ISIN
INE217A01012
FIGI
BBG000D2F913
Zuari Industries Ltd. engages in development of real estate projects. Its segments include Engineering, Furniture, Real Estate, Sugar, Power, Investment services, Ethanol Plant and Management Services. The company was founded on May 12, 1967 and is headquartered in Gurgaon, India.
Related stocks
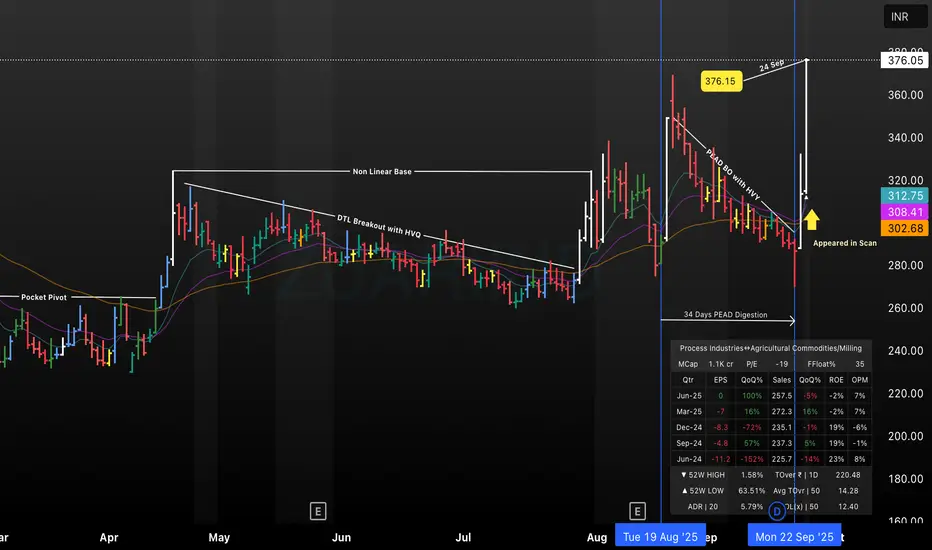
ZUARIIND - PEAD Breakout and Non-Linear Base FormationThis chart captures ZUARIIND’s price action featuring a distinct non-linear base and a classic Pocket Pivot setup followed by a Post-Earnings Announcement Drift (PEAD) breakout. The stock was flagged in a scan on September 22, 2025, after a 34-day PEAD digestion period, resulting in a sharp move fro
ZUARIINDZuari Industries Ltd (4HR)
CMP 392
Previous ATH break and retest done
above 415 close can lead to more upside

✍️Breakout with Volume.
Dr.✍️ PhD
@EquityVedh
#ZUARIIND
It is Engaged in real estate, investment services, engineering services, management services, manufacturing and trading of furniture, manufacturing and sale of sugar and its by-products, ethanol & generation of power.
✍️Breakout with Volume.

ZUARIIND - Ichimoku Breakout📈 Stock Name - ZUARIIND
🌐 Ichimoku Cloud Setup:
1️⃣ Today's close is above the Conversion Line.
2️⃣ Future Kumo is Turning Bullish.
3️⃣ Chikou span is slanting upwards.
All these parameters are shouting BULLISH at the Current Market Price and even more bullishness anticipated AFTER crossing 366

ZUARIIND at all time highSlightly down from its all time high. May be seen as an opportunity to buy some. Caveat though. The stock is under surveillance. Got this warning when trying to buy in Zerodha/HDFCSec.


ZUARIIND Trade set up1. Set up: Cup & Handle Breakout
2. Strength: Strong
3. In line with market
4. Breakout: Yet to confirm the closing for the week
5. RR: Very lucrative

ZUARI stocks is on fire-6 years old resistance breakout
-high volume
-rise in rsi and adx
-strong closing
-above all crucial ema and sma

1 year long Base BO ZUARIIND
+ 1 year long Base BO
+ Huge Green volume bars in the base
+ BO validated with Volume
+ Trading above Key EMAs

See all ideas
Summarizing what the indicators are suggesting.
Oscillators
Neutral
SellBuy
Strong sellStrong buy
Strong sellSellNeutralBuyStrong buy
Oscillators
Neutral
SellBuy
Strong sellStrong buy
Strong sellSellNeutralBuyStrong buy
Summary
Neutral
SellBuy
Strong sellStrong buy
Strong sellSellNeutralBuyStrong buy
Summary
Neutral
SellBuy
Strong sellStrong buy
Strong sellSellNeutralBuyStrong buy
Summary
Neutral
SellBuy
Strong sellStrong buy
Strong sellSellNeutralBuyStrong buy
Moving Averages
Neutral
SellBuy
Strong sellStrong buy
Strong sellSellNeutralBuyStrong buy
Moving Averages
Neutral
SellBuy
Strong sellStrong buy
Strong sellSellNeutralBuyStrong buy
Displays a symbol's price movements over previous years to identify recurring trends.
Frequently Asked Questions
The current price of ZUARIIND is 347.85 INR — it has decreased by −1.21% in the past 24 hours. Watch Zuari Industries Limited stock price performance more closely on the chart.
Depending on the exchange, the stock ticker may vary. For instance, on NSE exchange Zuari Industries Limited stocks are traded under the ticker ZUARIIND.
ZUARIIND stock has fallen by −7.91% compared to the previous week, the month change is a 11.17% rise, over the last year Zuari Industries Limited has showed a −1.09% decrease.
ZUARIIND reached its all-time high on Jul 8, 2024 with the price of 423.40 INR, and its all-time low was 5.30 INR and was reached on Apr 27, 2001. View more price dynamics on ZUARIIND chart.
See other stocks reaching their highest and lowest prices.
See other stocks reaching their highest and lowest prices.
ZUARIIND stock is 6.59% volatile and has beta coefficient of 1.06. Track Zuari Industries Limited stock price on the chart and check out the list of the most volatile stocks — is Zuari Industries Limited there?
Today Zuari Industries Limited has the market capitalization of 10.00 B, it has decreased by −1.42% over the last week.
Yes, you can track Zuari Industries Limited financials in yearly and quarterly reports right on TradingView.
ZUARIIND net income for the last quarter is 520.00 K INR, while the quarter before that showed −207.14 M INR of net income which accounts for 100.25% change. Track more Zuari Industries Limited financial stats to get the full picture.
Yes, ZUARIIND dividends are paid annually. The last dividend per share was 1.00 INR. As of today, Dividend Yield (TTM)% is 0.30%. Tracking Zuari Industries Limited dividends might help you take more informed decisions.
As of Oct 17, 2025, the company has 374 employees. See our rating of the largest employees — is Zuari Industries Limited on this list?
EBITDA measures a company's operating performance, its growth signifies an improvement in the efficiency of a company. Zuari Industries Limited EBITDA is 496.63 M INR, and current EBITDA margin is 5.21%. See more stats in Zuari Industries Limited financial statements.
Like other stocks, ZUARIIND shares are traded on stock exchanges, e.g. Nasdaq, Nyse, Euronext, and the easiest way to buy them is through an online stock broker. To do this, you need to open an account and follow a broker's procedures, then start trading. You can trade Zuari Industries Limited stock right from TradingView charts — choose your broker and connect to your account.
Investing in stocks requires a comprehensive research: you should carefully study all the available data, e.g. company's financials, related news, and its technical analysis. So Zuari Industries Limited technincal analysis shows the buy rating today, and its 1 week rating is buy. Since market conditions are prone to changes, it's worth looking a bit further into the future — according to the 1 month rating Zuari Industries Limited stock shows the buy signal. See more of Zuari Industries Limited technicals for a more comprehensive analysis.
If you're still not sure, try looking for inspiration in our curated watchlists.
If you're still not sure, try looking for inspiration in our curated watchlists.