Silver Getting ready for bull runSILVER is all get for its new bull run.
Gold have already made a new high of $2900+/OZ
SILVER trade ideas

Silver sell on rise levels mentioned on chart read description How to take trades using Harmonic pattern projection Trade setup is explained below :-
To take fresh trade in Buy/ Sell side we have to check if Price if Above / below 23.6 mentioned as D(23.6%)
Then we can take fresh buy or sell trade with SL or recent high/ low mentioned as point D( 0 %).
Targets :
T1: 35 % to 38.2 % level is our 1st Target
( This is reversal zone so if price taking support and not break zone then book profit. If breaking then hold trade with SL just above or below cost)
T2: 50% level is our 2nd Target
T3: 61.8% to 65 % is our 3rd Target
( This is also reversal zone so we have to book profit at this area and if break then take fresh entry with SL of 2nd Target 50% .)
Next Targets are 78.6 % , 88.9 % 100% , 113.5 % , 127.2% , 138.2% ,150% and 161.8% to 165%.
161.8 to 165% if profit booking area so book full profit and wait for reversal.
How to take reversal trade :
If price going upside/ downside then then buy or sell levels appear on Chart ( Automatically show when price reach any reversal zone of harmonic projection parlttern based .
After showing reversal levels wait for confirmation until 23 .6 % level not break if break then exit from current buy / sell trade and take fresh reverse trade buy/ sell .
Trailing SL:
After reach 1st Target trail SL to just above or below cost ( for example we are holding sell trade from 100 1st Target 110 hit then move trailing sl to 104-105 and move SL as price move upside or Downside)
Silver likely to shine !!Silver CMP $32.09
Fibs- The precious metal is at resistance at 32.97. Its next resistance is at $36.50. In my view it is headed for the $48.

Silver- ABC completed Silver has completed ABC move towards upside from the low of 29.70 A completed a 31.70 and B at 30.68 and C at 32.65, which is 100% as per ABC move, if it breaks below 31.85 and sustain below than this ABC will be confirmed and the entire move will become 3 wave correction. Start of wave from 28.74 (A) to the high of 30.97 and mid low of 29.70.(B) and last high of 32.65 (C) at 123 %.
If it break below the 38% of B move than confirmation will be done of correction complete and we may see another push to the downside.

SILVERHello & welcome to this analysis
Since May 2024, Silver (Comex) has surpassed $32.5 only once and failed on 4 attempts (including Fri - 14th Feb). Silver (MCX) has surpassed 96500 only once and failed on 3 attempts (one less due to $:INR impact).
Is this setup a complex H&S in the making (multiple shoulders)? I have my doubts on that because the weekly and monthly patterns are of a cup and handle formation with the latter in the process of currently shuffling out weak hands.
A daily close above 32.50 / 96500 would lead to a strong rally. Strong support now at $31 / 93500
Medium to long term view bullish, short term volatile - waiting for breakout
Regards

Silver (XAG/USD) Gaining Momentum – Next Target $32-$33?Silver is showing strong bullish momentum, currently trading around $31.53, with a +1.25% gain. The price has broken above key resistance levels and is now trading above the 200 EMA (currently at $30.48), which signals a potential continuation of the uptrend.
There's a fair volume range above, along with an internal liquidity level (Int. LQ), which could act as the next target. The market has already filled a previous market block (MB), suggesting that the structure is clean for further upside.
If this bullish momentum holds, the price could push toward $32 - $33 in the short term. A retest of support near $30.50 (200 EMA) would still keep the uptrend intact.

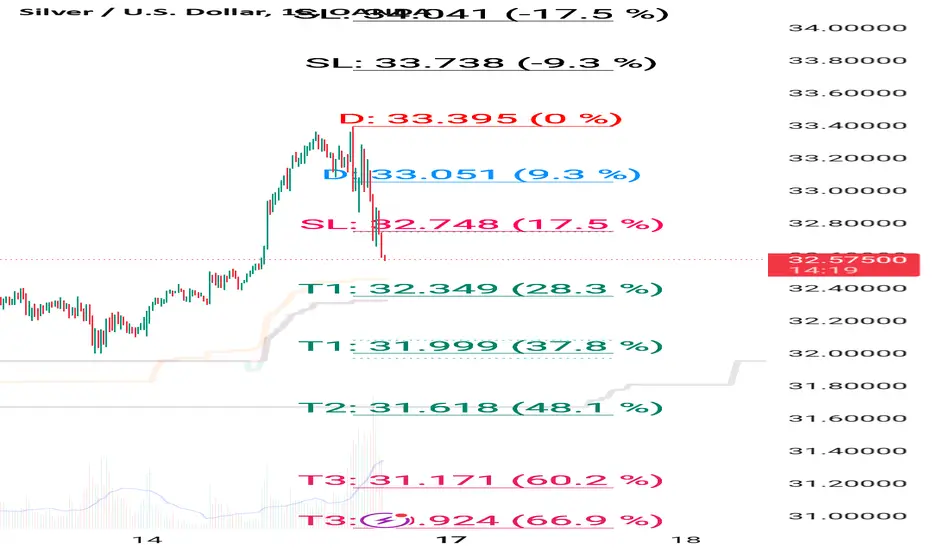
Silver XAGUSD downside Target 31.17 -30.95 sell on riseHow to take trades using Harmonic pattern projection Trade setup is explained below :-
Entry : 1st D point : 0% is recent top or bottom.
Trailing SL: 17.5% is work as trailing SL of buy or sell trade if hit then we have to book profit
.If price goes below 17.5% then early or risky traders can reversal trade ,
Targets :
Target T1 : 28.3%
Target T1 : 37.8 %
Target T3 : 48.1%
T3: 60.2% to 66.9 % is our 3rd Target since this is reversal zone so must book profit if break then take fresh trade again
Next Targets are 77.5 % , 88.1 % 100% , 113.5 % , 127.3% , 141.2% and 160.2 , 177.5. final Target 200%
160.2 to 177.5% if profit booking area so book full profit and wait for reversal.
How to take reversal trade :
If price going upside/ downside then then buy or sell levels appear on Chart ( Automatically show when price reach any reversal zone of harmonic projection pattern based .
After showing reversal levels wait for confirmation until 17.5 % or 28.3 % level not break if break then exit from current buy / sell trade and take fresh reverse trade buy/ sell .
Trailing SL:
After reach 1st Target trail SL to just above or below cost ( for example we are holding sell trade from 100 1st Target 110 hit then move trailing sl to 104-105 and move SL as price move upside or Downside)
Re- Entry :
For Re-entry in any pull back Point D ( 9.3% ) is used for re-entry then SL recent high or low Point D ( 0% ) .
Target is same as early 17.5 % , 28.3 , 37.8 and so on
Blue Line is 1st support/ Resistance
Green line is 2nd support/ resistance
Red line is 3rd Support/ resistance

Silver XAUUSD bought at 31.45 booked at 32.30 How to take trades using Harmonic pattern projection Trade setup is explained below :-
Entry : 1st D point : 0% is recent top or bottom.
Trailing SL: 17.5% is work as trailing SL of buy or sell trade if hit then we have to book profit
.If price goes below 17.5% then early or risky traders can reversal trade ,
Targets :
Target T1 : 28.3%
Target T1 : 37.8 %
Target T3 : 48.1%
T3: 60.2% to 66.9 % is our 3rd Target since this is reversal zone so must book profit if break then take fresh trade again
Next Targets are 77.5 % , 88.1 % 100% , 113.5 % , 127.3% , 141.2% and 160.2 , 177.5. final Target 200%
160.2 to 177.5% if profit booking area so book full profit and wait for reversal.
How to take reversal trade :
If price going upside/ downside then then buy or sell levels appear on Chart ( Automatically show when price reach any reversal zone of harmonic projection pattern based .
After showing reversal levels wait for confirmation until 17.5 % or 28.3 % level not break if break then exit from current buy / sell trade and take fresh reverse trade buy/ sell .
Trailing SL:
After reach 1st Target trail SL to just above or below cost ( for example we are holding sell trade from 100 1st Target 110 hit then move trailing sl to 104-105 and move SL as price move upside or Downside)
Re- Entry :
For Re-entry in any pull back Point D ( 9.3% ) is used for re-entry then SL recent high or low Point D ( 0% ) .
Target is same as early 17.5 % , 28.3 , 37.8 and so on
Blue Line is 1st support/ Resistance
Green line is 2nd support/ resistance
Red line is 3rd Support/ resistance

XAGUSD | Bearish Reversal from Key ResistanceSilver (XAGUSD) is testing a strong resistance zone, showing signs of exhaustion with bearish rejections. If this level holds, we could see a potential downside move.
🔹 Key Factors:
✔ Resistance Zone Holding – Price is struggling to break above a key level.
✔ Bearish Price Action – Rejection wicks and lower highs suggest sellers are stepping in.
✔ Gold Overbought – A potential pullback in Gold could add bearish pressure on Silver.
If this setup plays out, Silver could see a significant drop! Let’s see how price reacts. 📊🔥
What do you think? LMK in comments

US tarrif imposed negative for silver sell on riseHow to take trades using Harmonic pattern projection Trade setup is explained below :-
1st D point : 0% is recent top or bottom.
2nd D Point : 13.5% is work as trailing SL of buy or sell trade if hit then we have to book profit
.If price goes below 13.5% then early or risky traders can reversal trade ,
Safe traders can wait for 27% levels break
Targets :
Target T1 is 27.3% if you are taken entry from 13.5% if taken entry from 27.3 then Target T1: 38.2 % level is our 1st Target
( 38.2% if also a reversal zone so if price reverse then we can make fresh entry also).
T2: 50% level is our 2nd Target
T3: 61.8% to 65 % is our 3rd Target
( This is also reversal zone so we have to book profit at this area and if break then take fresh entry with SL of 2nd Target 50% .)
Next Targets are 78.6 % , 88.9 % 100% , 113.5 % , 127.2% , 141.5% and 161.8% to 165%.
161.8 to 165% if profit booking area so book full profit and wait for reversal.
How to take reversal trade :
If price going upside/ downside then then buy or sell levels appear on Chart ( Automatically show when price reach any reversal zone of harmonic projection pattern based .
After showing reversal levels wait for confirmation until 13.5 % or 27 .6 % level not break if break then exit from current buy / sell trade and take fresh reverse trade buy/ sell .
Trailing SL:
After reach 1st Target trail SL to just above or below cost ( for example we are holding sell trade from 100 1st Target 110 hit then move trailing sl to 104-105 and move SL as price move upside or Downside)
Blue Line is 1st support/ Resistance
Green line is 2nd support/ resistance
Red line is 3rd Support/ resistance

Analyzing Silver's Price Action: Educational Trade IdeaShort Bias Setup:
Entry: Wait for the price to retest the descending trendline (~$31.50) and fail to break above it.
Target: $30.00 (initial), followed by $28.50 if momentum persists.
Stop Loss: Above $32.00 to protect against a trendline breakout.
Alternative Long Opportunity:
Entry: A confirmed breakout above the trendline with high volume (~$32.20).
Target: $33.50 (resistance level) and beyond if the trend reverses.
Stop Loss: Below $31.00 to minimize risk.

Silver sell active below 31.45 1st Target 31.17 hit alsoHow to take trades using Harmonic pattern projection Trade setup is explained below :-
To take Fresh trade : EARLY etry willl be above/ below 13.5% level . Safe traders can enter above or below 27.3% level
Targets :
Target T1 is 27.3% if you are taken entry from 13.5% if taken entry from 27.3 then Target T1: 38.2 % level is our 1st Target
( 38.2% if also a reversal zone so if price reverse then we can make fresh entry also).
T2: 50% level is our 2nd Target
T3: 61.8% to 65 % is our 3rd Target
( This is also reversal zone so we have to book profit at this area and if break then take fresh entry with SL of 2nd Target 50% .)
Next Targets are 78.6 % , 88.9 % 100% , 113.5 % , 127.2% , 141.5% and 161.8% to 165%.
161.8 to 165% if profit booking area so book full profit and wait for reversal.
How to take reversal trade :
If price going upside/ downside then then buy or sell levels appear on Chart ( Automatically show when price reach any reversal zone of harmonic projection pattern based .
After showing reversal levels wait for confirmation until 13.5 % or 27 .6 % level not break if break then exit from current buy / sell trade and take fresh reverse trade buy/ sell .
Trailing SL:
After reach 1st Target trail SL to just above or below cost ( for example we are holding sell trade from 100 1st Target 110 hit then move trailing sl to 104-105 and move SL as price move upside or Downside)
Blue Line is 1st support/ Resistance
Green line is 2nd support/ resistance
Red line is 3rd Support/ resistance

XAGUSD all set to Outperform US30, Short Term Buy Signal!#XAGUSD #US30
Attached: Daily Ratio Chart as of 31st Jan 2025
BULLISH SETUP
- Breakout from Triangle to start an Impulse Rally for the Ratio meaning Money to shift from US Markets to Precious Metals
- This is Positive for the Price of XAGUSD and Negative for the Price of Dow Jones (or US30)

silver crucial update edu pur.silver spot if stya blw 30.30$ thna nxt dwn side move expect 30--29.70$ in mcx blw 90700 expect 90000--89344++++ where 3 0.60 in mcx 91350 if stya abv than trend change for up side move

SILVER all set to MASSIVELY OUTPERFORM Banking Stocks!Attached: Silver Spot vs. IndusInd Bank Monthly Chart as of 22nd January 2025
I have taken Indusind Bank as a proxy for Indian Banking Stocks as it is a Major Large Cap Private Bank that is not only part of Bank Nifty but also part of Nifty 50 and once used to be part of Top 20 Nifty stocks but because it crashed 40% in 2024 it lost that spot
The Monthly Ratio Chart has the following Observations that support a Bullish Investment Case for Owning Silver vs. Indian Banking Stocks, they are as follows:
1) 20/ 50 Monthly EMA Bullish Crossover for the first time since 2009
2) Ratio closing above 100 Month EMA and consolidating for the Next Leg Up
3) Ichimoku Cloud Resistance that held for more than a Decade also getting cleared
And the Upside as shown on the Ratio Chart is crazy which if you translate to a Price Chart, means Silver over the years can see Triple Digit Returns, Doubling to Quadrupling!

Bullish Divergence on Silverspotted bullish divergence on Silver, shorts may get trapped ,
i think time to make long entry @28.80--28.85
target 29.7/90.4/91.0
lets see

bullish head & shoulder on SilverBullish Head & shoulder on silver hourly basis cmp29.57, target is mentioned above 30.5 . even K trend on hourly basis is bullish
lets see

Deep Crab pattern SilverDeep Crab pattern Silver
expect silver to hit levels as mentioned
only than we will see if reversal possible .

SILVER This is very Bullish Chart Quarterly , Monthly and Daily t/f
target Should be around in 42-45$
Let see how things pan out considering US inflation expected to be in upward trajectory

Silver's Ready to Shine? The Silver showing good bullish sentiment as the price has shown resilience by bouncing off significant support and breaking through resistance levels.
Expecting a move towards 34.0000 is is possible if buyers defend 29-30 level on daily TF, especially if the price can maintain above the recent highs and continue to show higher volume on upward movements.
The price has recently moved through a liquidity zone around 30.51025, suggesting that smart money might have taken advantage of this area to initiate trades, pushing the price higher.
The volume at the recent low was significantly higher , indicating strong buying pressure at this level, which is positive for a bullish outlook.
So i think it is good idea to consider a swing buy at current price level i.e., around 30-30.35 area for the target of 34,40 and 50.

SILVER OUTLOOK NEXT WEEK Our Spot #Gold Range Prediction from 13/01/2025 to 18/01/2025 is as under.
Gold Spot :2605$-2710$
Gold INR : 76200-78800
Our Spot #Silver Range prediction from 13/01/2025 to 18/01/2025 is as under.
Silver Spot: 28.30$-30.80$
Silver INR: 86450-92900
It must be remembered that price of precious metal depends on so many world wide factors like inflation, Fed interest rate, trade barrier, geopolitical tension, demand, supply, bond yield, dollar index , GDP, payroll data, CPI, currency fluctuation, debt ceiling , expected tax & duty changes, other commodity price crude oil etc. etc. and hence there can not be any accurate barometer of predicting precious metal price.
Gold INR has been calculated taking Gold Spot international price and converting the same assuming fixed Indian rupee rate. However, this is not accurate method as change in rupee value to dollar can substantially impact Gold INR price. Pl. note that price of commodity doesn't depend upon performence of company but depend upon performence of world economy, hence it is extremely risky to trade in commodities. Commodities market also become more volatile during contract expiry.
These are not a recommendation for buy or sell. This view is only for educational purpose. You are requested to consult your financial advisor before entering in to any trade.

XAGUSD booke 100+ pips profit this week buy on dip trend positivDisclaimer -
This information is only for educational purposes, this is not for any buy or sell recommendations .
On Our Harmonic pattern indicator
based trade setup take trade as explained below :-
ENTRY -
When price breaks Trailing SL (risky traders can take entry after breaking SL 15 % ,safe traders can take entry after breaking SL 30 % )retracement Which is SL points then take Entry on Buy or Sell Trade
SL -
D points Which is recent High / Low mentioned in Chart is our SL
TARGET -
Target 1- (T1 : 38.2)
Target 2- (T2 : 50 %)
Target 3- (T3 : 61.8%)
Target 4- (T4 : 78.6%)
Please note:-
It's working on news based and volitile market very well so exit if SL hit

Silver holding buy from 29.95 , upside Target on chart Disclaimer -
This information is only for educational purposes, this is not for any buy or sell recommendations .
On Our Harmonic pattern indicator
based trade setup take trade as explained below :-
ENTRY -
When price breaks Trailing SL (risky traders can take entry after breaking SL 15 % ,safe traders can take entry after breaking SL 30 % )retracement Which is SL points then take Entry on Buy or Sell Trade
SL -
D points Which is recent High / Low mentioned in Chart is our SL
TARGET -
Target 1- (T1 : 38.2)
Target 2- (T2 : 50 %)
Target 3- (T3 : 61.8%)
Target 4- (T4 : 78.6%)
Please note:-
It's working on news based and volitile market very well so exit if SL hit
