Silver XAGUSD buy on dip will continue new ATH will come AI DataParameter Data Data
Asset Name Silver COMEX (XAGUSD Spot)
Current Trade 🟨 WAIT & WATCH (Trend is Bullish, but price is near R1/ATH. Fresh entry only on breakout or S1 retest)
Price Movement 🟩 Strong Bullish/Consolidation (+0.10% approx.)
SMC Structure 🟩 Bullish Order Flow (ATH Breakout) / Price testing major supply/resistance zone.
Trap/Liquidity Zones Bullish Trap Zone: Above $59.50 (Potential ATH liquidity grab). Liquidity Target: $57.00 - $57.50 (Previous ATH retest zone).
Supports 🟩 S1: $57.07 (Key Pivot/First Support) 🟩 S2: $55.76 (Strong Technical/Pivot) 🟩 S3: $54.63 (Major Structural Support)
Resistances 🟥 R1: $59.51 (Immediate Resistance/Pivot) 🟥 R2: $60.64 (2nd Pivot Resistance) 🟥 R3: $61.96 (3rd Pivot Resistance/Short Term Target)
Risk Reward 1 : 1.5
Probability 🟩 65% Upside Continuation (Strong fundamental/structural factors)
Confidence 🟩 25/30 (Trend and structure both strong; volatility is high)
Max Pain 🟨 N/A (Minimal relevance for spot commodities)
DEMA Levels 🟩 Price well above 20/50 DEMA (Structural uptrend intact)
ADX/RSI/DMI 🟥 RSI (14) \approx 70.89 (Overbought). ADX (14) \approx 32 (Strong trending market)
Market Depth 🟩 Skewed Towards Buy-Side (Deep order book at lower levels)
Volatility (IV/RV) 🟥 High/Rising Volatility (Sharp swings expected)
Source Ledger COMEX, Shanghai Futures Exchange (SFE) Inventories, ETF Flows, DXY Correlation
OI (Open Interest) 🟩 Long Buildup (High OI, confirming strong long positions)
PCR (Put-Call Ratio) 🟩 N/A - Favorable/Bullish (General options positioning supports trend)
VWAP 🟩 Price trading significantly above VWAP (Very bullish short-term bias)
Turnover 🟩 High (High volume trading due to squeeze/demand)
Harmonic Pattern 🟩 Cup and Handle Pattern (Target \approx 65.00 expected, confirming bullish continuation)
IV/RV 🟨 IV Skew: Neutral (No extreme downside protection demand)
Options Skew 🟨 Neutral-to-Positive (Call-side option demand slightly higher)
Vanna/Charm 🟨 N/A (Neutral)
Block Trades 🟩 Institutional Buys Detected (Strong institutional conviction)
COT Positioning 🟩 Net Long (Speculators heavily net long, adding to momentum)
Cross-Asset Correlation 🟩 Strong Positive with Gold / 🟥 Strong Inverse with DXY
ETF Rotation 🟩 Strong Inflows (Silver ETFs mein record inflows)
Sentiment Index 🟩 Extreme Greed (High market optimism)
OFI (Order Flow Index) 🟩 Strongly Positive (Buy-side flow dominant)
Delta 🟩 Call Delta Active (Market momentum ki confirmation)
VWAP Bands 🟥 Price Upper Band ke aas-paas hai (Sign of over-extension)
Rotation Metrics 🟩 Commodity/Metals leading the rotation
Market Phase 🟩 Mark-Up (Strong uptrend, pullbacks are buying opportunities)
Trade ideas

XAGUSD SPOT VIEWxagusd 59.20 Above Up Move Possible 61.00 63.00
Below Down Move 53.70 50.00
50.00 Strong Support Below Down Possible
48.00 to 47.00 Strong Support Reversal Possible

XAUGSD VIEW 60.20 Above Sustain Strongly Then Up Move 63.50 65.00
60.20 Below Sustain Strongly Then Down Move 57.60 55.00

Real-Time XAG/USD Chart Analysis: Bullish Momentum Builds TowardFOREXCOM:XAGUSD
Real-Time XAG/USD Chart Analysis: Bullish Momentum Builds Toward $60
As of December 8, 2025 (Intraday: Early Trading)
Current Price: 58.31 USD (Down ~0.08% from previous close of 58.36; trading range: 57.59–58.74)
Asset: XAG/USD (Silver Spot vs. US Dollar)
Key Context: Silver's consolidating just shy of its all-time high of 59.42 hit earlier this week, with fresh ETF inflows and tightening physical inventories underscoring the uptrend. Amid Fed rate-cut bets and robust industrial demand (solar, AI), the technical setup leans Strong Buy—a pullback could be a gift for longs eyeing new records.
Quick Macro Snapshot
Tailwinds: Weaker USD from softer PCE inflation and labor data, plus record SLV ETF inflows (highest in 10 years). Supply crunch on Shanghai exchanges at multi-year lows, with green tech demand projected to drive deficits. Silver's 2025 YTD gains now at ~83%, outpacing gold's rally.
Headwinds: Overstretched speculative positioning could spark profit-taking; hawkish Fed signals next week might cap upside if yields rebound.
Technical Breakdown
Pulling from daily and 4H charts, the bias is firmly bullish despite minor intraday dips:
Trend & Moving Averages (Strong Buy):
Daily: Price well above rising 200-day EMA (~55.00) and 50-day EMA (~50.00), with all major MAs aligned bullish. 200-hour EMA at 56.30 provides dynamic support.
4H: Golden cross intact on EMAs; buyers defending the ascending channel.
Implication: Uptrend channel from October lows holding; retest of $59+ imminent on volume pickup.
Momentum Indicators (Neutral with Bullish Tilt):
RSI (14): 50.82 (Neutral)—cooled from overbought but no divergence yet, leaving room for extension.
MACD (12,26): Recently slipped negative below zero line (bearish histogram), signaling short-term downside momentum, but line still above signal overall.
Stochastics (9,6): ~65 (Buy territory); not overbought.
CCI (14): Neutral (~0); Williams %R: -45 (Mild buy).
ADX (14): 28 (Moderate trend strength, bullish direction).
Implication: Momentum pausing after the ATH push, but neutral RSI avoids sell signals—watch for bullish crossover.
Volume & Volatility:
ATR (14): ~0.85 (Elevated vs. recent avg., indicating volatility spike post-breakout).
Bull/Bear Power: Bulls dominant (+0.45), with options flow heavy on calls.
Pivot Points & Key Levels (Classic):LevelPriceTypeR359.50ResistanceR259.20ResistanceR159.00ResistancePivot58.15NeutralS157.50SupportS256.50SupportS356.20Support
Support Cluster: 56.20–56.50 (200h EMA + key zone; break below eyes 55.25 weekly support).
Resistance: 59.00–59.35 (recent ATH; clear for $60+ push).
Fibonacci: 61.8% extension from Oct lows targets 60.50.
Weekly Outlook
Broader uptrend: Strong Buy on MAs; Triangle pattern resolving higher, with potential test of 55.25 support before rally to 60.65–68.05. YTD doubling makes $65 realistic if Fed cuts materialize.
Risk: Drop below 56.20 could accelerate to 54–55 (prior resistance-turned-support), but low probability amid deficit forecasts.
Bias: Buy the dip—industrial tailwinds and ETF momentum point to $60 by quarter-end.
Trade Takeaway: Long above 58.15 pivot (stop below 56.50). Target R1 at 59.00 for 1:2 risk/reward. Squad, silver's stealing gold's thunder—$60 next, or Fed-induced pause? What's your play? #XAG #SilverAnalysis #SignalSquad
XAUGSDsilver spot in 5 Wave 61.00 dollar
61.00 above sustain strongly then continuous up move 66.00 71.00 otherwise down move 52.00 to 49.00 dollar possible

silver update after bulbs rally mcx or cme spotthere are some probability on chart which will briefly discuss.
Silver spot--- yesterday crossed or sweep all liquidity abv 59.40$ or made high 61$ almost ------ still as per gold silver ratio silver looking hot only abv 60-59.80$ up side tgt 62$ intact .or if sustain abv 63.55$ or close abv + weekly close than will see 67-72$ soon. Or if mkt take 63$ hurdle or revert than again down side expect 58$ near in mcx 193000 laxman rekha for silver if sustain abv or close than expect tgt 199-205000+++ no if and but---or if mkt fail to close or hold abv 193000 than down side door open through profit booking till 187-185000++++
todays trade plan in silver .sell trade got active on rejection of golden reversal , targeting liquidity sweep . from liquidity sweep will take buy trade once price faces rejection . for target of liquidity sweep top .
this is the trade plan for today .

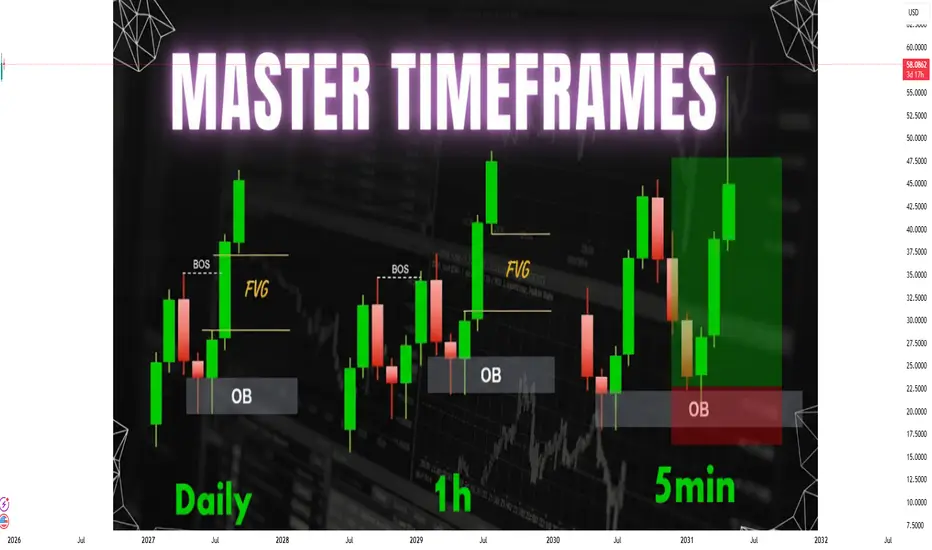
Multi-Timeframe Analysis (MTFA)1. Why Multi-Timeframe Analysis Matters
Markets are fractal in nature—meaning price moves in repeating patterns across all timeframes. A trend visible on the 1-hour chart may simply be a pullback on the daily chart. A breakout on the 5-minute chart may be irrelevant when the weekly trend is sideways.
Relying only on one timeframe creates three common issues:
False breakouts: Lower timeframes give misleading breakouts during higher-timeframe consolidations.
Confusion about trend: The trend on a small timeframe often conflicts with the major trend.
Entries without context: Traders enter without understanding key support/resistance or institutional zones.
MTFA solves all these problems by combining macro and micro views to form decisions rooted in context.
2. The Top-Down Approach (The Standard MTFA Process)
Most traders follow a 3-step method:
Step 1: Identify the Main Trend (Higher Timeframe – HTF)
Use Weekly, Daily, or 4H depending on your style.
Here you look for:
Overall trend direction (uptrend / downtrend / range)
Major support and resistance
Market structure (HH, HL, LH, LL)
Long-term supply and demand zones
HTF gives you the “big picture”—the dominant force of the market.
Step 2: Refine the Setup Zone (Middle Timeframe – MTF)
Use Daily-4H, 4H-1H, or 1H-15M depending on the trade.
This timeframe helps confirm:
Trend alignment
Pullbacks
Break of structure
Chart patterns (flags, triangles, channels)
Key levels where entries may occur
MTF filters out low-probability setups and identifies accurate zones.
Step 3: Execute With Precision (Lower Timeframe – LTF)
Use 1H, 15M, 5M, or 1M for exact entries.
This timeframe helps you:
Time entries
Catch liquidity grabs
Place tight stop-losses
Monitor candle patterns (pin bars, engulfing, doji)
Confirm momentum using volume/RSI/stochastic
This is where the actual trade triggers happen.
3. Choosing the Right Timeframes (Based on Trading Style)
Different trading styles require different combinations.
1. Scalpers
HTF: 1H
MTF: 15M
LTF: 1M–5M
Goal: Quick moves, tight SL, small targets.
2. Intraday Traders
HTF: Daily
MTF: 1H
LTF: 5M–15M
Goal: Catch day moves with strong accuracy.
3. Swing Traders
HTF: Weekly
MTF: Daily
LTF: 4H
Goal: Hold trades for days to weeks.
4. Position Traders
HTF: Monthly
MTF: Weekly
LTF: Daily
Goal: Capture major multi-month trends.
The key rule:
The larger timeframe decides trend direction; the smaller timeframe decides entry timing.
4. How MTFA Improves Trading Accuracy
1. Identifying True Trend Direction
A rise on the 15-minute chart may look bullish, but on the daily chart it may be a simple retracement in a strong downtrend. MTFA prevents trading against the dominant direction.
2. Avoiding Market Noise
Lower timeframes contain lots of fake moves (whipsaws). MTFA filters them out by relying on higher-timeframe structure.
3. Improved Entry and Exit
You can wait for precise structure breaks or candle confirmations on smaller timeframes while holding the higher-timeframe bias.
4. Better Risk Management
Since entries become more accurate, stop-loss distance reduces while keeping the same reward potential, thus improving risk-to-reward ratio (RRR).
5. Practical MTFA Example (Bullish Scenario)
Let’s say you are analyzing a stock or index.
Weekly Chart
Showing a clear uptrend (higher highs and higher lows).
Price currently retracing toward a major support zone.
Bias: Long (buy).
Daily Chart
Shows a bullish reversal pattern—like a double bottom or bullish engulfing candle.
Market structure shifts from lower lows to higher lows.
Bias strengthened: Prepare for long entries.
1-Hour Chart
Shows break of a short-term downward trendline.
A pullback retests a demand zone.
Entry triggers form: pin bar, engulfing, volume spike.
Execution: Enter long with confidence.
Here:
HTF gave direction.
MTF confirmed reversal.
LTF gave precision timing.
6. Understanding Conflicts Between Timeframes
Sometimes timeframes disagree:
Daily is bullish, but 1H is bearish.
4H shows consolidation, but 15M shows breakouts.
This is normal.
Rule:
The higher timeframe always overrides the lower timeframe.
If the HTF is bullish and LTF is bearish, the bearish move is likely a retracement—not a reversal.
Only when HTF breaks its structure should you consider changing bias.
7. Tools and Indicators Used in MTFA
MTFA does not depend on indicators, but indicators can support analysis.
Useful Tools
Price Action & Candlestick Patterns
Market Structure (HH, HL, LH, LL)
Support & Resistance Levels
Trendlines & Channels
Supply and Demand Zones
Helpful Indicators
Moving Averages (20/50/200) – for trend confirmation
RSI or Stochastic – for momentum and overbought/oversold
Volume – confirms strength of breakouts
MACD – for trend shifts
Key rule:
Indicators can support, but higher timeframe structure must lead the analysis.
8. Common MTFA Mistakes to Avoid
1. Overusing Too Many Timeframes
Using more than 3–4 creates confusion.
Stick to a simple framework: HTF + MTF + LTF.
2. Taking Trades Against the Higher-Timeframe Trend
This results in low-probability trades.
3. Forcing Breakouts on Small Timeframes
A breakout on 5M may be meaningless if the daily timeframe is in a strong range.
4. Not Waiting for Alignment
All timeframes must agree before entering.
5. Ignoring Key Levels
Higher-timeframe S/R zones are where major institutions trade.
9. Benefits of Mastering MTFA
Increases trade accuracy
Reduces emotional trades
Provides clear market structure
Helps catch major moves
Improves reward-to-risk
Builds professional-level discipline
Works in any market (stocks, forex, crypto, commodities, indices)
10. Summary of Multi-Timeframe Analysis
MTFA combines higher, middle, and lower timeframe views.
Higher timeframe shows trend and major levels.
Lower timeframe shows entry and precision.
MTFA avoids noise, false breakouts, and misleading signals.
It enhances risk management and trade quality.
All successful traders use MTFA, from scalpers to swing traders.
silver spot crucial update as per strong momentumsilver spot eyes on 56.60$ in mcx 177000 if stya blw thna looks 55-54$ expect in mcx silver soon 175--173000+++ expect if mkt hold support than again up side touch
over all eyes on 56.60$ let see wht next now


XAGUSD – Clean Rejection From Discount Zone With Upside Silver reacted perfectly from a refined discount zone after a controlled pullback. The immediate rejection and push back above micro structure levels indicate bullish absorption and renewed momentum.
This reaction aligns with the broader HTF bullish narrative, suggesting price may continue expanding toward upside inefficiencies if structure holds.
Bullish Path:
• Tap into refined discount zone
• Strong rejection wick + recovery
• LTF structure shift confirming accumulation
• Expansion toward next HTF imbalance / liquidity pocket above

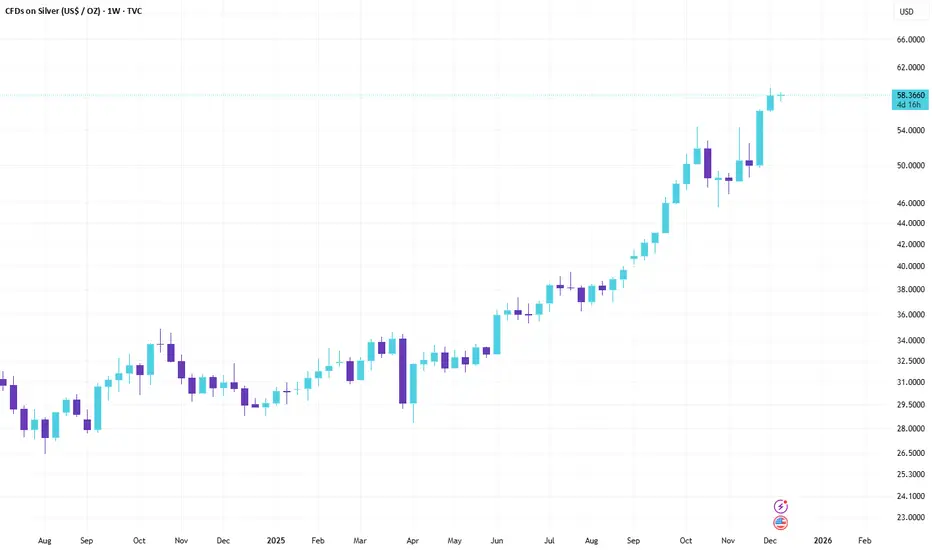
Silver Weekly EW counting As per EW counting, Silver looks like completed W3/3 .. Today gap up once get closed will confirm exhaustion Gap...

Silver Forecast - Elliott Wave AnalysisThis Rally continue possible up to Around $80 without break trendline support or Invalidation level so go long ...

Silver continuesly buying recommended now 57.50 and 59.50 targetParameters Data
Reason 🟩 Dovish Fed Bets & Industrial Demand: US Fed rate cuts ki strong expectation aur US Dollar Index (DXY) mein weakness se Silver ko support mil raha hai. Additionally, industrial demand outlook bhi positive hai, driving price towards new highs.
Asset Name Silver COMEX (XAG/USD): $54.17
Price Movement Buy side: , , . If break then downside possible towards , , .
Current Trade 🟩 BUY Active / T1: $54.70, T2: $55.50, T3: $56.50 / SL: $52.90
Risk Reward 🟩 1:1.8 (Buy entry near $54.17 with SL $52.90 and T1 $55.50 offers a favorable ratio in a momentum market.) / Threshold: Breakout above - $54.45 & Breakdown below - $53.00
Confidence 🟩 23/30 (Dominant signals Bullish/Positive hain, confirming very high conviction for the BUY trade.)
Probability 🟩 80%
Max Pain 🟨 $53.00 - $53.50 (Recent expiry focus is slightly below the current price, suggesting a strong upside breakout is occurring.)
DEMA Levels 🟩 20/50/100/200/250 DEMA: Price sabhi major DEMA levels se strongly upar trade kar raha hai, confirming a sustained, long-term bullish trend.
Supports 🟩 S1: $53.35, S2: $52.71, S3: $52.00 (S1 is the immediate strong support level.)
Resistances 🟥 R1: $54.45 (Intraday High/52-week High), R2: $54.75, R3: $55.50 (R1 break hone par all-time high ki taraf move karega).
ADX/RSI/DMI 🟩 RSI (14): 67.52 (Strong Buy signal; overbought near, but momentum intact.) ADX (14): 34.03 (Very strong trend strength.)
Market Depth 🟩 Bullish Skew (Higher volume and bids in the order book for up move.)
Volatility 🟨 ATR (14): 0.33 (Volatility moderate-high hai, which is typical during a strong trend.)
Source Ledger 🟩 Verified (COMEX, CME, Investing.com, Trading Economics, APMEX via Data Accuracy Protocol.)
OI 🟩 Increase in OI with price rise (Long Build-up), confirming bullish signal and institutional participation.
PCR 🟨 1.05 (Slightly above 1.0, Neutral to Mildly Bullish. Options data suggests more Call activity than Put OI at current strikes.)
VWAP 🟩 Price is above VWAP (VWAP approx $53.80), confirming intraday buying momentum.
Turnover 🟩 High (Significant volume and turnover supporting the rally.)
Harmonic Pattern 🟨 None Dominant (Pure fundamental and trend-driven rally.)
IV/RV 🟩 IV is Moderate, RV is High (Realized Volatility is high due to strong price action.)
Options Skew 🟩 Positive Skew (OTM Call options ki implied volatility OTM Puts se zyada hai, indicating upside expectation.)
Vanna/Charm 🟩 Positive (Market makers may need to buy futures to hedge rising Call option delta.)
Block Trades 🟨 No Major Signal (No significant block trades observed today.)
COT Positioning 🟩 Managed Money Net Longs Increased (Speculative positions strongly bullish hain.)
Cross‑Asset Correlation 🟩 Strong Negative Correlation with DXY (US Dollar weakness Silver ko push kar raha hai). Strong Positive Correlation with Gold.
ETF Rotation 🟩 Inflows (Silver ETFs, like SLV/AGQ, mein substantial capital inflows dekhe ja rahe hain.)
Sentiment Index 🟩 Greed/Extreme Optimism (Global sentiment Precious Metals ke liye extremely positive hai.)
OFI 🟩 Positive (Order Flow Imbalance suggests heavy buying pressure.)
Delta 🟩 Positive Skewed (Higher Call Delta buildup, supporting the up move.)
VWAP Bands 🟩 Price at Upper Band (Trading at the upper boundary, reinforcing the immediate Buy signal.)
Rotation Metrics 🟩 Strong Inflow (Capital is moving into the precious metals commodity space.)

silver spot nxt boomer update blwsilver spot made almost triple top near 52.40$ which is facing big hurdle for silver if mkt sustain above 52.50$ or close above than next up side tgt 56--58$ support 51.50$ if blw than some correction till 50--49$--- yes eyes on 52.50$ if unable to hold abv than mkt looks some correction till 53.50--53.20$

silver crucial updatesilver update--- silver sustain abv 159300 looks up side 159900--160300-160700++++ in spot stya abv 52.60$ look 53$--53.50$++ near yes if sustain than will see more boom
trading ideas--- buy on dips good way with strict support sl likw 52.29 BMV:IN mcx 158300@ sl use must

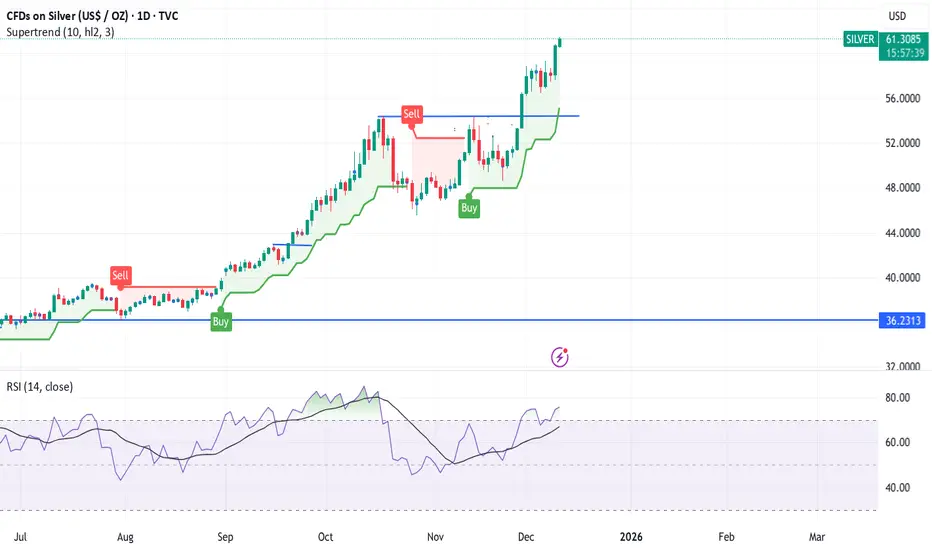
XAG/USD bullish setupSilver is an bullish scenario for an Target of 63$, Correction is completed now, Soon an impulse is expected.

Short I anticipate that December 5th is approaching, and the value of silver may experience a retraction following its peak for the current month

Silver today booked 140 pips continuesly buying recommended 48.2Parameters Data
Asset Name Silver COMEX (XAG/USD)
Reason 🟩 US rate cut expectations, weak dollar, aur high industrial demand ke chalte strong breakout.
R:R 🟩 R:R ratio is favorable for T2/T3 targets. / Threshold: Breakout above - & Breakdown below
Current Trade 🟩 BUY Active ⬆️ Target T1 - 53.50 , T2 - 54.49 , T3 - 55.50 , Stop loss - 51.49
Probability 🟩 85% (Strong fundamental & technical alignment.)
Confidence 🟩 26/30 (Massive YTD return aur aaj ki strong closing confirms conviction.)
Price Movement Buy side: 53.50, 54.49, 55.50. If break 51.49 then downside possible towards 51.00, 50.50, 49.50.
FNO Data (OI/PCR) 🟩 OI mein substantial long positions added, indicating continued institutional interest.
Liquidity Zones 🟩 High Liquidity / Price discovery mode near all-time high zone.
Max Pain 🟨 N/A (Futures Contract)
Gamma Exposure 🟩 Gamma positive, jo price ko current level se upar ki taraf dhakel raha hai.
Supports 🟩 S1: 51.49 (Previous Close/Major Pivot) | S2: 50.50 (50-Day EMA) | S3: 49.50 (Psychological/Range Lows)
Resistances 🟥 R1: 53.50 (Immediate Technical Supply) | R2: 54.49 (52-Week High/ATH zone) | R3: 55.50
DEMA Levels 🟩 Price 20/50/100/200 DEMA se kaafi upar hai (Structural uptrend intact).
ADX/RSI/DMI 🟩 RSI (14) \sim 80+ (Overbought, par momentum extremely strong hai).
Cross‑Asset Correlation 🟩 Gold (GC/USD) ke saath strong positive correlation.
COT Positioning 🟩 Commercials ne short-covering ki hai, aur Managed Money net longs badha rahe hain.
Source Ledger 🟩 OANDA, TradingView (Image Data), CME Group, Kitco, Investing.com (Verified & Triangulated).

a deeper correction is on the way Siver $ 52.20
Elliott- the ABC correction of wave ii of C is an expanded flat. To me it is done. Wave iii of C should being now. The wave iii will come down minimum to $43.
Conclusion - Have patience, the precious metal will give you an opportunity to buy at much lower levels.

XAGUSD_Short Elliot Wave Analysis I'm anticipating that XAGUSD (Silver) could decline toward the $48.50 level, with a suggested stop loss around $54.50. Please make sure to conduct your own research before entering any trade.

Silver comex AI Tool showing bounce back, holding buy 49.25 Parameters Data
Asset Name : Price 🟥 Silver Comex (Dec) : 49.975
Price Movement 🟥 Downmove will continue to 49.35, 48.06 if break 48.06 then breakdown Until 50.55 not break if break then 50.85, 51.57 possible.
Reason 🟥 Strong US Dollar & Profit Booking: Recent rally ke baad short-term profit booking aur Fed rate cut expectations mein kami se Dollar Index strong hua, jiske kaaran selling pressure aaya.
Confidence 🟨 Neutral 14/30 Bullish , Avoid , Bearish (46.67% score 40% se 50% ki range mein hai, isliye Yellow/Neutral.)
Probability 🟨 50% Sideways/Correction: Strong support par hai, par selling pressure aur Dollar strength ke chalte major upside filhaal limited hai.
R:R 🟨 Neutral: R:R ratio current levels par 1:1.5 ke aas-paas hai.
FNO Data 🟥 Short Term Liquidation: Price down aur OI High (around 54.39K) hai, jo Short Build-up ya Long Unwinding ka sanket deta hai.
Liquidity Zones 🟩 Support Zone: $49.00 - $48.06 (Day's Low, Technical Support) 🟥 Resistance Zone: $50.35 - $50.55 (Previous Close, Day's High)
Max

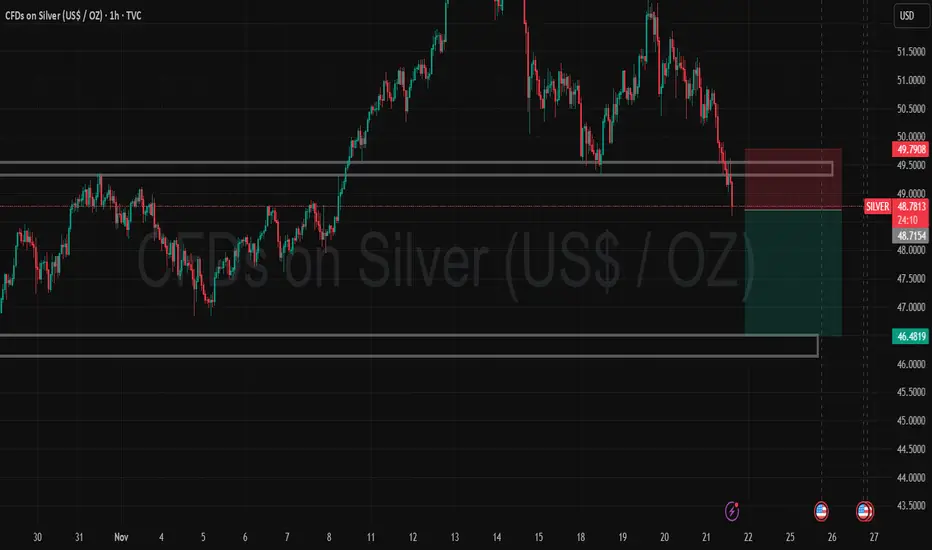
Silver Look Good for short with 1:2 target Trend: Bearish. The market has shifted from an uptrend to a downtrend.
Pattern: Break and Retest. Price broke below the 49.50 support level, retested it as resistance, and is now rejecting it.
The Trade: A Short (Sell) setup is active.
Target (TP): 46.48 (Lower support zone).
Stop Loss (SL): 49.79 (Just above the current resistance).
Outlook: Sellers are in control as long as the price stays below 49.80