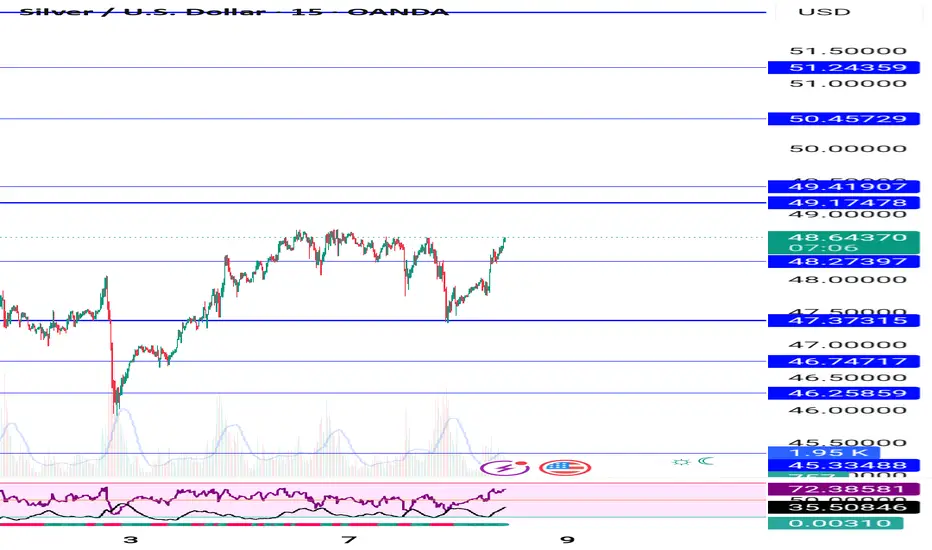
#Silver | Falling Wedge + Inverse H&S = Bullish Cocktail#XAGUSD | 4H Chart
Head & Shoulders completed its breakdown target ✅
Price found support at the demand zone, formed a falling wedge breakout, and built an Inverse H&S.
Now consolidating right below the neckline, watching Immediate Resistance @48.464 👀
Above this, potential retest of key resistance zone 49.459 – 50.475/50.897 (previous H&S breakdown area).
Bias: Bullish above 48.464; confirmation on 4H close 🔥
#Silver #XAGUSD #HeadnShoulders #FallingWedge #InverseHeadnShoulders #PriceAction
📌 Disclaimer: This analysis is shared for educational purposes only. It is not a buy/sell recommendation. Please do your own research before making any trading decisions.
Trade ideas

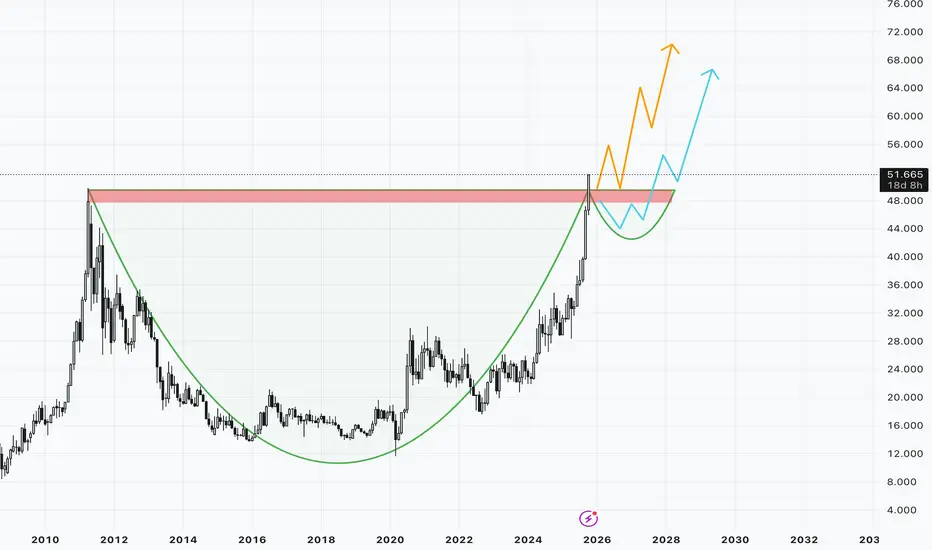
Silver breakout above ATH. What to expect next?Chart Analysis:
Silver gave a breakout above its all time high and major psychological level of 50$. All the technicals are very strong in the short run.
Looking at the monthly chart it looks like C recovery and breakout above major resistance without the H formation making the C&H pattern incomplete.
13 trading days still left for the monthly close and for the breakout to become valid if closes above 50$.
What next? :
Curently looks like a clean breakout on charts. Wait for the monthly close above 50$ which will then make the breakout valid. If the breakout is valid we will wait for a retest near the zone for fresh longs. If it doesn't close the the C&H pattern can come into play. Expecting some cooldown in the prices in the coming weeks but closing is most imp. Wait and watch is current scenario.
Key Levels :
Major Support : 50$/46$ Clbs
Minor Support zones : 48.5-48.6$/47.5-47.6$
Long Run View :
Buy on dips is the best strategy to play out in Silver making entries on crucial levels. Expecting Silver to outperform Gold in the long run.
Disclaimer :
I am not SEBI registered. This analysis is for educational purposes only and not investment advice. Please do your own research before trading or investing.
Silver as said on Friday until 50$ not break sell on rise only As said on Friday sell on rise until 50$ break , still sell on rise avoid buying at current price 45.50 to 44$ possible
How My Harmonic pattern projection Indicator work is explained below :
Recent High or Low :
D-0% is our recent low or high
Profit booking zone ( Early / Risky entry) : D 13.2% -D 16.1 % is
range if break them profit booking start on uptrend or downtrend but only profit booking, trend not changed
SL reversal zone (Safe entry ) : SL 23.1% and SL 25.5% is reversal zone if break then trend reverse and we can take reverse trade
Target : T1, T2, T3, T4 and .
Are our Target zone
Any Upside or downside level will activate only if break 1st level then 2nd will be active if break 2nd then 3rd will be active.
Total we have 7 important level which are support and resistance area
Until , 16% not break uptrend will continue if break then profit booking will start.
If break 25% then fresh downtrend will start then T1, T2,T3 will activate
1,3,5,10,15,20 minutes are short term levels.
30 minutes 60 minutes , 2 hours,3 hours, ... 1 day and 1 week chart positional and long term levels

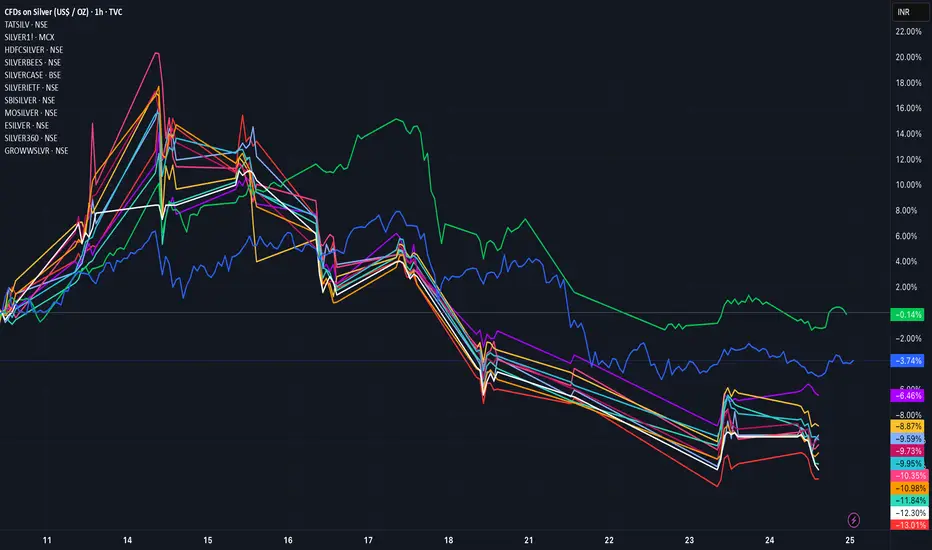
A General percentage scale between multiple Silver ETFsA General percentage scale between multiple Silver ETFs
Silver comex sell on rise until 50$ not break 45.50 to 44$ come How My Harmonic pattern projection Indicator work is explained below :
Recent High or Low :
D-0% is our recent low or high
Profit booking zone ( Early / Risky entry) : D 13.2% -D 16.1 % is
range if break them profit booking start on uptrend or downtrend but only profit booking, trend not changed
SL reversal zone (Safe entry ) : SL 23.1% and SL 25.5% is reversal zone if break then trend reverse and we can take reverse trade
Target : T1, T2, T3, T4 and .
Are our Target zone
Any Upside or downside level will activate only if break 1st level then 2nd will be active if break 2nd then 3rd will be active.
Total we have 7 important level which are support and resistance area
Until , 16% not break uptrend will continue if break then profit booking will start.
If break 25% then fresh downtrend will start then T1, T2,T3 will activate
1,3,5,10,15,20 minutes are short term levels.
30 minutes 60 minutes , 2 hours,3 hours, ... 1 day and 1 week chart positional and long term levels

XAGUSD Analysis | Silver at Critical Support📉 XAGUSD Analysis | Silver at Critical Support
Silver is holding near the $47.30 – $48.00 support zone, with current price around $48.08.
📊 Trend
Medium-term bias remains bearish after the sharp drop from ~$54.50. A downward trendline continues to act as dynamic resistance.
🔻 Support Levels
Maintaining $47.30 – $48.00 is crucial. A breakdown below could trigger another strong leg lower.
🔺 Resistance Levels
Key barrier sits at $50.00 – $50.49, aligned with:
• Downtrend line resistance
• Previous support turned resistance
A sustained break above may signal early reversal momentum.
📌 Outlook
Price is consolidating near support. The structure stays bearish unless bulls reclaim $50.00 – $50.49 and close above the trendline.

XAGUSD (Silver/USD) 1-hour chart...XAGUSD (Silver/USD) 1-hour chart, here’s what I can observe and infer about potential target levels:
---
🔍 Chart Summary:
My using Ichimoku Cloud and trendlines.
Price is currently around $49.10.
The chart shows two target points drawn:
1. First Target Point: Around $51.90 – $52.00
2. Second Target Point: Around $54.30 – $54.50
---
🎯 Target Levels Based on the Chart:
1. First Target (Short-Term):
Around $51.9 – $52.0
This coincides with resistance from the previous range and Ichimoku cloud top.
Represents a possible initial take-profit zone if price breaks above current consolidation.
2. Second Target (Extended):
Around $54.3 – $54.5
Aligns with the projected measured move from my trendline channel.
This would be the larger bullish target if price sustains above the $52 breakout zone.
---
📈 Trading Idea (Hypothetical Example):
Buy Zone: Above $49.5 – $49.8 (confirmation breakout)
Target 1: $51.9 – $52.0
Target 2: $54.3 – $54.5
Stop Loss: Below $48.5 support (near Ichimoku base)

XAGUSD (Silver vs USD) on the 1-hour timeframeXAGUSD (Silver vs USD) on the 1-hour timeframe, here’s what can be inferred:
The price has clearly broken below the ascending trendline.
It also broke down through the Ichimoku cloud, confirming a bearish signal.
There’s a sharp rejection candle followed by continuation below previous structure support (around $52.00–$51.80).
My marked a “target point” on your chart — roughly near $47.50, which seems to be aligned with the next major support zone from earlier price action (likely a demand area or Fibonacci retracement level).
🧭 Technical Breakdown:
Current Price: ~$51.81
Immediate Resistance: $52.30–$52.45 (bottom of the cloud)
Support/Target:
Short-term: $50.80
Medium-term: $49.50
Major target (as on your chart): $47.50
🎯 Expected Target:
If bearish momentum continues and the price stays below the $52.00 resistance, your target of $47.50 looks reasonable as a swing target.


Silver – Monthly RSI Hits 80: Historical Correction Zone Ahead?This is a Monthly chart analysis of Silver (XAG/USD). Historically, every time the Monthly RSI has reached the 80 level, it has signaled a significant price correction. Let’s look at the data:
Past RSI-80 Peaks and Subsequent Corrections:
Mar 2004 – 34% correction
Apr 2006 – 37% correction
Mar 2008 – 55% correction
Apr 2011 – 47% correction
Aug 2020 – 41% correction
Now in Oct 2025, the Monthly RSI has again touched 80, and we’ve already seen a correction of ~11% from the recent all-time high of $54, which puts the current move in context with past cycles.
Current Market Outlook & Strategy
Silver has corrected ~11% from its recent high of $54, now trading around $48. Price rejection seen from April 2011 (~$49.7), a historically key resistance / reversal zone.
The Sep 2025 monthly candle low is ~26% off the ATH, marking a significant drawdown. Given this setup, I’m adopting a cautious stance:
+ Booking partial profits below the October low of $45.82 (as of 22nd Oct )
+ Trailing the rest of my position using the previous month’s low as a dynamic stop
Re-entry Plan
I will consider adding back exposure on either
A clean breakout above the all-time high ($54) with volume and confirmation
OR
A pullback toward the Monthly 20 SMA, historically a reliable support zone
Summary
While the long-term trend remains bullish, historical RSI extremes suggest tactical caution is warranted at these levels. Corrections in the 34-55% range have followed similar RSI peaks in the past - and we may not be done yet.
Stay flexible. Protect gains. Let the market confirm the next move.

Buy Silver for 54 DollarSilver Daily Chart:
Triangle Breakout with Momentum :
any Retest will give a opportunity to add for long Term Portfoilo.
Fibo Trend Setup suggesting 54 Dollar is coming in some months

XAG/USD Technical Analysis (as of October 19, 2025)Current Market Snapshot
The spot price of silver (XAG/USD) stands at 51.91430 USD per ounce, reflecting a sharp decline of -2.3663 (-4.36%) from the previous close of 54.24 in daily time frame. This pullback follows recent record highs near 54.48, driven by safe-haven demand amid geopolitical tensions and inflation concerns, but now facing profit-taking and a stronger USD.
Support and Resistance Levels
Immediate support is at 51.44, with a critical level at 50.00 if breached.
Resistance looms at 54 to 57.02.
Chart for your reference
~~ Disclaimer ~~
Trading or investing in assets like crypto, equity, or commodities carries high risk and may not suit all investors.
Analysis on this channel uses recent technical data and market sentiment from web sources for informational and educational purposes only, not financial advice. Trading involves high risks, and past performance does not guarantee future results. Always conduct your own research or consult a SEBI-registered advisor before investing or trading.
This channel, Render With Me, is not responsible for any financial loss arising directly or indirectly from using or relying on this information.

Silver as said on weekend 54$ for this week if comes then book Silver this week target 54 $ near now if comes then book profit, silver still buy in dip
How My Harmonic pattern projection Indicator work is explained below :
Recent High or Low :
D-0% is our recent low or high
Profit booking zone ( Early / Risky entry) : D 13.2% -D 16.1 % is
range if break them profit booking start on uptrend or downtrend but only profit booking, trend not changed
SL reversal zone (Safe entry ) : SL 23.1% and SL 25.5% is reversal zone if break then trend reverse and we can take reverse trade
Target : T1, T2, T3, T4 and .
Are our Target zone
Any Upside or downside level will activate only if break 1st level then 2nd will be active if break 2nd then 3rd will be active.
Total we have 7 important level which are support and resistance area
Until , 16% not break uptrend will continue if break then profit booking will start.
If break 25% then fresh downtrend will start then T1, T2,T3 will activate
1,3,5,10,15,20 minutes are short term levels.
30 minutes 60 minutes , 2 hours,3 hours, ... 1 day and 1 week chart positional and long term levels

Silver upmove will continue buy on dip 54$ target Silver buy on dip uptrend will continue 54 $ next upside target,
Silver updated levels given on chart
How My Harmonic pattern projection Indicator work is explained below :
Recent High or Low :
D-0% is our recent low or high
Profit booking zone ( Early / Risky entry) : D 13.2% -D 16.1 % is
range if break them profit booking start on uptrend or downtrend but only profit booking, trend not changed
SL reversal zone (Safe entry ) : SL 23.1% and SL 25.5% is reversal zone if break then trend reverse and we can take reverse trade
Target : T1, T2, T3, T4 and .
Are our Target zone
Any Upside or downside level will activate only if break 1st level then 2nd will be active if break 2nd then 3rd will be active.
Total we have 7 important level which are support and resistance area
Until , 16% not break uptrend will continue if break then profit booking will start.
If break 25% then fresh downtrend will start then T1, T2,T3 will activate
1,3,5,10,15,20 minutes are short term levels.
30 minutes 60 minutes , 2 hours,3 hours, ... 1 day and 1 week chart positional and long term levels
Silver 51.20 target hit then profit booking 54 $ come next week Silver as said earlier 51.20 $ target hit .
Silver buy on dip 54$ we will see on next week
How My Harmonic pattern projection Indicator work is explained below :
Recent High or Low :
D-0% is our recent low or high
Profit booking zone ( Early / Risky entry) : D 13.2% -D 16.1 % is
range if break them profit booking start on uptrend or downtrend but only profit booking, trend not changed
SL reversal zone (Safe entry ) : SL 23.1% and SL 25.5% is reversal zone if break then trend reverse and we can take reverse trade
Target : T1, T2, T3, T4 and .
Are our Target zone
Any Upside or downside level will activate only if break 1st level then 2nd will be active if break 2nd then 3rd will be active.
Total we have 7 important level which are support and resistance area
Until , 16% not break uptrend will continue if break then profit booking will start.
If break 25% then fresh downtrend will start then T1, T2,T3 will activate
1,3,5,10,15,20 minutes are short term levels.
30 minutes 60 minutes , 2 hours,3 hours, ... 1 day and 1 week chart positional and long term levels

Silver holding buy from 48.80, 50.50 then 51.20 target Silver holding buy trade from 48.80 upside target 50.40 and 51.20 , levels given on chart
How My Harmonic pattern projection Indicator work is explained below :
Recent High or Low :
D-0% is our recent low or high
Profit booking zone ( Early / Risky entry) : D 13.2% -D 16.1 % is
range if break them profit booking start on uptrend or downtrend but only profit booking, trend not changed
SL reversal zone (Safe entry ) : SL 23.1% and SL 25.5% is reversal zone if break then trend reverse and we can take reverse trade
Target : T1, T2, T3, T4 and .
Are our Target zone
Any Upside or downside level will activate only if break 1st level then 2nd will be active if break 2nd then 3rd will be active.
Total we have 7 important level which are support and resistance area
Until , 16% not break uptrend will continue if break then profit booking will start.
If break 25% then fresh downtrend will start then T1, T2,T3 will activate
1,3,5,10,15,20 minutes are short term levels.
30 minutes 60 minutes , 2 hours,3 hours, ... 1 day and 1 week chart positional and long term levels

Demat Account Secrets in Trading —Every Traders Should KnowIntroduction
A Demat account is the digital locker for your shares and securities — the backbone of equity investing and trading in modern markets. But beyond opening an account and watching prices, there are plenty of practical, operational, and strategic “secrets” that experienced traders and long-term investors use to reduce costs, manage risks, and extract real value. This guide unpacks those lesser-known but high-impact insights: from choosing the right Depository Participant (DP) and optimizing charges, to advanced features like pledging, e-voting, corporate actions handling, fraud prevention, and tax implications. Whether you’re a frequent intraday trader, a swing trader, or a buy-and-hold investor, these tips will help you use your Demat account more intelligently.
1. Demat 101 — the fundamentals (so you can stop guessing)
A Demat (dematerialized) account holds securities in electronic format. In India, two depositories — NSDL and CDSL — maintain the records; brokers or banks act as Depository Participants (DPs) who provide the interface. When you buy shares, they land in your Demat account; when you sell, they are debited.
Key components:
DP (Depository Participant): Your broker/bank managing the Demat.
Client ID / Beneficiary Owner (BO) ID: Unique identifier for holdings.
ISIN: International Security Identification Number for each instrument.
Statement of Holdings (MSOH): Periodic summary of your holdings.
Understanding the basics helps avoid simple but costly mistakes, like missing corporate action deadlines or confusing a brokerage trading account fee with a DP demat charge.
2. Choosing the right DP — the biggest hidden lever for costs & convenience
Everyone talks about brokerage, but DP fees and service quality quietly shape net returns.
What to compare:
Account opening fees and annual maintenance charges (AMC) — DPs vary widely.
Transaction fees / custodian charges — per scrip or flat per transaction?
Pledge/unpledge fees — important if you use margin funding.
Speed & UI of the DP portal/app — corporate actions, e-voting, and statements are handled through the DP interface.
Customer service responsiveness — when issues arise (frozen shares, IPO refunds), fast support saves money.
Integration with your broker — some brokers offer bundled Demat+trading at lower cost.
Value-adds — auto-pay for corporate actions, consolidated statements, or tax reports.
A little fee shopping can save hundreds per year for active traders. If you trade frequently, prioritize low transaction/DVP (delivery versus payment) costs. If you hold long-term, low AMC and reliable corporate action handling matter more.
3. Know every charge — the micro-fees that add up
Demat-related costs are often small, but they compound.
Common fees:
Account opening fee
Annual maintenance charge (AMC)
Transaction charges (debited shares, off-market transfer)
Rematerialization fee (if you want physical certificates)
Pledge/unpledge fee
Dematerialization fee (converting physical to electronic)
Re-registration fee (if transferring DP)
Pro tip: Ask for a clear fee schedule before opening. Some DPs waive AMC for the first year or if you maintain a minimum balance.
4. Pledging shares — a secret weapon (and its pitfalls)
Pledging lets you use your Demat holdings as collateral for loans or margin from your broker or financial institution without selling them. This is a powerful tool but needs careful handling.
When to pledge:
To avoid selling for short-term margin calls.
To take loans against shares for diversification, emergency liquidity, or tax planning.
Risks & secrets:
Margin haircut: Lenders apply haircuts; volatile scrips get lower borrowing value.
Forced unpledge/sell: If the borrower (you or broker) defaults, the lender can liquidate.
Pledge charges & delays: Unpledging can take time; if markets move quickly you might not recover positions in time.
Keep pledged shares low proportion of total holdings to preserve flexibility.
Best practice: Use pledging conservatively and document the exact terms — interest, margin maintenance, and liquidation triggers.
5. Corporate actions — don’t let freebies slip away
Corporate actions include dividends, bonus shares, rights issues, stock splits, and buybacks. These affect your holdings and tax position.
Secrets:
Auto-execution settings: Some DPs auto-apply rights/renunciation choices; others require manual action. Know your DP’s default.
Track ex-dates and record dates: Missing a record date can mean missing a dividend or allocation.
Tax implications: Dividends and buybacks have different taxation; plan around holding periods to optimize capital gains tax.
Fractional shares from corporate actions may be paid out in cash — watch your account for small value credits.
Tip: Set calendar reminders for big corporate events for your core holdings.
6. Intraday trading & Demat — what traders often misunderstand
Many intraday traders think Demat doesn’t matter because intraday uses the trading account. But Demat still influences some things:
Delivery cycles: If you convert an intraday position to delivery, shares will land in your Demat only after settlement — check T+1/T+2 rules for the exchange.
Transaction vs delivery charges: No Demat debit for intraday (since shares aren’t delivered), but frequent delivery trades create more DP debits and costs.
Avoid unnecessary delivery: If you don’t intend to hold beyond the day, use intraday product to avoid DP transaction costs.
Secret: Using product/overnight margin vs MIS/Intraday modes changes margin requirements and whether shares actually hit your Demat account.
7. Security & fraud prevention — protect the locker
Scams target accounts everywhere. Protecting your Demat is non-negotiable.
Practical measures:
No POA unless necessary: Power of Attorney allows brokers to debit shares; while convenient, it’s a risk if given indiscriminately.
Two-factor authentication for broker/DPS portals.
Regularly reconcile your MSOH with transactions — report discrepancies immediately.
Keep KYC up to date — mismatches slow down corporate actions and transfers.
Beware phishing & SMS frauds: Never share OTPs, passwords, or UCCs.
Freeze facility: Many DPs offer "freeze" on holdings to prevent off-market transfer — useful if you detect suspicious activity.
Secret: If you must grant POA for ease of trading, limit it and use a reputable broker with transparent audit logs and insurance cover.
8. Reconciliation and statements — the daily routine of pros
Make it a habit:
Check daily trade reports and weekly Demat statements.
Match buy/sell confirmations with Demat credits/debits.
Track corporate action updates and small credits (fractional payouts, interest).
Why this matters: Small reconciliation catches — like a miscredited dividend or a failed transfer — can save disputes and losses later.
9. Off-market transfers & gifts — tax and legal subtleties
Off-market transfer (transfer of shares between Demat accounts without exchange) is common for gifts, family transfers, or private transactions.
Secrets:
Stamp duty & documentation: Gifts may require stamped transfer forms and declarations.
Gift taxation: In many jurisdictions, gifts from non-relatives have tax consequences. Document relationship and value.
Lock-in periods for ESOPs: Employee stock plans often have restrictions — off-market transfers may be blocked until vesting or expiry.
Always get the paperwork right to avoid future audits or blocked transfers.
10. IPO allotment & ASBA — how Demat helps get allocations
When you apply for IPOs, you must provide your Demat beneficiary ID. ASBA (Application Supported by Blocked Amount) ties refunds to the bank account, but Demat ensures shares — if allotted — are credited cleanly. Tip: Keep your Demat details updated and ensure PAN/DP mapping is correct to avoid allotment or transfer failures.
11. Taxation & reporting — your Demat is a tax record
Demat statements are primary source documents for capital gains calculations. Hidden advantages:
Broker consolidated statements often include trade-wise P&L and tax reports — use them for accurate filings.
Record holding periods precisely to differentiate between short-term and long-term rates.
Track cost basis across corporate actions — splits, bonus shares, and mergers alter cost per share; your DP statement and ISIN mapping help reconstruct basis.
Secret: Use consolidated transaction history from DP + broker to build an auditable trail for taxes.
12. Advanced tricks traders use (legitimately)
Scrip selection for pledge-margins: Keep a small basket of high-liquidity, low-volatility blue-chips for emergency pledges — they attract better haircuts.
Arbitrage of corporate actions: Professional traders sometimes buy before bonus/record dates to capture specific corporate actions, but account for ex-dates and tax impacts.
Fractional sell tactic: For small fractional leftover holdings after corporate actions, monitor for cash credits or plan an off-market consolidation to reduce micro-lots.
Caveat: All strategies must respect exchange rules and insider trading laws.
13. Common mistakes & how to avoid them
Giving POA to unknown brokers. Fix: Use limited POA or avoid if not necessary.
Ignoring AMC & small fees. Fix: Annual review of DP and renegotiate or switch.
Not tracking corporate action timelines. Fix: Subscribe to alerts and maintain a calendar.
Assuming all charges are the broker’s responsibility. Fix: Read fee schedule and keep records.
Failure to reconcile statements. Fix: Weekly reconciliation habit.
14. Switching DPs — the painless way
If you’re unhappy, transfer holdings using the Off-Market Transfer or Consolidation process. You’ll submit a DIS (Delivery Instruction Slip) at your current DP or use electronic transfer forms. Watch for transfer fees and timing — sometimes it’s cheaper to transfer slowly to avoid peak fees.
Secret: Coordinate transfer during low market activity to avoid missing corporate action deadlines.
15. Final checklist — your Demat hygiene
Know your DP’s fee schedule inside out.
Keep KYC & bank details updated and linked.
Avoid giving unrestricted POA; prefer limited authorizations.
Reconcile statements weekly.
Use pledge sparingly and understand haircut rules.
Track corporate action dates and tax implications.
Enable strong authentication and freeze options if suspicious activity occurs.
Use consolidated broker/DP tax reports at filing time.
Conclusion
A Demat account is more than a passive repository — it’s an operational hub for your market activity. Traders who master its mechanics and hidden levers (fee optimization, pledge use, corporate action handling, security practices) gain efficiency, reduce unexpected costs, and protect themselves from fraud. Whether you’re day-trading, swing trading, or building a long-term portfolio, treat your Demat account with the same discipline you apply to strategy and risk management. Small operational advantages compound over months and years — and often separate consistent winners from unlucky participants.
Silver upmove will continue 49.80 to 49.90 next target hold buy Silver buying recommended now up 5000-6000 points next upside target 49.80 to 49.90
How My Harmonic pattern projection Indicator work is explained below :
Recent High or Low :
D-0% is our recent low or high
Profit booking zone ( Early / Risky entry) : D 13.2% -D 16.1 % is
range if break them profit booking start on uptrend or downtrend but only profit booking, trend not changed
SL reversal zone (Safe entry ) : SL 23.1% and SL 25.5% is reversal zone if break then trend reverse and we can take reverse trade
Target : T1, T2, T3, T4 and .
Are our Target zone
Any Upside or downside level will activate only if break 1st level then 2nd will be active if break 2nd then 3rd will be active.
Total we have 7 important level which are support and resistance area
Until , 16% not break uptrend will continue if break then profit booking will start.
If break 25% then fresh downtrend will start then T1, T2,T3 will activate
1,3,5,10,15,20 minutes are short term levels.
30 minutes 60 minutes , 2 hours,3 hours, ... 1 day and 1 week chart positional and long term levels
Red Alert for Buyers as XAGUSD Nears $49 – Correction AheadSilver price (XAGUSD) faces strong resistance near $49. Neal Bhai Reports warns a “Red Alert for Buyers.” Check latest silver analysis with buy/sell targets, stop loss, and key support levels for traders.
Silver prices have shown a sharp rally, reaching near the $49–$50 zone — a strong resistance area. According to the chart, buyers should stay cautious now as the metal looks overextended. A short-term correction may hit the market soon.
The technical setup suggests that profit booking could start around current levels, pushing silver towards $44 or even $42 in the coming sessions.

silver spot or mcx lvl update at higher lvlsilver spot looks beast mode due to higher high pastern with short correction and made huge gap with daily or 4th hrs chart.
technical lvl--support 47--46.80$ indicate as per chart only blw some down correction expect 46.20--46--45.90$ where hurdle 48.45--48.50$ if sustain abv than next touch 48.80--49--or last 49.80$++ may be touch over all looks boom mode only.
mcx silver--- till hold abv 146300 no worry for bulls soon 148--149++ ultimate 152k possible or if sustain abv 152 or close 2days than u will see 158--162 soon no if and but. yes be care full at higher lvl profit booking may be come but eyes on lvl .
usa shutdown boosting safe heaven demand
SILVER AT THE $50 "WIDOW MAKER ZONE": IS A CRASH IMMINENT?Silver has hit the wall. It's not just resistance—it's the exact price range $48.00–$50.00 that triggered the 70%+ market massacres of 1980 and 2011.
3 Reasons Why a Correction Is Locked In
The risk of a violent reversal is extreme. This zone is a perfect storm of selling pressure:
* The $50 Trap: It's a massive Technical Trap. Long-term sellers trapped from the 2011 peak are all waiting here to dump their bags and take profit.
* Psychological Trauma: Historical Precedent is terrifying. The memory of two prior crashes at this level creates panic-selling pressure that will compound any dip.
* Market Exhaustion: Retail Over-Exuberance is flashing red. Heavy positioning means the easy money is gone, and there's no fuel left to break the ceiling.
The Twist: Not a Total Bust (Yet)
While a crash is likely, a full 1980s-style wipeout is less certain. Why? Industrial Demand. Silver is fundamentally stronger now, backed by massive, non-negotiable demand from the Green Energy Transition (solar, EVs). This structural deficit offers a floor that past bubbles lacked.
The Bottom Line
The $48–$50 area is the "Widowmaker Zone." Expect carnage.
* The Line: If Silver fails to decisively close above $50.00, brace for a brutal correction—likely a fast drop back to the $35.00 range.
* Your Move: MAXIMUM CAUTION. Short-term profits must be protected. History doesn't just rhyme; at this price, it often repeats itself.
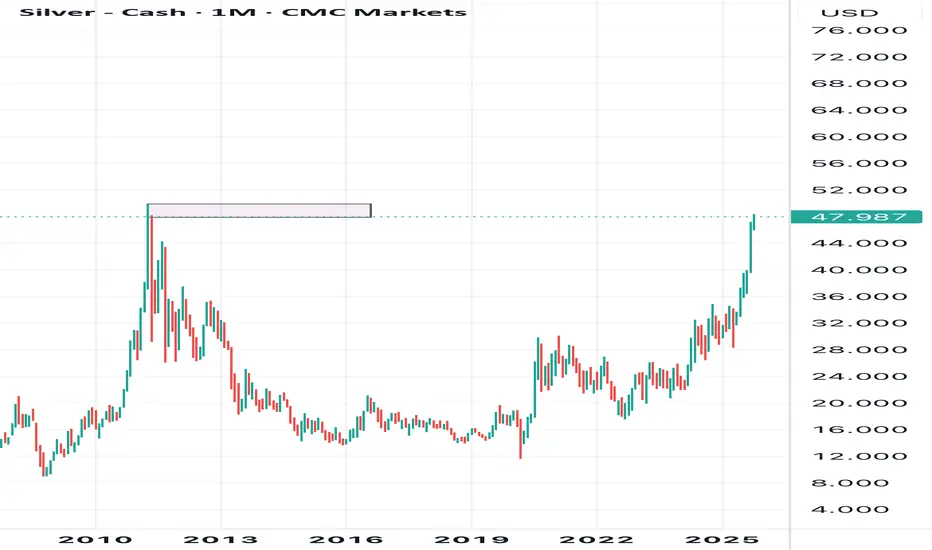
Silver at a crucial historical levelSilver reached the USD 48250+ level. It reached this level in 1980 and 2011. Both times it has experienced a sharp reversal.
According to the long-term Elliott wave, I believe it is the end of the 3rd impulsive wave.
Note: Not a buy/sell recommendation. For educational and paper trading purposes only.

Silver at a major resistanceSilver has reached a major resistance level. A breakout above this will see more rally. It will be very interesting to see what happens from here. Big Macro development if a breakout happens. The metal will continue to shine if it breaks out, otherwise it is a top and correction will follow.
