Silver holding buy from 37.85 , we can see new ATH alsoHow My Harmonic pattern projection Indicator work is explained below :
Recent High or Low :
D-0% is our recent low or high
Profit booking zone: D13% -D15% is
range if break them profit booking start on uptrend or downtrend but only profit booking, trend not changed
SL reversal zone : SL 23% and SL 25% is reversal zone if break then trend reverse and we can take reverse trade
Target : T1, T2, T3, T4 and .
Are our Target zone
Trade ideas

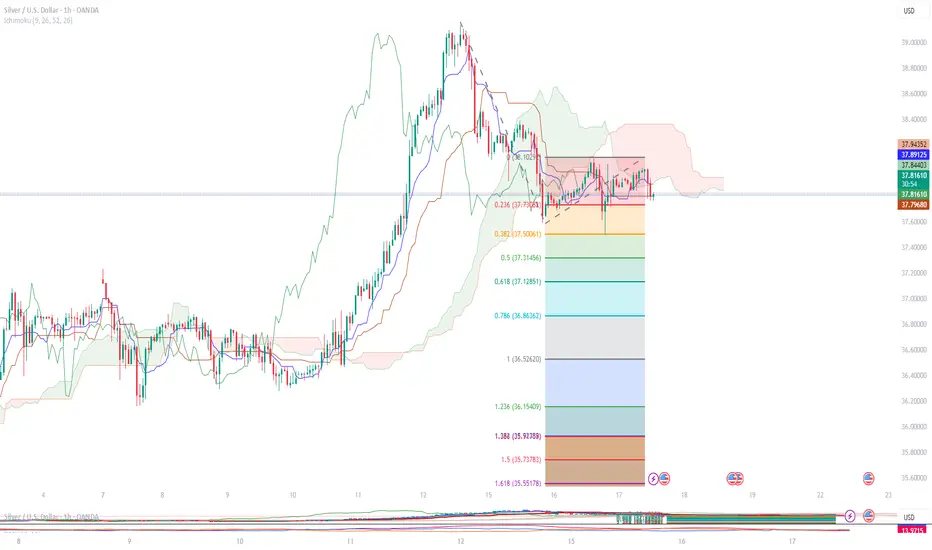
OH Silver Chart Indicate some bearish tone...Key Points:
Trend:
The price is below the Ichimoku cloud → showing a bearish trend.
The blue and red lines (Tenkan & Kijun) are also in a bearish position.
The price is near the 0.236 Fibonacci level (around $37.78) – acting as a weak support.
Resistance Zone:
Around $38.10 – $38.20
Support Levels (Fibonacci):
0.382 → $37.50
0.5 → $37.31
0.618 → $37.12
1.0 → $36.52
🔄 Swing Trading Idea (Sell Setup):
Direction: Sell (because the trend is weak)
Entry Zone: $37.79 – $37.83 (Current Price)
Target 1: $37.50
Target 2: $37.12
Stop Loss (SL): Above $38.10
Risk-Reward Ratio: Around 1:2
If price goes above $38.10, this sell idea will fail.
Silver yesterday sold at 38.95 today booked at 37.65How My Harmonic pattern projection Indicator work is explained below :
Recent High or Low :
D-0% is our recent low or high
Profit booking zone: D13% -D15% is
range if break them profit booking start on uptrend or downtrend but only profit booking, trend not changed
SL reversal zone : SL 23% and SL 25% is reversal zone if break then trend reverse and we can take reverse trade
Target : T1, T2, T3, T4 and .
Are our Target zone

A strong upside momentum Silver is the commodity to be in
Goutham Shah of Goldilocks
Many on CNBC TV18
YouTube legends like Mile Maloney

Silver updated levels, 39.60 to 40.30 next big resistance How My Harmonic pattern projection Indicator work is explained below :
Recent High or Low :
D-0% is our recent low or high
Profit booking zone: D13% -D15% is
range if break them profit booking start on uptrend or downtrend but only profit booking, trend not changed
SL reversal zone : SL 23% and SL 25% is reversal zone if break then trend reverse and we can take reverse trade
Target : T1, T2, T3, T4 and .
Are our Target zone

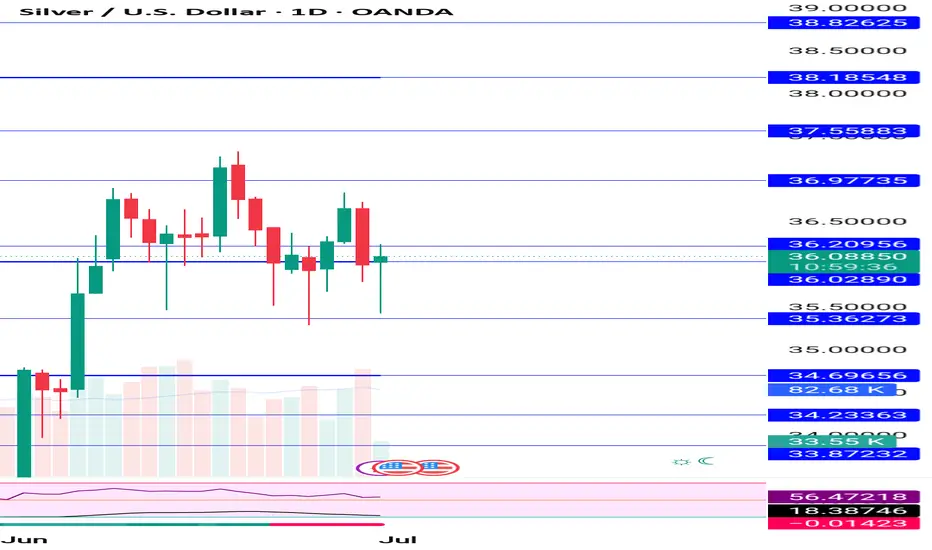
XAGUSD / SILVER / SI MONTHLY ANALYSIS 01-JUL-2025 @ 36.19LTP 36.19
Supports: 35.25/32.67/28.31
Resistance: 36.84/37.32
As long as 35$ holds support, and a break of the above resistances, we will 37.77 first.
Further, 4.34-41.1-42.3-43.1
Extensions: 44.21-46.34-47.77-51

Silver levels currently at big resistance area avoid buy at cmpHow My Harmonic pattern projection Indicator work is explained below :
Recent High or Low :
D-0% is our recent low or high
Profit booking zone: D13% -D15% is
range if break them profit booking start on uptrend or downtrend but only profit booking, trend not changed
SL reversal zone : SL 23% and SL 25% is reversal zone if break then trend reverse and we can take reverse trade
Target : T1, T2, T3, T4 and .
Are our Target zone
Silver sell on rise until 36.90 not break making bearish M paterHow My Harmonic pattern projection Indicator work is explained below :
Recent High or Low :
D-0% is our recent low or high
Profit booking zone: D13% -D15% is
range if break them profit booking start on uptrend or downtrend but only profit booking, trend not changed
SL reversal zone : SL 23% and SL 25% is reversal zone if break then trend reverse and we can take reverse trade
Target : T1, T2, T3, T4 and .
Are our Target zone

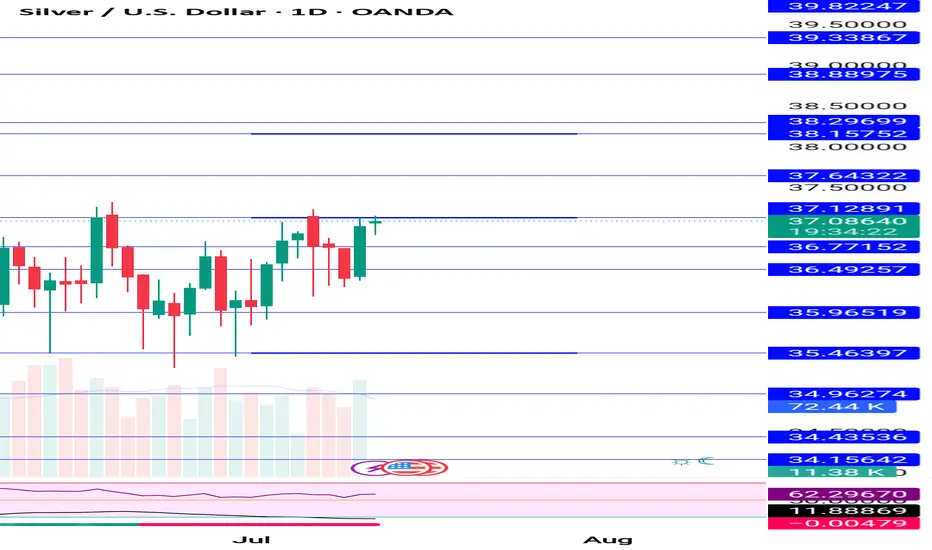
Silver (XAGUSD) – Bullish Continuation Structure Across All TimeMarket Overview
Silver continues to present a structurally aligned long setup across all major timeframes. From the monthly down to the H4, each chart reflects a bullish continuation with clean breakouts and valid pivot zones holding. The confluence of structure and Fibonacci alignment signals that the trend remains in an expansion phase, with higher timeframe levels validating upside targets.
Long-Term Outlook
On the monthly and weekly charts, Silver maintains its bullish trend structure. The recent breakout above the weekly 186.80% Fibonacci extension at $36.921 reinforces the upside continuation. The next higher timeframe resistance appears around the $38.50–$39.00 zone, corresponding with the 200.00% Fibonacci target on both weekly and monthly scales. The weekly pivot at $35.983 continues to serve as a structural anchor.
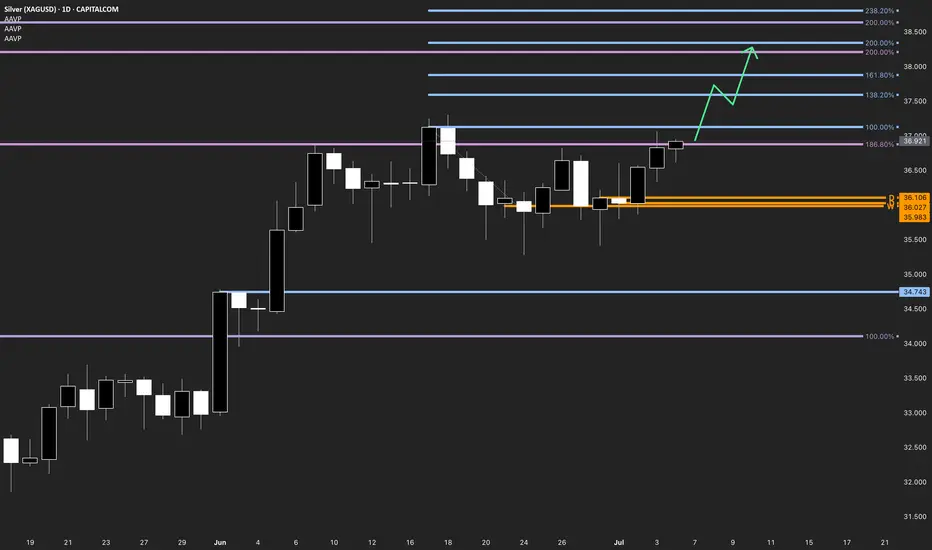
The Daily Chart
Daily structure confirms a clean bullish continuation following a period of consolidation. Price has cleared the prior resistance and is approaching the target Fibonacci cluster zone. The daily pivot level at $36.027 holds as a critical validation point for trend continuation. A bullish impulse from this zone has already begun forming, targeting higher Fibonacci extensions.
Short-Term Dynamics
On the H4 timeframe, a break above the H4 structure at $36.843–$36.921 activated a sequence of bullish target zones. The corrective leg down to the H4 pivot was respected, and the market has since resumed upward movement, supported by a clear countertrend break. The green arrow projects potential continuation into the target zone up to $38.20.
Trigger Conditions
Long Trigger: any H1/M15 countertrend break until the H4 pivot holds
Short Trigger: None identified—structure supports continuation long only at this stage
Target Zones
H4 Target Fibonacci: $36.00–$38.60 (138.2–161.8%)
Daily Target Fibonacci: $37.60–$37.80 (138.2–161.8%)
Monthly Fibonacci Extension: $38.20 (200.0%)
Validity
The setup remains valid as long as the daily pivot zone at $36.027–$36.106 holds. A breakdown below this area would challenge the continuation structure and call for reevaluation.
Summary
Silver remains in a confirmed bullish expansion phase, with a clean break of structure aligning across monthly, weekly, daily, and H4 charts. As long as the daily pivot zone remains intact, Fibonacci targets up to $39.00 remain structurally valid. This setup reflects a textbook continuation scenario under a multi-timeframe framework.
What’s your take on Silver’s current expansion structure? Do you see continuation into the upper Fib zone?
SilverSilver ( OANDA:XAGUSD ) – Bearish Head & Shoulders Forming on 4H Chart
Silver is currently trading at $35.95/oz and forming a Head and Shoulders pattern on the 4-hour chart — a classic bearish reversal setup. The right shoulder is still in formation, with the neckline support around $35.26.
🔍 Key Levels to Watch:
Neckline: $35.26
Breakdown Target: $33.24
Pattern Type: Bearish Head & Shoulders
⚠️ A decisive break below the neckline could trigger a short-term correction toward $33.24. Until then, price action near the neckline should be watched closely for confirmation.
📉 Short bias on breakdown. Wait for confirmation before entry.

Silver levels for next week buy on dip near support avoid sell How My Harmonic pattern projection Indicator work is explained below :
Recent High or Low :
D-0% is our recent low or high
Profit booking zone: D13% -D15% is
range if break them profit booking start on uptrend or downtrend but only profit booking, trend not changed
SL reversal zone : SL 23% and SL 25% is reversal zone if break then trend reverse and we can take reverse trade
Target : T1, T2, T3, T4 and .
Are our Target zone

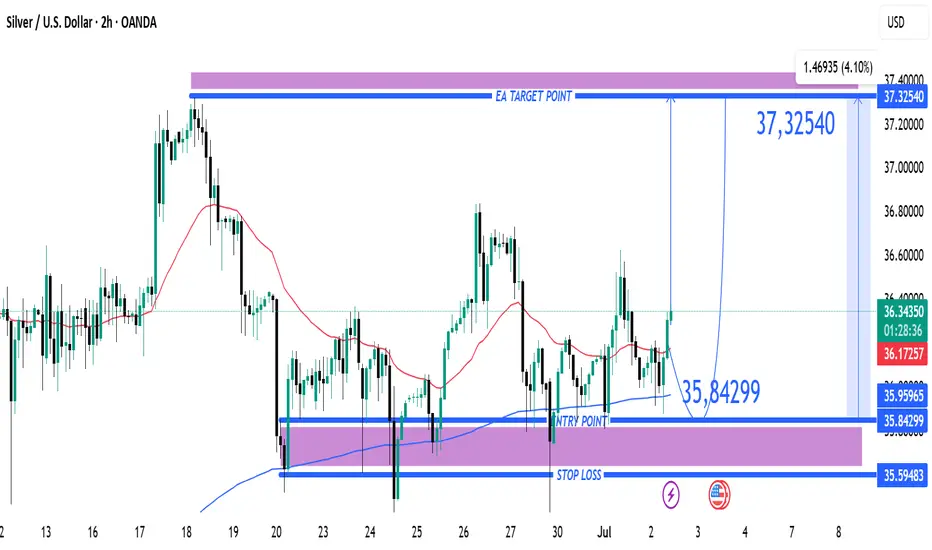
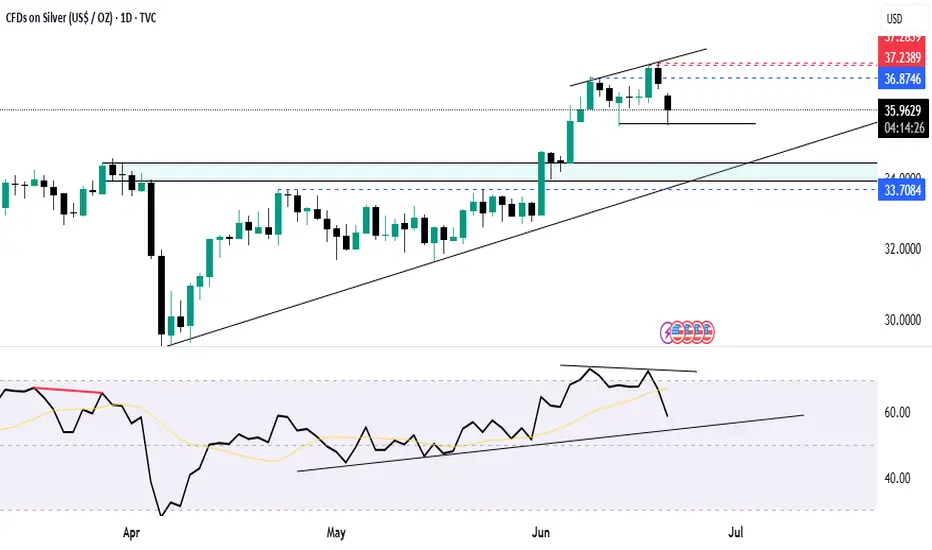
Silver (XAG/USD) Bullish Trade Setup from Key Support Zone XAG/USD (Silver) Trade Analysis – 2H Chart (July 2, 2025)
🔹 Trade Setup Overview:
Entry Point: 35.84299
Target (TP): 37.32540
Stop Loss (SL): 35.59483
Current Price: 36.36350
Risk/Reward Ratio: ~5.9:1 (Very favorable)
🔹 Technical Insights:
Support Zone:
Price recently tested and respected a strong demand zone between 35.60 – 35.84, which has now acted as a bounce level.
Multiple wicks and rejections at this zone highlight buyer interest.
Moving Averages:
50 EMA (red) is starting to flatten, possibly hinting at momentum reversal.
200 EMA (blue) held as dynamic support during the last dip — a bullish signal.
Breakout Potential:
Price has bounced off the entry zone and is approaching minor resistance near 36.40–36.60.
A clean break above this area can trigger momentum toward the 37.30s.
Volume & Momentum:
The latest candle shows strong bullish momentum, validating the bounce setup.
No sign of exhaustion yet.
🔹 Strategy Suggestion:
Entry has already occurred or is slightly above entry zone — ideal for aggressive traders to ride the momentum.
Conservative traders may wait for a pullback near 36.00–36.10 before entering.
SL is well-placed below previous lows and structure — reasonable protection.
🔹 Conclusion:
This setup reflects a bullish continuation trade from a strong support zone. Given the risk/reward profile and recent bullish action, this trade is technically sound as long as price stays above 35.84. A close below this level could invalidate the setup
Silver on a lifescale time frameOverall, I see that a rise in Silver prices is possible
The extent and speed of rise is getting higher
I feel a big rally is due in 2024 and after!

Silver Triangle Breakout Targets $37.00Long consolidation and stability above 4 hourly 50 EMA $36.20 leads to triangle resistance breakout above $36.55 opening the way towards swing high $36.85 followed by next leg higher $37.00 & $37.25
Major support sits at consolidation base $35.80 followed by triangle base $35.45

Silver making poll and flag pattern ready for fresh ATHHow My Harmonic pattern projection Indicator work is explained below :
Recent High or Low :
D-0% is our recent low or high
Profit booking zone: D13% -D15% is
range if break them profit booking start on uptrend or downtrend but only profit booking, trend not changed
SL reversal zone : SL 23% and SL 25% is reversal zone if break then trend reverse and we can take reverse trade
Target : T1, T2, T3, T4 and .
Are our Target zone
Silver buy on dip given yesterday morning enjoy huge profit How My Harmonic pattern projection Indicator work is explained below :
Recent High or Low :
D-0% is our recent low or high
Profit booking zone: D13% -D15% is
range if break them profit booking start on uptrend or downtrend but only profit booking, trend not changed
SL reversal zone : SL 23% and SL 25% is reversal zone if break then trend reverse and we can take reverse trade
Target : T1, T2, T3, T4 and .
Are our Target zone

Silver still buy on dip for positional fed rate cut upmove comeHow My Harmonic pattern projection Indicator work is explained below :
Recent High or Low :
D-0% is our recent low or high
Profit booking zone: D13% -D15% is
range if break them profit booking start on uptrend or downtrend but only profit booking, trend not changed
SL reversal zone : SL 23% and SL 25% is reversal zone if break then trend reverse and we can take reverse trade
Target : T1, T2, T3, T4 and .
Are our Target zone

Silver holding buy trade from 36$ 36.60, 36.90, 37.20 Target How My Harmonic pattern projection Indicator work is explained below :
Recent High or Low :
D-0% is our recent low or high
Profit booking zone: D13% -D15% is
range if break them profit booking start on uptrend or downtrend but only profit booking, trend not changed
SL reversal zone : SL 23% and SL 25% is reversal zone if break then trend reverse and we can take reverse trade
Target : T1, T2, T3, T4 and .
Are our Target zone

Silver Needs to Hold Above $35.80 to Reclaim $36.80The sharp sell off in Silver from $37.30 reached $35.50 and the new week Asian session trading witnesses some positive attempts to make a rebound towards $36.45 followed by $36.80
The current recovery requires stability above $35.80 which acts as local consolidation base.
Immediate resistance sits at $36.22 which bulls need to clear in order to move upward to $36.45
A strong break and stability above $36.45 opens the way to next leg higher $36.80
It is important to note that the immediate trend will flip to bearish if local support zone $35.80 fails to hold.

Silver comex updated levels buy on dip near 35.80 -35.70How My Harmonic pattern projection Indicator work is explained below :
Recent High or Low :
D-0% is our recent low or high
Profit booking zone: D13% -D15% is
range if break them profit booking start on uptrend or downtrend but only profit booking, trend not changed
SL reversal zone : SL 23% and SL 25% is reversal zone if break then trend reverse and we can take reverse trade
Target : T1, T2, T3, T4 and .
Are our Target zone

SILVER 1D🔹 Silver Technical View
🔸 Timeframe:
🔸 Bias:
🔸 Strategy:
🧠 Key Levels Marked on Chart
Below 35.56 can see 34.40/34.00
Above 36.50 can see 37.90+
Silver at Warzone – Breakout or Bloodbath? (XAG/USD D1 Analysis)Silver is trading at one of the most critical inflection zones in recent years. The chart shows a clear double top formation near the $33 mark (TOP1 & TOP2), but don’t be fooled — this setup could flip either way, with massive implications.
🔻 Bearish Outlook – Double Top Breakdown in Play
Price rejected twice at the same zone (~$32.5–33), forming a textbook double top.
If price breaks below $28.80 (neckline zone), it confirms the pattern.
Breakdown could lead to a violent drop with targets:
📉 $28.00 (psych level)
🎯 $22.73 (structural support)
🎯 $20.76 (macro base)
This setup aligns with a potential DXY bounce, tightening by the Fed, or global demand slowdown.
🟢 Bullish Flip – Breakout Above $33 Could Be Legendary
If Silver breaks $33+ with strong volume, the double top is invalidated.
This flips the narrative into a high timeframe breakout of a multi-year wedge.
Next targets open wide:
🚀 $36.00 (intermediate breakout zone)
🚀 $40–50 (parabolic rally territory)
Macro catalysts: Dovish Fed, USD weakness, or global geopolitical tensions.
⚠️ Final Take:
This is a binary setup.
Break below $28.80 = confirmed crash.
Break above $33 = breakout rally.
No middle ground. Watch price and ride the move.
📌 Trade the confirmation, not the prediction.
#Silver #XAGUSD #Commodities #PriceAction #TechnicalAnalysis #Breakout #TradingView #Metals #DoubleTop #Wedge #VolatilityAhead

Silver faked the break — bearish unfolding beginsSilver has delivered a classic bull trap, where price briefly breached the highs, lured breakout buyers, then reversed aggressively. The failure to hold above the breakout zone indicates institutional distribution. Now, momentum has flipped bearish with immediate downside targets in focus.
📊 key levels breakdown
zone/level description
35.14 immediate target — former breakout support
33.18 (blue line) structural level — high-volume node
31.80–32.20 deep down target — major April accumulation zone
📉 current price action insights
Daily structure is breaking down.
Clear rejection candle post breakout = strong bearish intent.
Price fell back into the old value area — suggests no bullish acceptance above.
🔻 bearish scenario pathway
✅ first leg: push to 35.14 — likely short-term.
🔜 if 35.14 fails: expect a quick slide toward 33.18 (prior liquidity pool).
📉 final target: the April-May accumulation zone around 32.00, where stronger hands may step in.
🧭 market psychology at play
breakout buyers are trapped — stop-loss hunting now in play.
Institutions engineered the breakout to build shorts at premium.
Unless reclaimed fast, price may continue hunting liquidity below.
⚠️ invalidation for bears
A daily close back above $36.00 with strong follow-through could invalidate this bearish scenario.
✅ summary
Silver has faked the breakout and is now shifting structurally bearish. All signs point toward a sell-on-rise setup with immediate and deep targets well defined. Only a strong reclaim of $36 would neutralize this bias — until then, downside looks active and attractive.
