XAUUSD / SILVER / SI ANALYSIS 07-JUN-2025: MORE TO GO?LTP: 36.33x
Supports: 34.99/33.70/32.67/31.65/28.31
Silver has done my initial target of 36.25.
I expect more bull move in the coming weeks/months/years.
Next targets on the Upside:
Target 1: 37-37.77, 38.21
Target 2: 40.34-40.64-41.1-42.3, 43.1-44.21
Extensions: 46.34-47.77-51
My view: Buy on dips.
Trade ideas

Analysis on Silver : XAGUSDSilver run halts at immediate resistance $36.12698
On breakout, upside targets are T1, T2 and T3 as mentioned respectively.
If price rejects this and falls below the Immediate support, then the 2024 year's high level will be a strong support to invalidate bullish sentiment.
Below S2, it will still be a weak bullish zone instead of a reversal or bearish knock.
IMO, a pullback is quite possible before hitting the upper targets. A valid close is important above the immediate resistance level.
There is a slight negative divergence in RSI to support the pullback.

XAGUSD / SILVER / SI BIGGER PICTURE ANALYSIS 30-May-2025: Bull oLTP 33.18
Support: 32.62/31.65
Resistances: 33.5/33.7
As long as it is above 32.62, I am bullish and expecting 33.55 first.
Targets:
Minimum target: 33.55-33.70-33.95
34.30
Normal target: 34.6-34.75-34.97
Ultimate target: 35.61-35.77-36.25
Buy on Dips is my view.

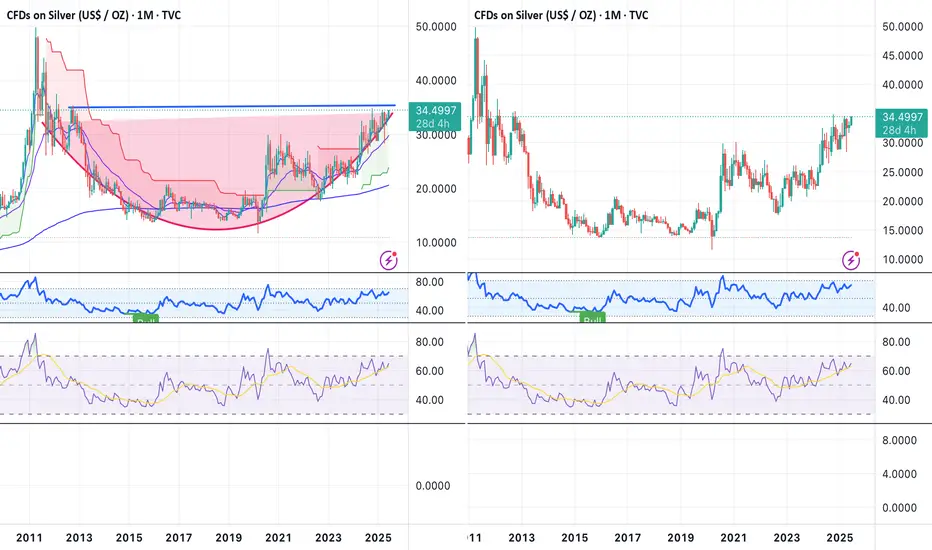
SILVER (MONTHLY- BULLISH )Price has given a proper breakout and restet of zone of
27.9156-30.2570
and again given a breakout of 27.9156-30.2570
Point To Note
- EMA 21.50.200 Lined Up Bullish
- Breakout And Retest
Next Resistance
-41.8665--44.2079
Till Then, Keep Learning

Silver continuesly buying given from 32.60 near still buy on dipHow to take trades using Harmonic pattern projection Trade setup is explained below :-
Entry : 1st SL point : 0% is recent top or bottom.
Trailing D: 15.1% is work as trailing SL of buy or sell trade if hit then we have to book profit
.If price goes below 2nd D 22.5% to 24.5% range then early traders can make fresh reversals trade after breaking 1st D 15.1% safe traders can reversal trade after breaking Point D 22.5.4% to 24.5% range
Targets :
Target T1 : 36.1% to 38.3%
Target T3 : 49.1% to 52.5%
T3: 60.9% to 64.8% is our 3rd Target since this is reversal zone so must book profit if break then take fresh trade again
Target T4 : 76.4% to 79.7%
Next Targets are 100% , 127.2% ,141.4% and final Target 161.8%.
How to take reversal trade :
If price going upside/ downside then then buy or sell levels appear on Chart ( Automatically show when price reach any reversal zone of harmonic projection ).
Trailing SL:
After reach 1st Target trail SL to just above or below cost ( for example we are holding sell trade from 100 1st Target 110 hit then move trailing sl to 104-105 and move SL as price move upside or Downside)
Re- Entry :
For Re-entry in any pull back Point D ( 15.1% ) is used for re-entry then SL recent high or low Point SL ( 0% ) .
Blue Line is 1st support/ Resistance
Green line is 2nd support/ resistance
Red line is 3rd Support/ resistance

Finally today Silver crossed 35 $ after consolidating for 3 mnthToday Silver finally crossed resistance of $35 after consolidating for 4 months. If it is able to sustain above 35 level we can see big rally of 50-100% in few months. It touched 36 in no time once it crossed 35 level. It may consolidate a bit in this range.

Silver (XAG/USD) Bullish Breakout Setup – 4H Chart Analysis📈 Bullish Setup
Key Zones & Levels:
🔵 Current Price: 33.48
🟣 EMA 70 (Support): 32.83
🔻 Acting as dynamic support
🟦 Demand Zone:
📍 32.54 - 32.83
🟢 Strong buying interest expected here
🟥 Resistance Zone:
📍 Around 33.48 - 33.60
⚠️ Breakout above this zone could trigger buying momentum
Trade Setup:
🚀 Entry Point:
🔵 33.11 - 33.12
🛑 Stop Loss:
🔻 32.54 (Just below demand zone and EMA)
🎯 Target (Take Profit):
🎯 35.50
✨ Potential gain if breakout confirms
Price Path Projection:
🔹 Scenario 1: Bounce from demand zone → Break resistance → Hit target
🟢➡️📈➡️🎯
🔸 Scenario 2: Immediate breakout above resistance
📈⚡➡️🎯
Summary:
Trend: Bullish
EMA and trendline support price
Risk/Reward is favorable
Watch for confirmation before entry

Silver also looking good from HereThis is the only time frame where I am watching silver as on now (On Monthly )
Chart is self explanatory, All we need a break above 35 , closing above this level can start a much awaited bull run on silver from here.
and if we see good momentum from silver , gold also goig to follow the same in short term to mid term basis.

Silver still upmove will continue avoid any sell trade How to take trades using Harmonic pattern projection Trade setup is explained below :-
Entry : 1st SL point : 0% is recent top or bottom.
Trailing D: 15.1% is work as trailing SL of buy or sell trade if hit then we have to book profit
.If price goes below 2nd D 22.5% to 24.5% range then early traders can make fresh reversals trade after breaking 1st D 15.1% safe traders can reversal trade after breaking Point D 22.5.4% to 24.5% range
Targets :
Target T1 : 36.1% to 38.3%
Target T3 : 49.1% to 52.5%
T3: 60.9% to 64.8% is our 3rd Target since this is reversal zone so must book profit if break then take fresh trade again
Target T4 : 76.4% to 79.7%
Next Targets are 100% , 127.2% ,141.4% and final Target 161.8%.
How to take reversal trade :
If price going upside/ downside then then buy or sell levels appear on Chart ( Automatically show when price reach any reversal zone of harmonic projection ).
Trailing SL:
After reach 1st Target trail SL to just above or below cost ( for example we are holding sell trade from 100 1st Target 110 hit then move trailing sl to 104-105 and move SL as price move upside or Downside)
Re- Entry :
For Re-entry in any pull back Point D ( 15.1% ) is used for re-entry then SL recent high or low Point SL ( 0% ) .
Blue Line is 1st support/ Resistance
Green line is 2nd support/ resistance
Red line is 3rd Support/ resistance

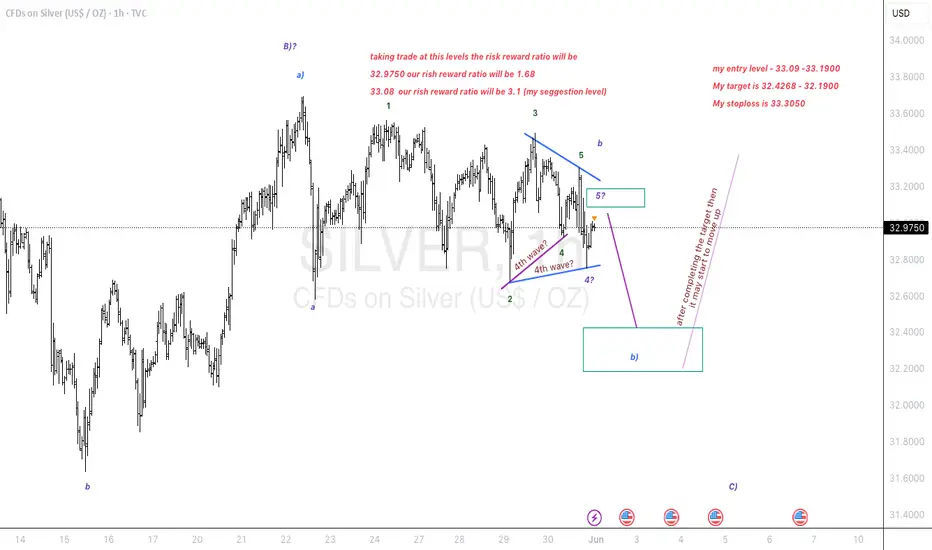
Triangle breakout in silver. Down to earth..
Elliott Wave Analysis:-
1st possibility:- (look Previous chart published)
Silver is in a triangle breakout. if it is getting towards upside breakout then we have a nice opportunity of pullback and and we can add it if the pullback occurs. else we can enjoy this journey quietly.
2nd possibility:-
Silver had already made a pullback towards down side breakout. Once it start the way it will fly towards downside and then it will complete a C wave in whole B wave then upside C wave will be impulsive.
My Entry, Stop, Target all have been discussed.
My suggestion to take a trade at this place to reduce the risk better reward.
I just spoke what chart whisper's in my ear.
I am not a SEBI registered advisor. Before taking a trade do your own analysis or consult a financial advisor. I share chart for education purpose only. I share my trade setup.
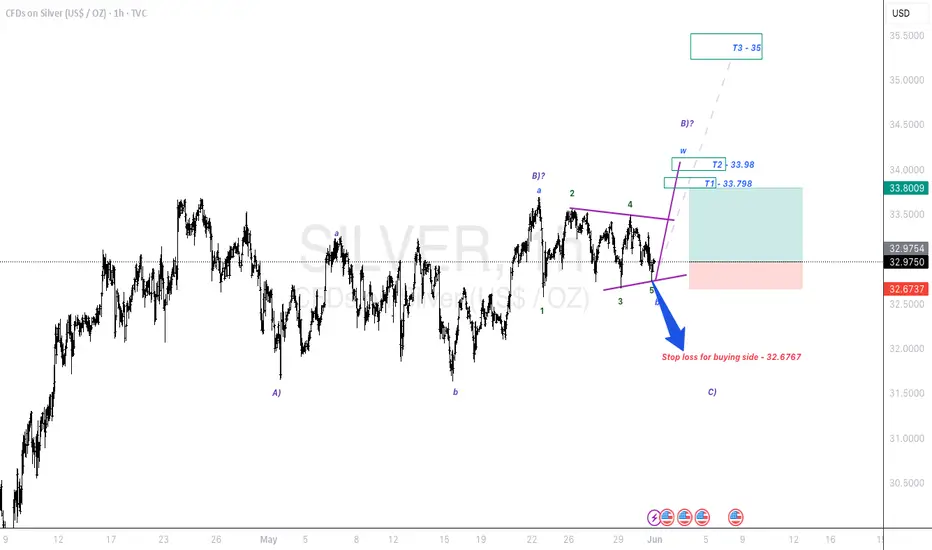
silver in triangle breakout. Two possibilities. one is impulisveElliott Wave Analysis:-
1st possibility:-
Silver is in a triangle breakout . if it is getting towards upside breakout then we have a nice opportunity of pullback and and we can add it if the pullback occurs. else we can enjoy this journey quietly.
2nd possibility:-
Silver had already made a pullback towards down side breakout. Once it start the way it will fly towards downside and then it will complete a C wave in whole B wave then upside C wave will be impulsive.
This type 2 will be discussed in next chart. I will post it as seperately chart for clear understanding .
I am not a SEBI registered advisor. Before taking a trade do your own analysis or consult a financial advisor. I share chart for education purpose only. I share my trade setup.
The short term looks fantasticAfter the extreme squeeze the Silver price is stuck in a range
That range can break on the upside once the Fib range breakout above the shown zone happens
I have drawn a reverse Fib from the recent high to low that happened over just 3 days.
Overall, TVC:SILVER looks great in the Short term, medium term and long term.

Will Silver break out in rounding bottom after 13 years..?Silver is consolidate since quite sometime with resistance at 34.50-34.90 level. Today it has shown some good strength and if it’s able to cross and sustain above 34.90-35.00 then it’s open to SKY and has potential for 50%+ gain. Keep an eyes.
XAG/USD 1;85 RR TRADEThis trade went out of my league. I was targeting for a 1;15 RR but god gave me more than that.
Market is supreme & everything is possible in it.

Silver EW updateSilver update
Patternfrom 31.66 low to top looks like ABC, A is ending at 32.72 and b is around 31.90, and C wave is a impulsive 5 wave pattern clearly visible,
reason behind considering it ABC are 1-This ABCmove has an extention of161.8%, 2- after completion of C, it has retraced more than 50 % which made me consider it as ABC, another question might be raised as it can be LD, but as per rules of LD,LD can't have a 3rd wave touching or breaking 161.8%, so left with only choice of considering it as ABC,
Considering ABC means price will be coming down in upcoming days.
Lets see what unfolds in upcoming days.

Silver coils within tight range of $33.45-$32.70 Breakout ahead!Long consolidation within $33.45 resistance and $32.70 support keeps Silver trading within a tight range and markets may witness a breakout of the range ahead.
Next immediate targeted resistance sits at $33.70 while next immediate support is seen positioned at $32.40
Major move comes after the breakout and retest which we will cover in next report after the breakout.

Precision Pays Off: Analysis Hit Again! Another Win🎯 Analysis On Point Again!
My recent analysis played out exactly as expected. 📉📈 Those who followed my instructions not only gained profits but also improved their trading knowledge and decision-making skills.
Success in trading isn't just about luck — it's about learning to read the market with precision and discipline. 📚💡
To those who’ve been riding along — congratulations on your gains! 🥂 And to the new followers, stay tuned. The next winning setups are just around the corner.
Let’s grow, learn, and earn — together. 🚀💸

Silver as said earlier fall possible buy near 94500How to take trades using Harmonic pattern projection Trade setup is explained below :-
Entry : 1st SL point : 0% is recent top or bottom.
Trailing D: 15.1% is work as trailing SL of buy or sell trade if hit then we have to book profit
.If price goes below 2nd D 22.5% to 24.5% range then early traders can make fresh reversals trade after breaking 1st D 15.1% safe traders can reversal trade after breaking Point D 22.5.4% to 24.5% range
Targets :
Target T1 : 36.1% to 38.3%
Target T3 : 49.1% to 52.5%
T3: 60.9% to 64.8% is our 3rd Target since this is reversal zone so must book profit if break then take fresh trade again
Target T4 : 76.4% to 79.7%
Next Targets are 100% , 127.2% ,141.4% and final Target 161.8%.
How to take reversal trade :
If price going upside/ downside then then buy or sell levels appear on Chart ( Automatically show when price reach any reversal zone of harmonic projection ).
Trailing SL:
After reach 1st Target trail SL to just above or below cost ( for example we are holding sell trade from 100 1st Target 110 hit then move trailing sl to 104-105 and move SL as price move upside or Downside)
Re- Entry :
For Re-entry in any pull back Point D ( 15.1% ) is used for re-entry then SL recent high or low Point SL ( 0% ) .
Blue Line is 1st support/ Resistance
Green line is 2nd support/ resistance
Red line is 3rd Support/ resistance

Silver also falling as said on Friday 97500-94000 rangeHow to take trades using Harmonic pattern projection Trade setup is explained below :-
Entry : 1st SL point : 0% is recent top or bottom.
Trailing D: 15.1% is work as trailing SL of buy or sell trade if hit then we have to book profit
.If price goes below 2nd D 22.5% to 24.5% range then early traders can make fresh reversals trade after breaking 1st D 15.1% safe traders can reversal trade after breaking Point D 22.5.4% to 24.5% range
Targets :
Target T1 : 36.1% to 38.3%
Target T3 : 49.1% to 52.5%
T3: 60.9% to 64.8% is our 3rd Target since this is reversal zone so must book profit if break then take fresh trade again
Target T4 : 76.4% to 79.7%
Next Targets are 100% , 127.2% ,141.4% and final Target 161.8%.
How to take reversal trade :
If price going upside/ downside then then buy or sell levels appear on Chart ( Automatically show when price reach any reversal zone of harmonic projection ).
Trailing SL:
After reach 1st Target trail SL to just above or below cost ( for example we are holding sell trade from 100 1st Target 110 hit then move trailing sl to 104-105 and move SL as price move upside or Downside)
Re- Entry :
For Re-entry in any pull back Point D ( 15.1% ) is used for re-entry then SL recent high or low Point SL ( 0% ) .
Blue Line is 1st support/ Resistance
Green line is 2nd support/ resistance
Red line is 3rd Support/ resistance

XAG/USD Rejection Looming at Key Resistance – Bearish Reversal A🔍 Chart Analysis – XAG/USD
1. Trend & EMAs:
The chart shows two key exponential moving averages:
📈 EMA 50 (Red): 33.1940
📉 EMA 200 (Blue): 32.8684
Price is currently above both EMAs, indicating a short-term bullish trend, but a possible bearish rejection is forming near resistance.
2. Key Zones:
🟥 Resistance Zone: 33.45 – 33.60
Price has repeatedly tested this zone and reversed, suggesting strong selling pressure.
Multiple wicks into this zone show buyer exhaustion.
🟩 Support Zone: 32.60 – 32.85
Strong demand observed here with consistent bounces.
The EMA 200 also aligns with this support, reinforcing its strength.
3. Price Behavior & Pattern:
🧱 Repetitive Bearish Drops: Marked by blue rectangles, suggesting a pattern of sharp sell-offs after touching resistance.
🔁 Potential Double Top Pattern forming near the resistance zone, a classic bearish reversal signal.
🧭 The projected path suggests:
A short-term retest of the resistance.
Followed by a pullback toward the support zone around 32.60.
Breakdown below support could open further downside potential.
📌 Summary:
⚠️ Short-Term Outlook: Bearish bias if resistance holds.
📍 Key Level to Watch: 33.60 (breakout) and 32.60 (breakdown).
🔄 Trade Plan:
Consider short entries near 33.45–33.60 resistance zone with stops above 33.65.
Target around 32.65–32.60 support zone.
📊 Indicators in Play:
EMA confluence supports trend analysis.
Price structure and rejection patterns suggest likely mean reversion to support.

Silver strong avoid any sell trade buy near support How to take trades using Harmonic pattern projection Trade setup is explained below :-
Entry : 1st SL point : 0% is recent top or bottom.
Trailing D: 15.1% is work as trailing SL of buy or sell trade if hit then we have to book profit
.If price goes below 2nd D 22.5% to 24.5% range then early traders can make fresh reversals trade after breaking 1st D 15.1% safe traders can reversal trade after breaking Point D 22.5.4% to 24.5% range
Targets :
Target T1 : 36.1% to 38.3%
Target T3 : 49.1% to 52.5%
T3: 60.9% to 64.8% is our 3rd Target since this is reversal zone so must book profit if break then take fresh trade again
Target T4 : 76.4% to 79.7%
Next Targets are 100% , 127.2% ,141.4% and final Target 161.8%.
How to take reversal trade :
If price going upside/ downside then then buy or sell levels appear on Chart ( Automatically show when price reach any reversal zone of harmonic projection ).
Trailing SL:
After reach 1st Target trail SL to just above or below cost ( for example we are holding sell trade from 100 1st Target 110 hit then move trailing sl to 104-105 and move SL as price move upside or Downside)
Re- Entry :
For Re-entry in any pull back Point D ( 15.1% ) is used for re-entry then SL recent high or low Point SL ( 0% ) .
Blue Line is 1st support/ Resistance
Green line is 2nd support/ resistance
Red line is 3rd Support/ resistance

Silver comex updated levels buy on dip near support How to take trades using Harmonic pattern projection Trade setup is explained below :-
Entry : 1st SL point : 0% is recent top or bottom.
Trailing D: 15.1% is work as trailing SL of buy or sell trade if hit then we have to book profit
.If price goes below 2nd D 22.5% to 24.5% range then early traders can make fresh reversals trade after breaking 1st D 15.1% safe traders can reversal trade after breaking Point D 22.5.4% to 24.5% range
Targets :
Target T1 : 36.1% to 38.3%
Target T3 : 49.1% to 52.5%
T3: 60.9% to 64.8% is our 3rd Target since this is reversal zone so must book profit if break then take fresh trade again
Target T4 : 76.4% to 79.7%
Next Targets are 100% , 127.2% ,141.4% and final Target 161.8%.
How to take reversal trade :
If price going upside/ downside then then buy or sell levels appear on Chart ( Automatically show when price reach any reversal zone of harmonic projection ).
Trailing SL:
After reach 1st Target trail SL to just above or below cost ( for example we are holding sell trade from 100 1st Target 110 hit then move trailing sl to 104-105 and move SL as price move upside or Downside)
Re- Entry :
For Re-entry in any pull back Point D ( 15.1% ) is used for re-entry then SL recent high or low Point SL ( 0% ) .
Blue Line is 1st support/ Resistance
Green line is 2nd support/ resistance
Red line is 3rd Support/ resistance

Silver comex weekly levels buy near support sell near resistanceHow to take trades using Harmonic pattern projection Trade setup is explained below :-
Entry : 1st SL point : 0% is recent top or bottom.
Trailing D: 15.1% is work as trailing SL of buy or sell trade if hit then we have to book profit
.If price goes below 2nd D 22.5% to 24.5% range then early traders can make fresh reversals trade after breaking 1st D 15.1% safe traders can reversal trade after breaking Point D 22.5.4% to 24.5% range
Targets :
Target T1 : 36.1% to 38.3%
Target T3 : 49.1% to 52.5%
T3: 60.9% to 64.8% is our 3rd Target since this is reversal zone so must book profit if break then take fresh trade again
Target T4 : 76.4% to 79.7%
Next Targets are 100% , 127.2% ,141.4% and final Target 161.8%.
How to take reversal trade :
If price going upside/ downside then then buy or sell levels appear on Chart ( Automatically show when price reach any reversal zone of harmonic projection ).
Trailing SL:
After reach 1st Target trail SL to just above or below cost ( for example we are holding sell trade from 100 1st Target 110 hit then move trailing sl to 104-105 and move SL as price move upside or Downside)
Re- Entry :
For Re-entry in any pull back Point D ( 15.1% ) is used for re-entry then SL recent high or low Point SL ( 0% ) .
Blue Line is 1st support/ Resistance
Green line is 2nd support/ resistance
Red line is 3rd Support/ resistance
