silver soon topssilver could top soon , it had made the top and fallen , so could the history repeat ? we could see gold and silver prices falling soon because nothing could go so up forever

Silver’s Bullish Cycle: Zones to Buy, Levels to Aim ! Silver is running one of its strongest bullish phases in recent years, having broken through key ranges and now holding around the mid-43s with momentum still intact. The structure shows that 42.7 is the immediate support staying above this level keeps short-term bulls in control. Once pressure mou

Silver Spot Price Technical Analysis [28-09-2025] Buy on DipsAny Correction Buy on Dips - Silver Spot (XAG/USD) daily chart from (dated 2025.09.27), here’s a technical analysis: The chart indicates a continuation of an uptrend, with the price recently breaking out above a key resistance level around 45.013. This breakout is supported by a strong upward move,

SILVERHello & welcome to this analysis
Silver in daily time frame appears to be in its 5th wave.
The larger impulse could end anywhere between $43.50 - 45 / INR 125000 - 129000. From there I expect it to retrace to $38 /INR 116000
MCX Silver will depend largely on $:INR movement.
Silver remains a stro

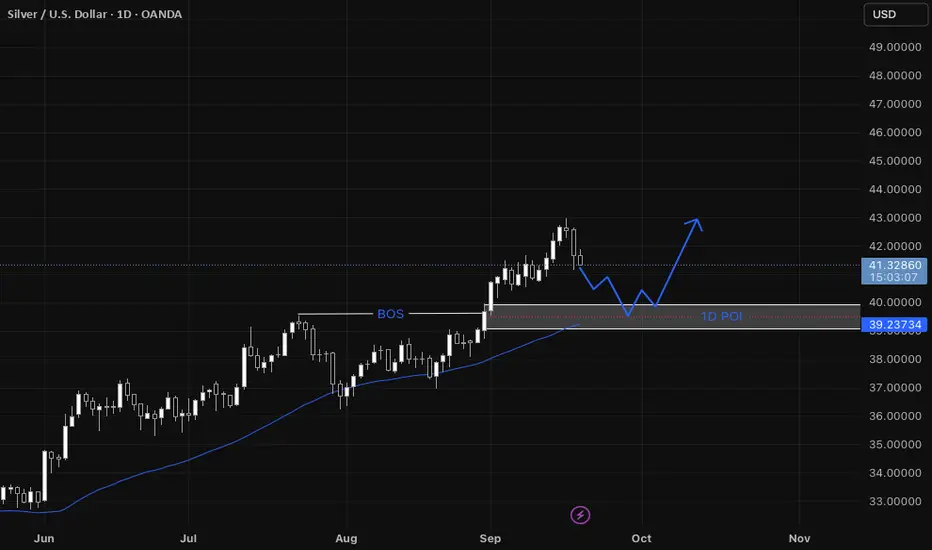
XAGUSD Step-by-step entry plan for XAGUSD
1. We have our Daily Point of Interest (POI)
- On the daily a zone that contains:
* a fair value gap (FVG),
* a break of structure (BOS) that previously acted as resistance and is now expected
Silver holding buy trade from 46.70 , upside target 48.40Silver holding buy trade from 46.70 upside target 48.40 then we will see new ATH
How My Harmonic pattern projection Indicator work is explained below :
Recent High or Low :
D-0% is our recent low or high
Profit booking zone ( Early / Risky entry) : D 12.3% -D 16.1 % is
range if break the

Silver Bullish Breakout on Monthly & Weekly CharPattern Formed: Symmetrical Triangle (Long-Term Consolidation)
Breakout Type: Bullish Breakout on Monthly & Weekly Chart
Volume Confirmation: Strength in breakout with price expansion
Measured Move Target: ~$44 (based on triangle height projection)
Immediate Resistance Zone: $44.11 (Historical s

Silver comex updated levels silver ready for New ATHSilver comex updated levels given on chart,silver will try to break previous ATH and make fresh ATH buy on dip near support
How My Harmonic pattern projection Indicator work is explained below :
Recent High or Low :
D-0% is our recent low or high
Profit booking zone ( Early / Risky entry) :

Bullish Silver is looking very very hot
Its bullish Flag making if silver sustain this week above 42.25$, then it comes to 49 superfast maybe next in two days only
There's no recommendations from my side
Only for learning purpose

XAGUSD / SILVER / SI ANALYSIS 01-SEP-2025LTP: 40.44x
Supports: 38.07/37.41/35.21
As long as the above supports levels hold, we will see 40.89-41.77-43.16 first.
Further Targets:
45.07
46.73-47.55-48.91 (Ultimate target)
52.50-53.37-55.95 (Extension)

See all ideas
Displays a symbol's price movements over previous years to identify recurring trends.