Silver comex updated levels buy on dip near 35.80 -35.70How My Harmonic pattern projection Indicator work is explained below :
Recent High or Low :
D-0% is our recent low or high
Profit booking zone: D13% -D15% is
range if break them profit booking start on uptrend or downtrend but only profit booking, trend not changed
SL reversal zone : SL 23% and SL 25% is reversal zone if break then trend reverse and we can take reverse trade
Target : T1, T2, T3, T4 and .
Are our Target zone
SILVERMINICFD trade ideas

SILVER 1D🔹 Silver Technical View
🔸 Timeframe:
🔸 Bias:
🔸 Strategy:
🧠 Key Levels Marked on Chart
Below 35.56 can see 34.40/34.00
Above 36.50 can see 37.90+
Silver at Warzone – Breakout or Bloodbath? (XAG/USD D1 Analysis)Silver is trading at one of the most critical inflection zones in recent years. The chart shows a clear double top formation near the $33 mark (TOP1 & TOP2), but don’t be fooled — this setup could flip either way, with massive implications.
🔻 Bearish Outlook – Double Top Breakdown in Play
Price rejected twice at the same zone (~$32.5–33), forming a textbook double top.
If price breaks below $28.80 (neckline zone), it confirms the pattern.
Breakdown could lead to a violent drop with targets:
📉 $28.00 (psych level)
🎯 $22.73 (structural support)
🎯 $20.76 (macro base)
This setup aligns with a potential DXY bounce, tightening by the Fed, or global demand slowdown.
🟢 Bullish Flip – Breakout Above $33 Could Be Legendary
If Silver breaks $33+ with strong volume, the double top is invalidated.
This flips the narrative into a high timeframe breakout of a multi-year wedge.
Next targets open wide:
🚀 $36.00 (intermediate breakout zone)
🚀 $40–50 (parabolic rally territory)
Macro catalysts: Dovish Fed, USD weakness, or global geopolitical tensions.
⚠️ Final Take:
This is a binary setup.
Break below $28.80 = confirmed crash.
Break above $33 = breakout rally.
No middle ground. Watch price and ride the move.
📌 Trade the confirmation, not the prediction.
#Silver #XAGUSD #Commodities #PriceAction #TechnicalAnalysis #Breakout #TradingView #Metals #DoubleTop #Wedge #VolatilityAhead

Silver faked the break — bearish unfolding beginsSilver has delivered a classic bull trap, where price briefly breached the highs, lured breakout buyers, then reversed aggressively. The failure to hold above the breakout zone indicates institutional distribution. Now, momentum has flipped bearish with immediate downside targets in focus.
📊 key levels breakdown
zone/level description
35.14 immediate target — former breakout support
33.18 (blue line) structural level — high-volume node
31.80–32.20 deep down target — major April accumulation zone
📉 current price action insights
Daily structure is breaking down.
Clear rejection candle post breakout = strong bearish intent.
Price fell back into the old value area — suggests no bullish acceptance above.
🔻 bearish scenario pathway
✅ first leg: push to 35.14 — likely short-term.
🔜 if 35.14 fails: expect a quick slide toward 33.18 (prior liquidity pool).
📉 final target: the April-May accumulation zone around 32.00, where stronger hands may step in.
🧭 market psychology at play
breakout buyers are trapped — stop-loss hunting now in play.
Institutions engineered the breakout to build shorts at premium.
Unless reclaimed fast, price may continue hunting liquidity below.
⚠️ invalidation for bears
A daily close back above $36.00 with strong follow-through could invalidate this bearish scenario.
✅ summary
Silver has faked the breakout and is now shifting structurally bearish. All signs point toward a sell-on-rise setup with immediate and deep targets well defined. Only a strong reclaim of $36 would neutralize this bias — until then, downside looks active and attractive.

Silver currently at support buy on dip avoid sell trade on silveHow to take trades using Harmonic pattern projection Trade setup is explained below :-
Entry : 1st SL point : 0% is recent top or bottom.
Trailing D: 15.1% is work as trailing SL of buy or sell trade if hit then we have to book profit
.If price goes below 2nd D 22.5% to 24.5% range then early traders can make fresh reversals trade after breaking 1st D 15.1% safe traders can reversal trade after breaking Point D 22.5.4% to 24.5% range
Targets :
Target T1 : 36.1% to 38.3%
Target T3 : 49.1% to 52.5%
T3: 60.9% to 64.8% is our 3rd Target since this is reversal zone so must book profit if break then take fresh trade again
Target T4 : 76.4% to 79.7%
Next Targets are 100% , 127.2% ,141.4% and final Target 161.8%.
How to take reversal trade :
If price going upside/ downside then then buy or sell levels appear on Chart ( Automatically show when price reach any reversal zone of harmonic projection ).
Trailing SL:
After reach 1st Target trail SL to just above or below cost ( for example we are holding sell trade from 100 1st Target 110 hit then move trailing sl to 104-105 and move SL as price move upside or Downside)
Re- Entry :
For Re-entry in any pull back Point D ( 15.1% ) is used for re-entry then SL recent high or low Point SL ( 0% ) .
Blue Line is 1st support/ Resistance
Green line is 2nd support/ resistance
Red line is 3rd Support/ resistance

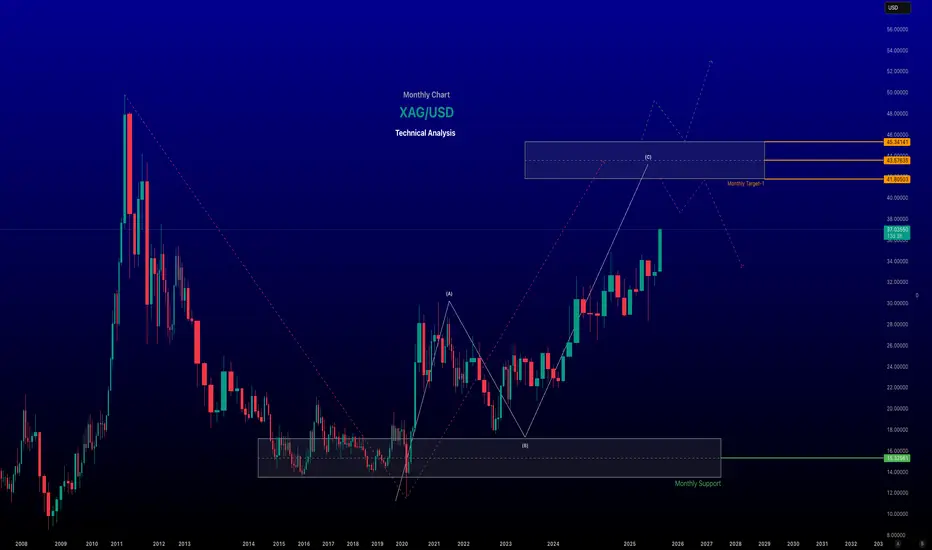
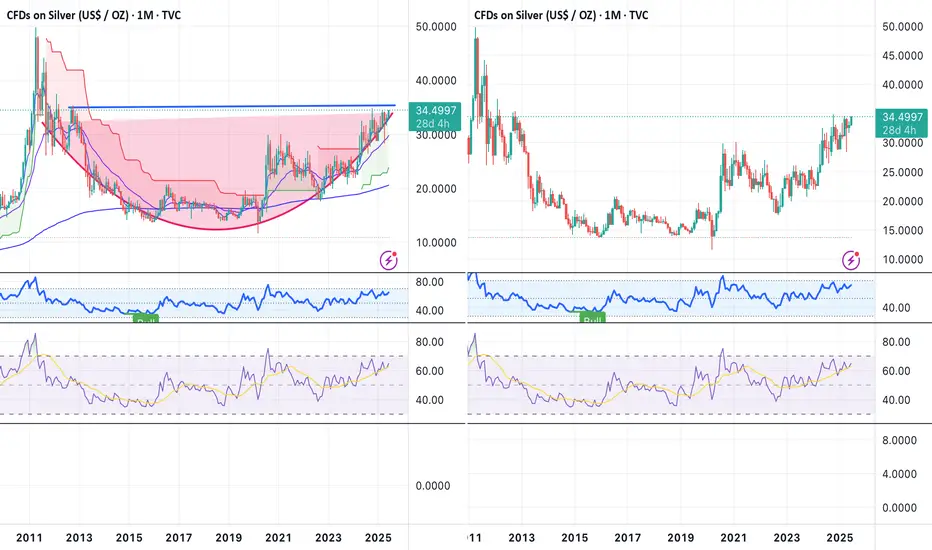
XAG/USD (Silver Spot vs. US Dollar) Analysis - Monthly Chart ~~ XAG/USD (Silver Spot vs. US Dollar) Analysis ~~
#Current Price and Recent Performance
As of June 18, 2025, the XAG/USD spot price is approximately $37.00 per troy ounce at the time of posting, reflecting a 13-year high. Silver has surged nearly 30% year-to-date in 2025, driven by heightened safe-haven demand amid geopolitical tensions, particularly in the Middle East, and global economic uncertainties. Over the past month, silver prices have risen by 12.43%, and year-over-year, they are up 23.33%.
-- Key Drivers of Recent Trends
Geopolitical Tensions: Escalating conflicts, such as Israel’s military actions in Iran, have boosted demand for safe-haven assets like silver and gold. This has been a significant catalyst for silver’s rally, with prices climbing in tandem with gold.
US Dollar Weakness: A softer US dollar, influenced by expectations of Federal Reserve rate cuts and softer inflation data, has supported higher silver prices. Since silver is priced in USD, a weaker dollar makes it more affordable for foreign investors, increasing demand.
Industrial Demand: Silver’s dual role as a precious and industrial metal (used in electronics, solar panels, and medical devices) accounts for ~56% of its demand. Growing industrial applications, particularly in green technologies, continue to support price growth.
Supply Constraints: A persistent supply deficit of 150–200 million ounces annually (10–20% of total supply) and declining above-ground inventories by nearly 500 million ounces in recent years have tightened the market, pushing prices higher.
Speculative Activity: Futures and spot market trading on exchanges like COMEX and the London Bullion Market, coupled with speculative interest, contribute to price volatility. The market is also influenced by “paper silver” (futures, ETFs), which some argue suppresses physical silver prices.
~~Technical Analysis~~
Current Levels and Trends: Silver is trading above the key support zone of $34.90–$35.15, maintaining a bullish outlook. Recent suggest a strong bullish trend, with a breakout above a downward trend line and minor resistance on the 4-hour chart.
Support and Resistance:
Support: Key levels include $34.99, $33.70, $32.67, and the 0.618 Fibonacci retracement at ~$35.00.
Resistance: Immediate resistance lies at $37.85, with further targets at $38.00 and potentially $40.34–$44.21 in the coming weeks or months.
-- Disclaimer --
This analysis is based on recent technical data and market sentiment from web sources. It is for informational purposes only and not financial advice. Trading involves high risks, and past performance does not guarantee future results. Always conduct your own research or consult a SEBI-registered advisor before trading.
#Boost and comment will be highly appreciated
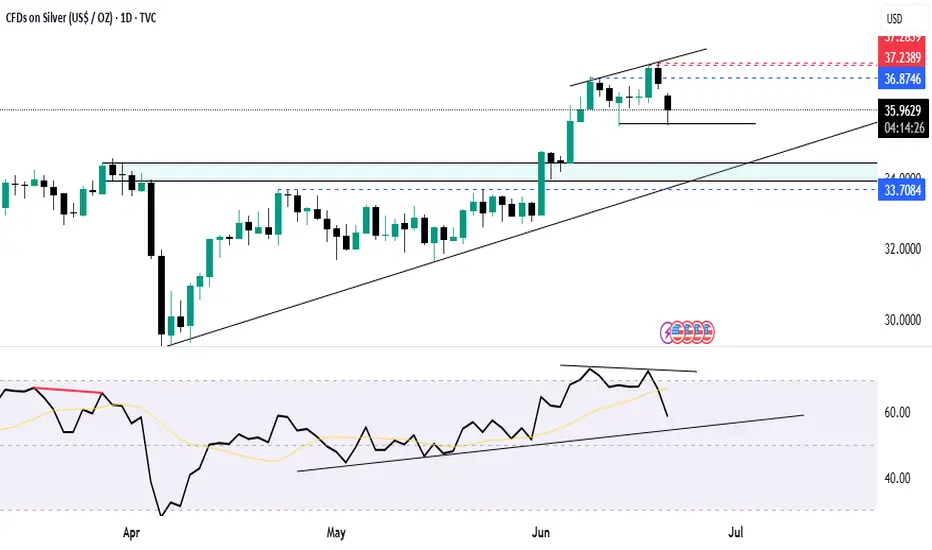
Silver flag to go higher with best risk rewardChart Analysis Overview:
Silver is consolidating in a bullish pennant/flag pattern after a strong uptrend.
The price is hovering near $36.17, showing healthy consolidation after a breakout.
According to the Ichimoku Cloud:
Price is well above the Ichimoku Cloud, indicating a strong bullish trend.
The Tenkan-sen (red) and Kijun-sen (blue) are supporting from below (~$35.53 & ~$34.27), acting as dynamic supports.
Directional Movement Index (DMI):
+DI (blue) > -DI (red) = Bullish bias.
ADX (orange) is above 20 (~14.65), indicating trend strength is building.
Pattern Formation:
A bullish pennant is forming, which generally breaks upward after a strong prior rally.
Breakout point lies above $36.50–36.70, which is the top of the pennant.
[/b Trading Idea for Swing Traders:
🔹 Buy Entry:
Above $36.75 (Breakout confirmation above flag/pennant resistance)
🎯 Targets:
Target 1: $37.50
Target 2: $38.40
Target 3: $39.20 (extended if breakout is strong and momentum continues)
🔻 Stop Loss:
Below $35.30 (below recent swing low and cloud support)
🛡️ Risk-Reward Justification:
This setup offers a favorable risk-reward ratio (~1:2.5 or better).
Bullish trend with consolidation suggests trend continuation.

Buy Silver for 54 DollarSilver Daily Chart:
Triangle Breakout with Momentum :
any Retest will give a opportunity to add for long Term Portfoilo.
Fibo Trend Setup suggesting 54 Dollar is coming in some months

XAUUSD / SILVER / SI ANALYSIS 07-JUN-2025: MORE TO GO?LTP: 36.33x
Supports: 34.99/33.70/32.67/31.65/28.31
Silver has done my initial target of 36.25.
I expect more bull move in the coming weeks/months/years.
Next targets on the Upside:
Target 1: 37-37.77, 38.21
Target 2: 40.34-40.64-41.1-42.3, 43.1-44.21
Extensions: 46.34-47.77-51
My view: Buy on dips.

Analysis on Silver : XAGUSDSilver run halts at immediate resistance $36.12698
On breakout, upside targets are T1, T2 and T3 as mentioned respectively.
If price rejects this and falls below the Immediate support, then the 2024 year's high level will be a strong support to invalidate bullish sentiment.
Below S2, it will still be a weak bullish zone instead of a reversal or bearish knock.
IMO, a pullback is quite possible before hitting the upper targets. A valid close is important above the immediate resistance level.
There is a slight negative divergence in RSI to support the pullback.

XAGUSD / SILVER / SI BIGGER PICTURE ANALYSIS 30-May-2025: Bull oLTP 33.18
Support: 32.62/31.65
Resistances: 33.5/33.7
As long as it is above 32.62, I am bullish and expecting 33.55 first.
Targets:
Minimum target: 33.55-33.70-33.95
34.30
Normal target: 34.6-34.75-34.97
Ultimate target: 35.61-35.77-36.25
Buy on Dips is my view.

SILVER (MONTHLY- BULLISH )Price has given a proper breakout and restet of zone of
27.9156-30.2570
and again given a breakout of 27.9156-30.2570
Point To Note
- EMA 21.50.200 Lined Up Bullish
- Breakout And Retest
Next Resistance
-41.8665--44.2079
Till Then, Keep Learning

Silver continuesly buying given from 32.60 near still buy on dipHow to take trades using Harmonic pattern projection Trade setup is explained below :-
Entry : 1st SL point : 0% is recent top or bottom.
Trailing D: 15.1% is work as trailing SL of buy or sell trade if hit then we have to book profit
.If price goes below 2nd D 22.5% to 24.5% range then early traders can make fresh reversals trade after breaking 1st D 15.1% safe traders can reversal trade after breaking Point D 22.5.4% to 24.5% range
Targets :
Target T1 : 36.1% to 38.3%
Target T3 : 49.1% to 52.5%
T3: 60.9% to 64.8% is our 3rd Target since this is reversal zone so must book profit if break then take fresh trade again
Target T4 : 76.4% to 79.7%
Next Targets are 100% , 127.2% ,141.4% and final Target 161.8%.
How to take reversal trade :
If price going upside/ downside then then buy or sell levels appear on Chart ( Automatically show when price reach any reversal zone of harmonic projection ).
Trailing SL:
After reach 1st Target trail SL to just above or below cost ( for example we are holding sell trade from 100 1st Target 110 hit then move trailing sl to 104-105 and move SL as price move upside or Downside)
Re- Entry :
For Re-entry in any pull back Point D ( 15.1% ) is used for re-entry then SL recent high or low Point SL ( 0% ) .
Blue Line is 1st support/ Resistance
Green line is 2nd support/ resistance
Red line is 3rd Support/ resistance

Finally today Silver crossed 35 $ after consolidating for 3 mnthToday Silver finally crossed resistance of $35 after consolidating for 4 months. If it is able to sustain above 35 level we can see big rally of 50-100% in few months. It touched 36 in no time once it crossed 35 level. It may consolidate a bit in this range.

Silver (XAG/USD) Bullish Breakout Setup – 4H Chart Analysis📈 Bullish Setup
Key Zones & Levels:
🔵 Current Price: 33.48
🟣 EMA 70 (Support): 32.83
🔻 Acting as dynamic support
🟦 Demand Zone:
📍 32.54 - 32.83
🟢 Strong buying interest expected here
🟥 Resistance Zone:
📍 Around 33.48 - 33.60
⚠️ Breakout above this zone could trigger buying momentum
Trade Setup:
🚀 Entry Point:
🔵 33.11 - 33.12
🛑 Stop Loss:
🔻 32.54 (Just below demand zone and EMA)
🎯 Target (Take Profit):
🎯 35.50
✨ Potential gain if breakout confirms
Price Path Projection:
🔹 Scenario 1: Bounce from demand zone → Break resistance → Hit target
🟢➡️📈➡️🎯
🔸 Scenario 2: Immediate breakout above resistance
📈⚡➡️🎯
Summary:
Trend: Bullish
EMA and trendline support price
Risk/Reward is favorable
Watch for confirmation before entry

Silver also looking good from HereThis is the only time frame where I am watching silver as on now (On Monthly )
Chart is self explanatory, All we need a break above 35 , closing above this level can start a much awaited bull run on silver from here.
and if we see good momentum from silver , gold also goig to follow the same in short term to mid term basis.

Silver still upmove will continue avoid any sell trade How to take trades using Harmonic pattern projection Trade setup is explained below :-
Entry : 1st SL point : 0% is recent top or bottom.
Trailing D: 15.1% is work as trailing SL of buy or sell trade if hit then we have to book profit
.If price goes below 2nd D 22.5% to 24.5% range then early traders can make fresh reversals trade after breaking 1st D 15.1% safe traders can reversal trade after breaking Point D 22.5.4% to 24.5% range
Targets :
Target T1 : 36.1% to 38.3%
Target T3 : 49.1% to 52.5%
T3: 60.9% to 64.8% is our 3rd Target since this is reversal zone so must book profit if break then take fresh trade again
Target T4 : 76.4% to 79.7%
Next Targets are 100% , 127.2% ,141.4% and final Target 161.8%.
How to take reversal trade :
If price going upside/ downside then then buy or sell levels appear on Chart ( Automatically show when price reach any reversal zone of harmonic projection ).
Trailing SL:
After reach 1st Target trail SL to just above or below cost ( for example we are holding sell trade from 100 1st Target 110 hit then move trailing sl to 104-105 and move SL as price move upside or Downside)
Re- Entry :
For Re-entry in any pull back Point D ( 15.1% ) is used for re-entry then SL recent high or low Point SL ( 0% ) .
Blue Line is 1st support/ Resistance
Green line is 2nd support/ resistance
Red line is 3rd Support/ resistance

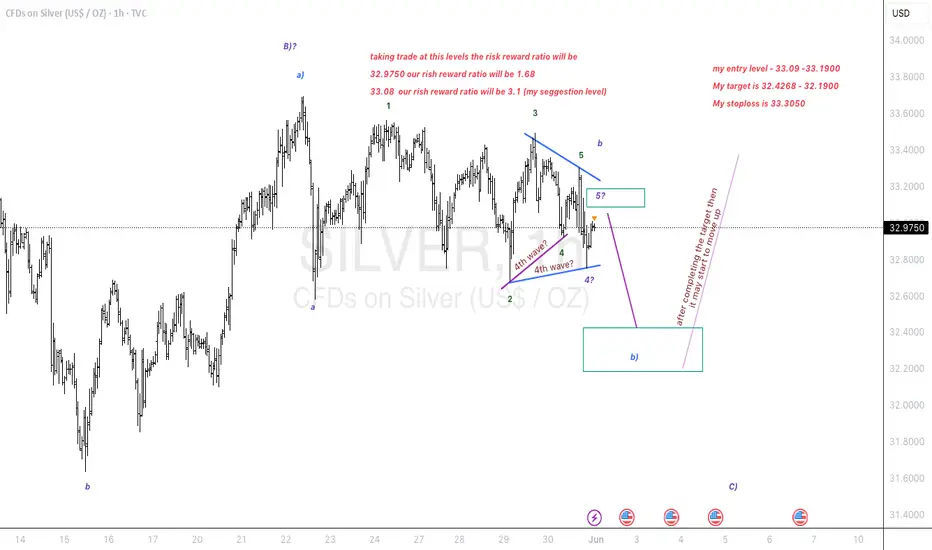
Triangle breakout in silver. Down to earth..
Elliott Wave Analysis:-
1st possibility:- (look Previous chart published)
Silver is in a triangle breakout. if it is getting towards upside breakout then we have a nice opportunity of pullback and and we can add it if the pullback occurs. else we can enjoy this journey quietly.
2nd possibility:-
Silver had already made a pullback towards down side breakout. Once it start the way it will fly towards downside and then it will complete a C wave in whole B wave then upside C wave will be impulsive.
My Entry, Stop, Target all have been discussed.
My suggestion to take a trade at this place to reduce the risk better reward.
I just spoke what chart whisper's in my ear.
I am not a SEBI registered advisor. Before taking a trade do your own analysis or consult a financial advisor. I share chart for education purpose only. I share my trade setup.
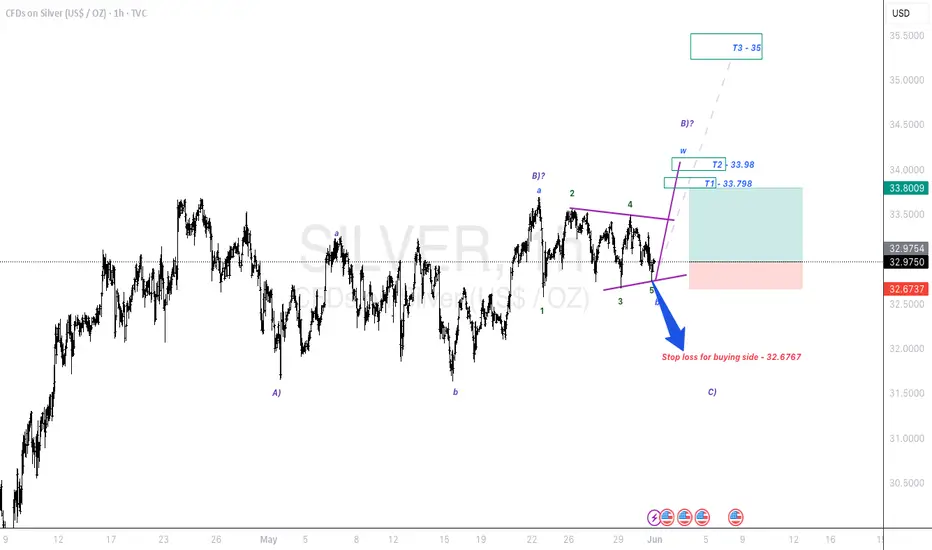
silver in triangle breakout. Two possibilities. one is impulisveElliott Wave Analysis:-
1st possibility:-
Silver is in a triangle breakout . if it is getting towards upside breakout then we have a nice opportunity of pullback and and we can add it if the pullback occurs. else we can enjoy this journey quietly.
2nd possibility:-
Silver had already made a pullback towards down side breakout. Once it start the way it will fly towards downside and then it will complete a C wave in whole B wave then upside C wave will be impulsive.
This type 2 will be discussed in next chart. I will post it as seperately chart for clear understanding .
I am not a SEBI registered advisor. Before taking a trade do your own analysis or consult a financial advisor. I share chart for education purpose only. I share my trade setup.
The short term looks fantasticAfter the extreme squeeze the Silver price is stuck in a range
That range can break on the upside once the Fib range breakout above the shown zone happens
I have drawn a reverse Fib from the recent high to low that happened over just 3 days.
Overall, TVC:SILVER looks great in the Short term, medium term and long term.

Will Silver break out in rounding bottom after 13 years..?Silver is consolidate since quite sometime with resistance at 34.50-34.90 level. Today it has shown some good strength and if it’s able to cross and sustain above 34.90-35.00 then it’s open to SKY and has potential for 50%+ gain. Keep an eyes.
XAG/USD 1;85 RR TRADEThis trade went out of my league. I was targeting for a 1;15 RR but god gave me more than that.
Market is supreme & everything is possible in it.

Silver EW updateSilver update
Patternfrom 31.66 low to top looks like ABC, A is ending at 32.72 and b is around 31.90, and C wave is a impulsive 5 wave pattern clearly visible,
reason behind considering it ABC are 1-This ABCmove has an extention of161.8%, 2- after completion of C, it has retraced more than 50 % which made me consider it as ABC, another question might be raised as it can be LD, but as per rules of LD,LD can't have a 3rd wave touching or breaking 161.8%, so left with only choice of considering it as ABC,
Considering ABC means price will be coming down in upcoming days.
Lets see what unfolds in upcoming days.
