Precision Pays Off: Analysis Hit Again! Another Win🎯 Analysis On Point Again!
My recent analysis played out exactly as expected. 📉📈 Those who followed my instructions not only gained profits but also improved their trading knowledge and decision-making skills.
Success in trading isn't just about luck — it's about learning to read the market with precision and discipline. 📚💡
To those who’ve been riding along — congratulations on your gains! 🥂 And to the new followers, stay tuned. The next winning setups are just around the corner.
Let’s grow, learn, and earn — together. 🚀💸
SILVERMINICFD trade ideas

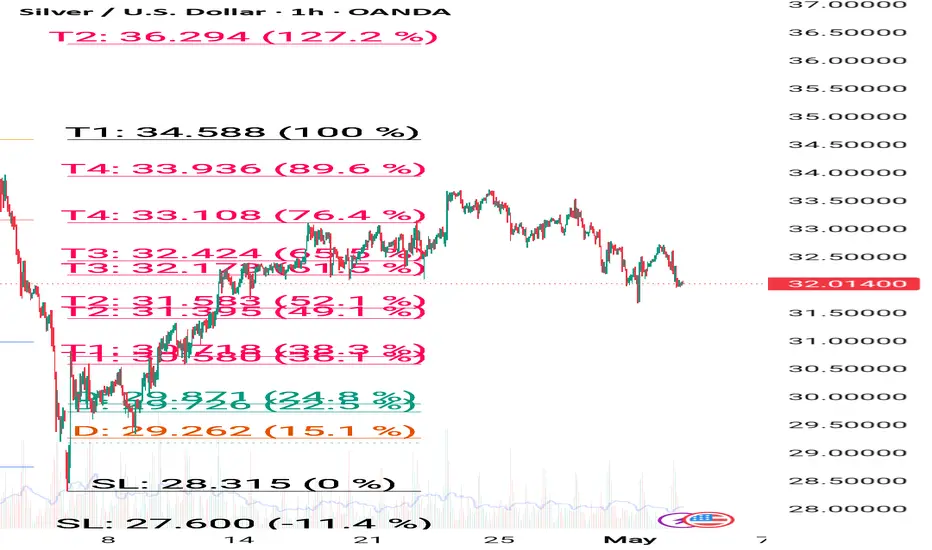
Silver as said earlier fall possible buy near 94500How to take trades using Harmonic pattern projection Trade setup is explained below :-
Entry : 1st SL point : 0% is recent top or bottom.
Trailing D: 15.1% is work as trailing SL of buy or sell trade if hit then we have to book profit
.If price goes below 2nd D 22.5% to 24.5% range then early traders can make fresh reversals trade after breaking 1st D 15.1% safe traders can reversal trade after breaking Point D 22.5.4% to 24.5% range
Targets :
Target T1 : 36.1% to 38.3%
Target T3 : 49.1% to 52.5%
T3: 60.9% to 64.8% is our 3rd Target since this is reversal zone so must book profit if break then take fresh trade again
Target T4 : 76.4% to 79.7%
Next Targets are 100% , 127.2% ,141.4% and final Target 161.8%.
How to take reversal trade :
If price going upside/ downside then then buy or sell levels appear on Chart ( Automatically show when price reach any reversal zone of harmonic projection ).
Trailing SL:
After reach 1st Target trail SL to just above or below cost ( for example we are holding sell trade from 100 1st Target 110 hit then move trailing sl to 104-105 and move SL as price move upside or Downside)
Re- Entry :
For Re-entry in any pull back Point D ( 15.1% ) is used for re-entry then SL recent high or low Point SL ( 0% ) .
Blue Line is 1st support/ Resistance
Green line is 2nd support/ resistance
Red line is 3rd Support/ resistance

Silver also falling as said on Friday 97500-94000 rangeHow to take trades using Harmonic pattern projection Trade setup is explained below :-
Entry : 1st SL point : 0% is recent top or bottom.
Trailing D: 15.1% is work as trailing SL of buy or sell trade if hit then we have to book profit
.If price goes below 2nd D 22.5% to 24.5% range then early traders can make fresh reversals trade after breaking 1st D 15.1% safe traders can reversal trade after breaking Point D 22.5.4% to 24.5% range
Targets :
Target T1 : 36.1% to 38.3%
Target T3 : 49.1% to 52.5%
T3: 60.9% to 64.8% is our 3rd Target since this is reversal zone so must book profit if break then take fresh trade again
Target T4 : 76.4% to 79.7%
Next Targets are 100% , 127.2% ,141.4% and final Target 161.8%.
How to take reversal trade :
If price going upside/ downside then then buy or sell levels appear on Chart ( Automatically show when price reach any reversal zone of harmonic projection ).
Trailing SL:
After reach 1st Target trail SL to just above or below cost ( for example we are holding sell trade from 100 1st Target 110 hit then move trailing sl to 104-105 and move SL as price move upside or Downside)
Re- Entry :
For Re-entry in any pull back Point D ( 15.1% ) is used for re-entry then SL recent high or low Point SL ( 0% ) .
Blue Line is 1st support/ Resistance
Green line is 2nd support/ resistance
Red line is 3rd Support/ resistance

XAG/USD Rejection Looming at Key Resistance – Bearish Reversal A🔍 Chart Analysis – XAG/USD
1. Trend & EMAs:
The chart shows two key exponential moving averages:
📈 EMA 50 (Red): 33.1940
📉 EMA 200 (Blue): 32.8684
Price is currently above both EMAs, indicating a short-term bullish trend, but a possible bearish rejection is forming near resistance.
2. Key Zones:
🟥 Resistance Zone: 33.45 – 33.60
Price has repeatedly tested this zone and reversed, suggesting strong selling pressure.
Multiple wicks into this zone show buyer exhaustion.
🟩 Support Zone: 32.60 – 32.85
Strong demand observed here with consistent bounces.
The EMA 200 also aligns with this support, reinforcing its strength.
3. Price Behavior & Pattern:
🧱 Repetitive Bearish Drops: Marked by blue rectangles, suggesting a pattern of sharp sell-offs after touching resistance.
🔁 Potential Double Top Pattern forming near the resistance zone, a classic bearish reversal signal.
🧭 The projected path suggests:
A short-term retest of the resistance.
Followed by a pullback toward the support zone around 32.60.
Breakdown below support could open further downside potential.
📌 Summary:
⚠️ Short-Term Outlook: Bearish bias if resistance holds.
📍 Key Level to Watch: 33.60 (breakout) and 32.60 (breakdown).
🔄 Trade Plan:
Consider short entries near 33.45–33.60 resistance zone with stops above 33.65.
Target around 32.65–32.60 support zone.
📊 Indicators in Play:
EMA confluence supports trend analysis.
Price structure and rejection patterns suggest likely mean reversion to support.

Silver strong avoid any sell trade buy near support How to take trades using Harmonic pattern projection Trade setup is explained below :-
Entry : 1st SL point : 0% is recent top or bottom.
Trailing D: 15.1% is work as trailing SL of buy or sell trade if hit then we have to book profit
.If price goes below 2nd D 22.5% to 24.5% range then early traders can make fresh reversals trade after breaking 1st D 15.1% safe traders can reversal trade after breaking Point D 22.5.4% to 24.5% range
Targets :
Target T1 : 36.1% to 38.3%
Target T3 : 49.1% to 52.5%
T3: 60.9% to 64.8% is our 3rd Target since this is reversal zone so must book profit if break then take fresh trade again
Target T4 : 76.4% to 79.7%
Next Targets are 100% , 127.2% ,141.4% and final Target 161.8%.
How to take reversal trade :
If price going upside/ downside then then buy or sell levels appear on Chart ( Automatically show when price reach any reversal zone of harmonic projection ).
Trailing SL:
After reach 1st Target trail SL to just above or below cost ( for example we are holding sell trade from 100 1st Target 110 hit then move trailing sl to 104-105 and move SL as price move upside or Downside)
Re- Entry :
For Re-entry in any pull back Point D ( 15.1% ) is used for re-entry then SL recent high or low Point SL ( 0% ) .
Blue Line is 1st support/ Resistance
Green line is 2nd support/ resistance
Red line is 3rd Support/ resistance

Silver comex updated levels buy on dip near support How to take trades using Harmonic pattern projection Trade setup is explained below :-
Entry : 1st SL point : 0% is recent top or bottom.
Trailing D: 15.1% is work as trailing SL of buy or sell trade if hit then we have to book profit
.If price goes below 2nd D 22.5% to 24.5% range then early traders can make fresh reversals trade after breaking 1st D 15.1% safe traders can reversal trade after breaking Point D 22.5.4% to 24.5% range
Targets :
Target T1 : 36.1% to 38.3%
Target T3 : 49.1% to 52.5%
T3: 60.9% to 64.8% is our 3rd Target since this is reversal zone so must book profit if break then take fresh trade again
Target T4 : 76.4% to 79.7%
Next Targets are 100% , 127.2% ,141.4% and final Target 161.8%.
How to take reversal trade :
If price going upside/ downside then then buy or sell levels appear on Chart ( Automatically show when price reach any reversal zone of harmonic projection ).
Trailing SL:
After reach 1st Target trail SL to just above or below cost ( for example we are holding sell trade from 100 1st Target 110 hit then move trailing sl to 104-105 and move SL as price move upside or Downside)
Re- Entry :
For Re-entry in any pull back Point D ( 15.1% ) is used for re-entry then SL recent high or low Point SL ( 0% ) .
Blue Line is 1st support/ Resistance
Green line is 2nd support/ resistance
Red line is 3rd Support/ resistance

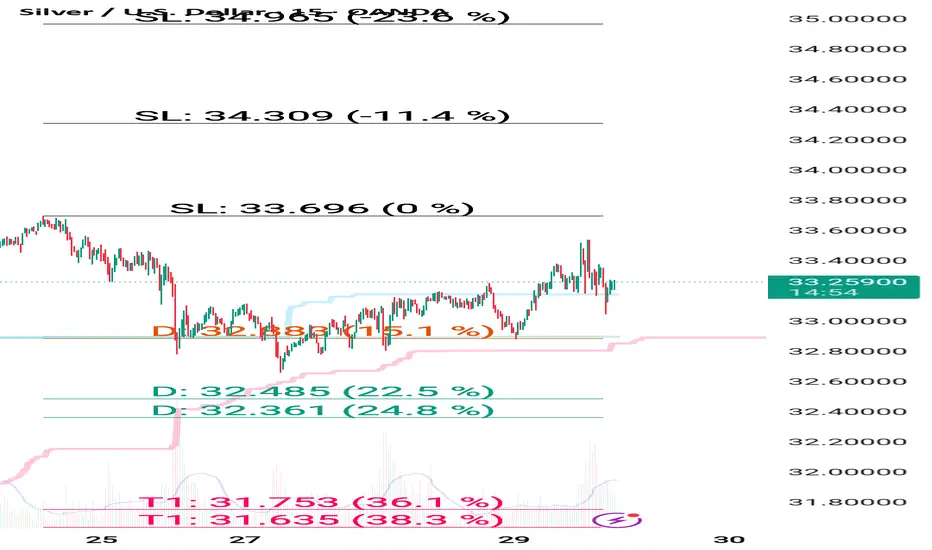
Silver comex weekly levels buy near support sell near resistanceHow to take trades using Harmonic pattern projection Trade setup is explained below :-
Entry : 1st SL point : 0% is recent top or bottom.
Trailing D: 15.1% is work as trailing SL of buy or sell trade if hit then we have to book profit
.If price goes below 2nd D 22.5% to 24.5% range then early traders can make fresh reversals trade after breaking 1st D 15.1% safe traders can reversal trade after breaking Point D 22.5.4% to 24.5% range
Targets :
Target T1 : 36.1% to 38.3%
Target T3 : 49.1% to 52.5%
T3: 60.9% to 64.8% is our 3rd Target since this is reversal zone so must book profit if break then take fresh trade again
Target T4 : 76.4% to 79.7%
Next Targets are 100% , 127.2% ,141.4% and final Target 161.8%.
How to take reversal trade :
If price going upside/ downside then then buy or sell levels appear on Chart ( Automatically show when price reach any reversal zone of harmonic projection ).
Trailing SL:
After reach 1st Target trail SL to just above or below cost ( for example we are holding sell trade from 100 1st Target 110 hit then move trailing sl to 104-105 and move SL as price move upside or Downside)
Re- Entry :
For Re-entry in any pull back Point D ( 15.1% ) is used for re-entry then SL recent high or low Point SL ( 0% ) .
Blue Line is 1st support/ Resistance
Green line is 2nd support/ resistance
Red line is 3rd Support/ resistance

Silver’s Shiny Coil: Why XAG / USD Looks Poised for a Break-HighMarkets have a knack for testing our patience. Silver (XAG / USD) has been no exception—oscillating between euphoria and despair for the better part of a year—yet, beneath the noise, the metal is quietly assembling a bullish springboard. Grab a coffee and walk with me through the daily chart to see why the odds favor another run into the mid-$30s.
1. Big-Picture Pulse: A Bull Above Its Lifeline
The first thing my eyes lock onto is the 200-day simple moving average (SMA). It’s rising, and price has respected it since late-March 2024. Think of that SMA as silver’s life-support line: trade above it and the market is healthy; fall beneath it and the patient is suddenly critical. Today, the 200-day sits at $31.35—a level price kissed only days ago before bouncing. Score one for the bulls.
2. Mapping the Battlefield: Support and Resistance Zones
Charts are stories told in shades of supply (where sellers lurk) and demand (where buyers ambush). On this chart those zones are color-coded:
Zone Price Band Storyline
Green #1 $30.9 – $31.7 Last month’s accumulation shelf, perfectly overlapped by the 200-day SMA. The market’s “do-not-break” level.
Green #2 $28.9 – $29.8 March breakout base—our parachute if the first shelf fails.
Green #3 $25.8 – $26.8 2023–24 launchpad; relevant only if the trend truly unravels.
Red $34.8 – $36.0 2021 swing-high cluster. History says sellers take profit here.
These bands aren’t just pretty rectangles. They are where the emotional tug-of-war is won or lost.
3. The Coil: Price Action Whispers
Zoom in on the most recent candles: three consecutive higher lows and shrinking daily ranges. That’s a coil—energy compressing like a spring on top of the blue horizontal line at $31.7. Coils don’t last; they explode. Because this one sits above major support, probability tilts toward an upward pop.
A bonus clue: the Supertrend (10,2) indicator is still printed in green. It flips red only on a close below $31.5, telling us momentum remains on the buy side.
4. Turning Insight into a Trade
No analysis is complete without answering, “So what?” Here’s a swing setup that converts the chart narrative into numbers:
Element Level Why There
Entry $32.20 – $32.40 We’re stepping in while price coils—close to support, far from resistance.
Stop-loss $30.95 Below Green #1 and the 200-day. If we’re wrong, get out fast.
Target 1 $34.80 Bottom edge of the red supply zone—the first logical cash-out.
Target 2 $35.90 Top of that zone and 2021’s high-water mark.
Risk: $1.35 per ounce
Reward to T1: $2.50 → ~1 : 1.9
Reward to T2: $3.60 → ~1 : 2.7
Those are odds any trader can live with.
5. Trade Management—Because Markets Improvise
Daily close audit – A settle beneath the 200-day and a red Supertrend is a cue to exit, no questions asked.
Scale and trail – Bank half at $34.8, slide the stop to breakeven, and let the rest hunt $35.9.
Time stop – Ten sleepy sessions under $33.2? Close it. Opportunities shouldn’t loiter.


xagusd silver selling view Note: all shared views are based on educational purpose only. i am not sebi registered

Silver will fall less and go more upside compared to gold How to take trades using Harmonic pattern projection Trade setup is explained below :-
Entry : 1st SL point : 0% is recent top or bottom.
Trailing D: 15.1% is work as trailing SL of buy or sell trade if hit then we have to book profit
.If price goes below 2nd D 22.5% to 24.5% range then early traders can make fresh reversals trade after breaking 1st D 15.1% safe traders can reversal trade after breaking Point D 22.5.4% to 24.5% range
Targets :
Target T1 : 36.1% to 38.3%
Target T3 : 49.1% to 52.5%
T3: 60.9% to 64.8% is our 3rd Target since this is reversal zone so must book profit if break then take fresh trade again
Target T4 : 76.4% to 79.7%
Next Targets are 100% , 127.2% ,141.4% and final Target 161.8%.
How to take reversal trade :
If price going upside/ downside then then buy or sell levels appear on Chart ( Automatically show when price reach any reversal zone of harmonic projection ).
Trailing SL:
After reach 1st Target trail SL to just above or below cost ( for example we are holding sell trade from 100 1st Target 110 hit then move trailing sl to 104-105 and move SL as price move upside or Downside)
Re- Entry :
For Re-entry in any pull back Point D ( 15.1% ) is used for re-entry then SL recent high or low Point SL ( 0% ) .
Blue Line is 1st support/ Resistance
Green line is 2nd support/ resistance
Red line is 3rd Support/ resistance

Silver sel on rise given on Sunday enjoy huge profit How to take trades using Harmonic pattern projection Trade setup is explained below :-
Entry : 1st SL point : 0% is recent top or bottom.
Trailing D: 15.1% is work as trailing SL of buy or sell trade if hit then we have to book profit
.If price goes below 2nd D 22.5% to 24.5% range then early traders can make fresh reversals trade after breaking 1st D 15.1% safe traders can reversal trade after breaking Point D 22.5.4% to 24.5% range
Targets :
Target T1 : 36.1% to 38.3%
Target T3 : 49.1% to 52.5%
T3: 60.9% to 64.8% is our 3rd Target since this is reversal zone so must book profit if break then take fresh trade again
Target T4 : 76.4% to 79.7%
Next Targets are 100% , 127.2% ,141.4% and final Target 161.8%.
How to take reversal trade :
If price going upside/ downside then then buy or sell levels appear on Chart ( Automatically show when price reach any reversal zone of harmonic projection ).
Trailing SL:
After reach 1st Target trail SL to just above or below cost ( for example we are holding sell trade from 100 1st Target 110 hit then move trailing sl to 104-105 and move SL as price move upside or Downside)
Re- Entry :
For Re-entry in any pull back Point D ( 15.1% ) is used for re-entry then SL recent high or low Point SL ( 0% ) .
Blue Line is 1st support/ Resistance
Green line is 2nd support/ resistance
Red line is 3rd Support/ resistance

Sell silver at 32.60 near fall will come after fed meeting How to take trades using Harmonic pattern projection Trade setup is explained below :-
Entry : 1st SL point : 0% is recent top or bottom.
Trailing D: 15.1% is work as trailing SL of buy or sell trade if hit then we have to book profit
.If price goes below 2nd D 22.5% to 24.5% range then early traders can make fresh reversals trade after breaking 1st D 15.1% safe traders can reversal trade after breaking Point D 22.5.4% to 24.5% range
Targets :
Target T1 : 36.1% to 38.3%
Target T3 : 49.1% to 52.5%
T3: 60.9% to 64.8% is our 3rd Target since this is reversal zone so must book profit if break then take fresh trade again
Target T4 : 76.4% to 79.7%
Next Targets are 100% , 127.2% ,141.4% and final Target 161.8%.
How to take reversal trade :
If price going upside/ downside then then buy or sell levels appear on Chart ( Automatically show when price reach any reversal zone of harmonic projection ).
Trailing SL:
After reach 1st Target trail SL to just above or below cost ( for example we are holding sell trade from 100 1st Target 110 hit then move trailing sl to 104-105 and move SL as price move upside or Downside)
Re- Entry :
For Re-entry in any pull back Point D ( 15.1% ) is used for re-entry then SL recent high or low Point SL ( 0% ) .
Blue Line is 1st support/ Resistance
Green line is 2nd support/ resistance
Red line is 3rd Support/ resistance

"Silver – Bearish Move Toward Support"🧠 Market Overview:
Instrument: Likely Silver (based on file name).
Chart Context: The price is currently trading below both the 50 EMA (red) and 200 EMA (blue), indicating bearish momentum and a possible shift in market structure.
📊 Key Technical Components:
🔹 Exponential Moving Averages (EMA):
50 EMA (32.614) is above the 200 EMA (32.526) but both are above the current price.
This crossover is recent and could indicate the beginning of a larger downtrend if confirmed by continued price action below both EMAs.
🔹 Market Structure:
POI (Point of Interest) marks a previous swing high where selling pressure emerged.
The chart shows internal liquidity (INT.LQ) sweeps both above and below consolidation areas, hinting at smart money manipulation to grab liquidity before making a move.
🔹 Resistance Zone:
Clearly defined between approx. 33.4–34.0, where price was rejected after a failed attempt to break higher.
Multiple rejections from this zone show strong selling pressure.
🔹 Support Zone:
Sitting between approx. 30.8–31.2.
Price previously consolidated here before a bullish move, making it a likely target for a return test or a potential bounce.
📉 Bearish Scenario & Projection:
The price broke below a short-term structure and failed to hold above EMAs.
The current price action shows a bearish pullback likely to form a Lower High (LH).
The projected path shows a pullback to previous support-turned-resistance, followed by a breakdown targeting the support zone.
✅ Bias:
Short-term bias: Bearish
Medium-term bias: Bearish, unless price reclaims the 200 EMA and consolidates above the resistance zone.
🔍 Confluences Supporting Bearish Outlook:
Price below EMAs (dynamic resistance).
Failed higher highs with liquidity sweeps (indicating smart money selling).
Clear market structure shift to the downside.
Anticipated retest of support zone around 30.8–31.2.

Silver still on uptrend in positional trade buy dip newr supportHow to take trades using Harmonic pattern projection Trade setup is explained below :-
Entry : 1st SL point : 0% is recent top or bottom.
Trailing D: 15.1% is work as trailing SL of buy or sell trade if hit then we have to book profit
.If price goes below 2nd D 22.5% to 24.5% range then early traders can make fresh reversals trade after breaking 1st D 15.1% safe traders can reversal trade after breaking Point D 22.5.4% to 24.5% range
Targets :
Target T1 : 36.1% to 38.3%
Target T3 : 49.1% to 52.5%
T3: 60.9% to 64.8% is our 3rd Target since this is reversal zone so must book profit if break then take fresh trade again
Target T4 : 76.4% to 79.7%
Next Targets are 100% , 127.2% ,141.4% and final Target 161.8%.
How to take reversal trade :
If price going upside/ downside then then buy or sell levels appear on Chart ( Automatically show when price reach any reversal zone of harmonic projection ).
Trailing SL:
After reach 1st Target trail SL to just above or below cost ( for example we are holding sell trade from 100 1st Target 110 hit then move trailing sl to 104-105 and move SL as price move upside or Downside)
Re- Entry :
For Re-entry in any pull back Point D ( 15.1% ) is used for re-entry then SL recent high or low Point SL ( 0% ) .
Blue Line is 1st support/ Resistance
Green line is 2nd support/ resistance
Red line is 3rd Support/ resistance
XAGUSDPrice has reacted from the Inverse.
Moved into the discount of 1st 20 days of Q2.
Expecting good Bullish Rally.

Silver (XAG/USD) Falling Wedge Breakout –Bullish Setup Targeting📉 Pattern: Falling Wedge
🔵 Price was consolidating inside a falling wedge (🔽), which is typically a bullish reversal pattern.
🟡 Multiple touchpoints along the trendline confirm the structure.
Support Zone: 🔵
Area: 31.95 – 32.10
✅ Price tapped into this strong demand zone
🔥 Big bullish wick shows rejection – buyers stepping in!
EMA 70: 🔴
🧭 Acting as a potential dynamic resistance at 33.04
Watch for a clean breakout above it to confirm momentum.
Trade Setup:
Entry: ✅ Current area (~32.44) looks like a good long entry after bounce.
Stop Loss: ❌ Below 31.95 (under the blue zone)
Target: 🎯 33.68510 (Previous high)
📈 Huge upside potential if wedge breakout confirms!
Summary:
📉 Pattern: Falling Wedge
🔵 Strong Support Zone
✅ Bullish Rejection
🎯 Target: 33.68
❌ Stop Loss: Below 31.95
⚠️ Watch EMA 70 for resistance
🟢 Bias: Bullish – looking for breakout!

As expected silver still on uptrend will try to break rect highHow to take trades using Harmonic pattern projection Trade setup is explained below :-
Entry : 1st SL point : 0% is recent top or bottom.
Trailing D: 15.1% is work as trailing SL of buy or sell trade if hit then we have to book profit
.If price goes below 2nd D 22.5% to 24.5% range then early traders can make fresh reversals trade after breaking 1st D 15.1% safe traders can reversal trade after breaking Point D 22.5.4% to 24.5% range
Targets :
Target T1 : 36.1% to 38.3%
Target T3 : 49.1% to 52.5%
T3: 60.9% to 64.8% is our 3rd Target since this is reversal zone so must book profit if break then take fresh trade again
Target T4 : 76.4% to 79.7%
Next Targets are 100% , 127.2% ,141.4% and final Target 161.8%.
How to take reversal trade :
If price going upside/ downside then then buy or sell levels appear on Chart ( Automatically show when price reach any reversal zone of harmonic projection ).
Trailing SL:
After reach 1st Target trail SL to just above or below cost ( for example we are holding sell trade from 100 1st Target 110 hit then move trailing sl to 104-105 and move SL as price move upside or Downside)
Re- Entry :
For Re-entry in any pull back Point D ( 15.1% ) is used for re-entry then SL recent high or low Point SL ( 0% ) .
Blue Line is 1st support/ Resistance
Green line is 2nd support/ resistance
Red line is 3rd Support/ resistance
SILVER XAGUSD- BULLISH FROM HERE FOR A TARGET OF $ 43-44The Price is in a nice Flat correction in its wave 4 . Wave 3 has reached 1.618 Fib level. It looks like a Flat correction and we are headed to $ 43 level from here

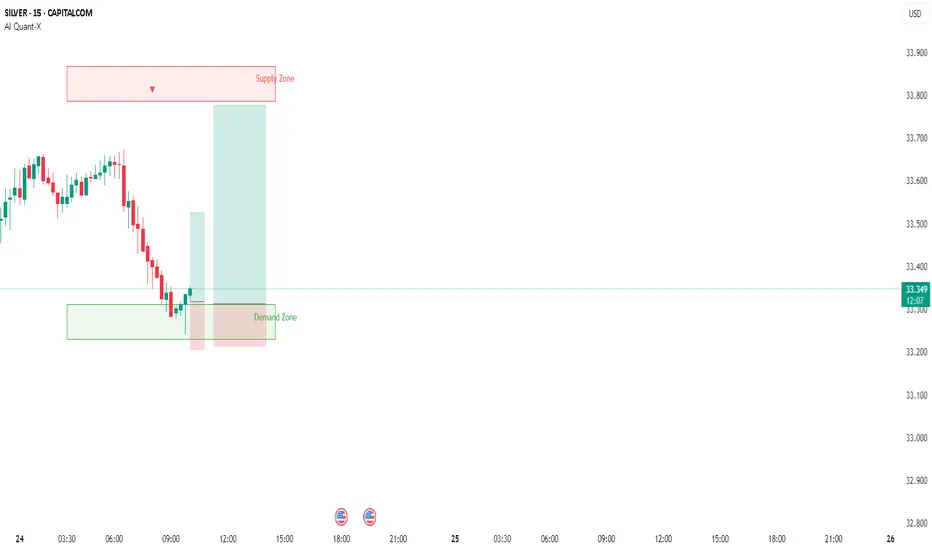
Going long in SilverSilver taking support of Demand Zone . SL below the zone target 1 and taregt 2 supply zone marked on chart .
Reason for trade price has taken rejection on Demand Zone .
XAG/USD sell below 32$ buy above 33 $ levels given on chart How to take trades using Harmonic pattern projection Trade setup is explained below :-
Entry : 1st SL point : 0% is recent top or bottom.
Trailing D: 11.4% is work as trailing SL of buy or sell trade if hit then we have to book profit
.If price goes below 2nd D 21.4% to 23.6% range then early traders can make fresh reversals trade after breaking 1st D 11.4% safe traders can reversal trade after breaking Point D 21.4% to 23.6% range
Targets :
Target T1 : 35.1% to 38.3%
Target T3 : 49.1% to 53.2%
T3: 60.9% to 64.8% is our 3rd Target since this is reversal zone so must book profit if break then take fresh trade again
Target T4 : 76.4% to 79.7%
Next Targets are 100% , 127.2% ,141.4% and final Target 161.8%.
How to take reversal trade :
If price going upside/ downside then then buy or sell levels appear on Chart ( Automatically show when price reach any reversal zone of harmonic projection pattern based .
After showing reversal levels wait for confirmation until 21.4% or 28.3 % level not break if break then exit from current buy / sell trade and take fresh reverse trade buy/ sell .
Trailing SL:
After reach 1st Target trail SL to just above or below cost ( for example we are holding sell trade from 100 1st Target 110 hit then move trailing sl to 104-105 and move SL as price move upside or Downside)
Re- Entry :
For Re-entry in any pull back Point D ( 11.4% ) is used for re-entry then SL recent high or low Point SL ( 0% ) .
Blue Line is 1st support/ Resistance
Green line is 2nd support/ resistance
Red line is 3rd Support/ resistance

"Silver Short Setup: Supply Zone Rejection &Targeting Major SptChart Analysis for Silver/USD (XAG/USD) 🪙
🔵 Entry Point: 32.64870
📍This is where the trade is planned to start (short/sell).
🧲 Price is approaching this level again — watch for rejection.
🟥 Supply Zone: 32.65 - 33.16
⚠️ “SuPly Zone!” — Area of potential selling pressure.
🧱 Price previously reversed here, so it's a key resistance.
👀 Wait for bearish confirmation before entering.
❌ Stop Loss: 33.16322
🚨 Risk control: If price hits this level, the setup is invalid.
📈 If price breaks above, it could go higher — time to exit.
🎯 Target Point: 30.58219
🪂 The take profit zone — aim here!
🧊 It’s a previous support level where price might bounce.
📉 Trade Direction: SHORT (SELL)
🧾 Entry: 32.64870
🛑 Stop Loss: 33.16322
✅ Target: 30.58219
⚖️ Risk/Reward: ~1:4
🔻 Potential Move: -6.16%
📊 Trend & Indicators
🟠 Price recently moved up, now facing resistance.
🟢 EMA (7) is being tested — may act as dynamic resistance.
🔄 Several swing highs/lows marked with yellow dots — helps visualize market structure.
What to Watch For:
🔎 Bearish candlestick patterns inside the supply zone.
🧨 Sharp rejection or wick candles = good entry signal.
⏱️ Patience is key — let the setup come to you.

Silver XAG/USD support and resistance levels How to take trades using Harmonic pattern projection Trade setup is explained below :-
Entry : 1st SL point : 0% is recent top or bottom.
Trailing D: 11.4% is work as trailing SL of buy or sell trade if hit then we have to book profit
.If price goes below 2nd D 21.4% to 23.6% range then early traders can make fresh reversals trade after breaking 1st D 11.4% safe traders can reversal trade after breaking Point D 21.4% to 23.6% range
Targets :
Target T1 : 35.1% to 38.3%
Target T3 : 49.1% to 53.2%
T3: 60.9% to 64.8% is our 3rd Target since this is reversal zone so must book profit if break then take fresh trade again
Target T4 : 76.4% to 79.7%
Next Targets are 100% , 127.2% ,141.4% and final Target 161.8%.
How to take reversal trade :
If price going upside/ downside then then buy or sell levels appear on Chart ( Automatically show when price reach any reversal zone of harmonic projection pattern based .
After showing reversal levels wait for confirmation until 21.4% or 28.3 % level not break if break then exit from current buy / sell trade and take fresh reverse trade buy/ sell .
Trailing SL:
After reach 1st Target trail SL to just above or below cost ( for example we are holding sell trade from 100 1st Target 110 hit then move trailing sl to 104-105 and move SL as price move upside or Downside)
Re- Entry :
For Re-entry in any pull back Point D ( 11.4% ) is used for re-entry then SL recent high or low Point SL ( 0% ) .
Blue Line is 1st support/ Resistance
Green line is 2nd support/ resistance
Red line is 3rd Support/ resistance
