XAG/USD 4H Weekly Analysis: Silver Aiming for $35.59?Key Observations:
📍 Current Price: $33.724 📉 (-0.07%)
🟢 Support Zones:
H4 Support: 📌 $33.000 🔵
Major Support: 📌 $31.000 🔵 (Highlighted with 🔥⚡ and news icons 📊📅)
🔴 Resistance Levels:
$34.000 Resistance 🛑
Target: 🎯 $35.591 📈
📈 Expected Price Movement:
✅ Bullish Scenario:
The price bounces off the support and pushes past $34.000 🚀
A move towards $35.59 target 📊💰
⚠️ Bearish Scenario:
If price fails to break $34.000, it may drop back to $33.000 or even $31.000 ⬇️🛑
Economic events (📅📉) may cause high volatility
🎯 Final Thought:
Likely bullish movement toward $35.59 if support holds 💹📈
Watch for price action at $34.000 – key level for breakout 🔍⚡
SILVERMINICFD trade ideas

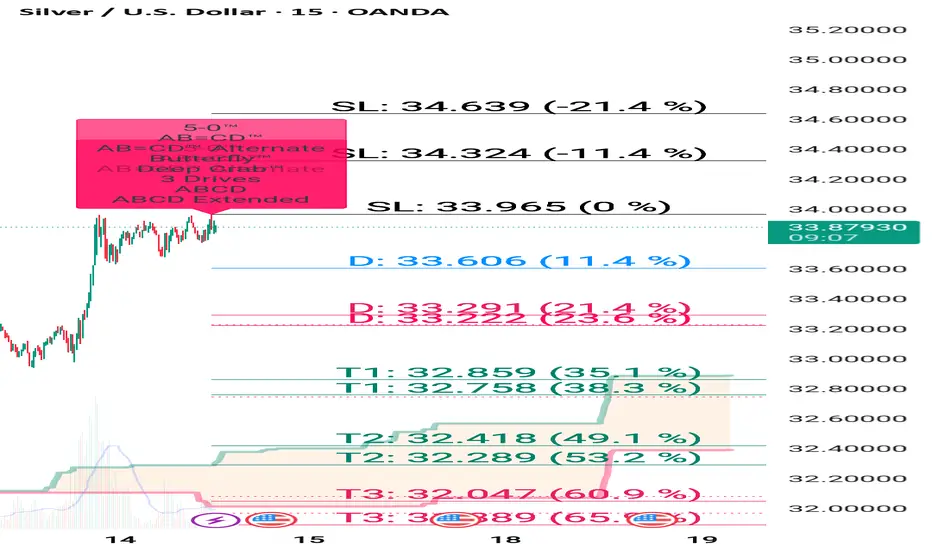
Silver updated levels until 33.20 not break uptrend continue How to take trades using Harmonic pattern projection Trade setup is explained below :-
Entry : 1st SL point : 0% is recent top or bottom.
Trailing D: 11.4% is work as trailing SL of buy or sell trade if hit then we have to book profit
.If price goes below 2nd D 21.4% to 23.6% range then early traders can make fresh reversals trade after breaking 1st D 11.4% safe traders can reversal trade after breaking Point D 21.4% to 23.6% range
Targets :
Target T1 : 35.1% to 38.3%
Target T3 : 49.1% to 53.2%
T3: 60.9% to 64.8% is our 3rd Target since this is reversal zone so must book profit if break then take fresh trade again
Target T4 : 76.4% to 79.7%
Next Targets are 100% , 127.2% ,141.4% and final Target 161.8%.
How to take reversal trade :
If price going upside/ downside then then buy or sell levels appear on Chart ( Automatically show when price reach any reversal zone of harmonic projection pattern based .
After showing reversal levels wait for confirmation until 21.4% or 28.3 % level not break if break then exit from current buy / sell trade and take fresh reverse trade buy/ sell .
Trailing SL:
After reach 1st Target trail SL to just above or below cost ( for example we are holding sell trade from 100 1st Target 110 hit then move trailing sl to 104-105 and move SL as price move upside or Downside)
Re- Entry :
For Re-entry in any pull back Point D ( 11.4% ) is used for re-entry then SL recent high or low Point SL ( 0% ) .
Blue Line is 1st support/ Resistance
Green line is 2nd support/ resistance
Red line is 3rd Support/ resistance

XAG/USD View For Weekend Analysis .Simmply we see the price in 4 H is bullish . If 1H candle close above High of Market as seen in chart after that you can plan long .
or If price reach in red box and after given candlestick confirmation on LFT then You can plan sell up to green box . then from green box plan buys

XAGUSD all set to Outperform US30, Short Term Buy Signal!#XAGUSD #US30
Attached: Daily Ratio Chart as of 31st Jan 2025
BULLISH SETUP
- Breakout from Triangle to start an Impulse Rally for the Ratio meaning Money to shift from US Markets to Precious Metals
- This is Positive for the Price of XAGUSD and Negative for the Price of Dow Jones (or US30)

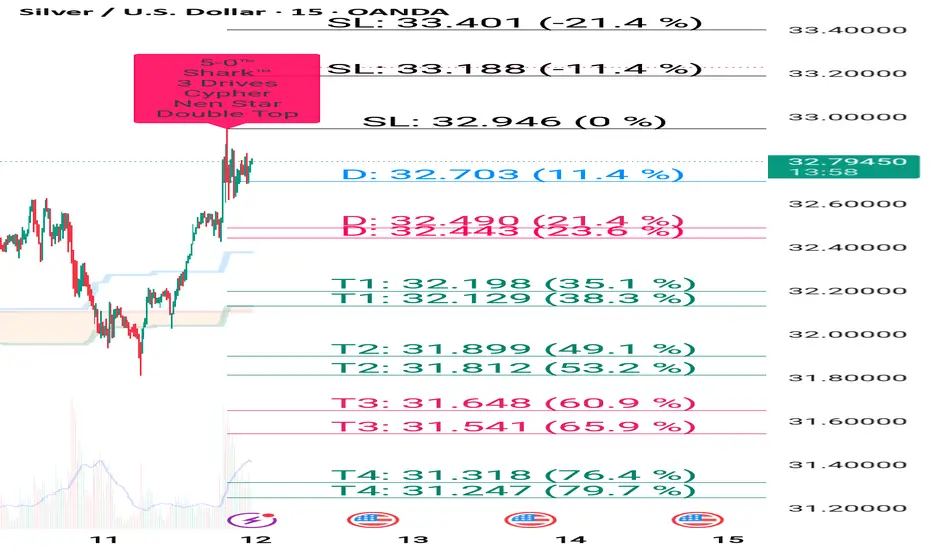
Silver buy given above 32.20 until 33.60 not break will go up How to take trades using Harmonic pattern projection Trade setup is explained below :-
Entry : 1st SL point : 0% is recent top or bottom.
Trailing D: 11.4% is work as trailing SL of buy or sell trade if hit then we have to book profit
.If price goes below 2nd D 21.4% to 23.6% range then early traders can make fresh reversals trade after breaking 1st D 11.4% safe traders can reversal trade after breaking Point D 21.4% to 23.6% range
Targets :
Target T1 : 35.1% to 38.3%
Target T3 : 49.1% to 53.2%
T3: 60.9% to 64.8% is our 3rd Target since this is reversal zone so must book profit if break then take fresh trade again
Target T4 : 76.4% to 79.7%
Next Targets are 100% , 127.2% ,141.4% and final Target 161.8%.
How to take reversal trade :
If price going upside/ downside then then buy or sell levels appear on Chart ( Automatically show when price reach any reversal zone of harmonic projection pattern based .
After showing reversal levels wait for confirmation until 21.4% or 28.3 % level not break if break then exit from current buy / sell trade and take fresh reverse trade buy/ sell .
Trailing SL:
After reach 1st Target trail SL to just above or below cost ( for example we are holding sell trade from 100 1st Target 110 hit then move trailing sl to 104-105 and move SL as price move upside or Downside)
Re- Entry :
For Re-entry in any pull back Point D ( 11.4% ) is used for re-entry then SL recent high or low Point SL ( 0% ) .
Blue Line is 1st support/ Resistance
Green line is 2nd support/ resistance
Red line is 3rd Support/ resistance
xagusd double bottom with divergenceXAGUSD create double bottom with morning diji star with rsi divergence if it goes and susstain above nechline then superb bull run can seen.
buy xagusd above 29.88 add more 29 closing sl below 28.75 tg 31.9-33.78

XAG/USD (Silver) 4H Chart Analysis – Bearish Setup📉 XAG/USD (Silver) 4H Chart Analysis – Bearish Setup 🚨
🔍 Key Observations:
Supply Zone (POI - Point of Interest) 🟪: The price is approaching a strong resistance area around $33.23 - $33.50.
Liquidity Grab (LQ) & Rejection Expected ❌: The previous major liquidity zone (LQ) suggests a possible fake breakout or rejection.
Bearish Projection ⬇️: The chart outlines a potential reversal after reaching resistance, leading to a drop towards $31.00 - $30.50.
📌 Trading Plan:
Short Entry 🎯: Around $33.20 - $33.50 (if price rejects this area).
Target 🎯: Major demand zone at $31.00.
Stop Loss 🚨: Above $33.60 (to avoid fakeouts).
Confirmation Needed 📊: Look for bearish candlestick patterns (e.g., engulfing, wicks, or double top formations).
⚠️ Final Thoughts:
Bearish Bias ⚠️ unless price breaks and holds above $33.50.
Monitor market conditions 🧐—news and fundamentals could shift momentum.
🔥 Trade smart! What do you think?

Silver Following Our Blueprint Perfectly - Latest PA Update Looks like my previous analysis on silver played out exactly as expected! That black arrow path we discussed when silver was trading in the 29-30 zone has materialized beautifully, bringing us to our current price of 32.74.
Current Technical Picture
Silver is giving us some strong bullish signals right now. After testing the immediate support zone at 31.80-32.20 (marked as "Immediate support" on the chart), price has bounced nicely. This area has proven to be reliable support during this recent leg up.
The red horizontal resistance zone around 34.80 is the next major hurdle to overcome. This level caused rejection back in October 2024, so we can expect some selling pressure there initially.
The key correlation right now is with gold. Silver tends to follow gold lead but with amplified moves. If gold manages to break out of its range (as we discussed in the gold analysis today), silver could really take off with an explosive move higher.
The current setup remains bullish as long as price stays above the immediate support zone (31.80-32.20). The risk/reward for longs is quite favorable here, with multiple support levels underneath current price.
The major support at 30 (green horizontal line) looks solid, providing a clear level to manage risk against for longer-term positions.
I'm watching for gold to provide the trigger for silver's next big move. Once gold confirms its direction, silver is likely to follow with even greater percentage moves.
This setup continues to develop exactly as predicted in our previous analysis .

Silver updated levels until 32.35 not break uptrend continue How to take trades using Harmonic pattern projection Trade setup is explained below :-
Entry : 1st SL point : 0% is recent top or bottom.
Trailing D: 11.4% is work as trailing SL of buy or sell trade if hit then we have to book profit
.If price goes below 2nd D 21.4% to 23.6% range then early traders can make fresh reversals trade after breaking 1st D 11.4% safe traders can reversal trade after breaking Point D 21.4% to 23.6% range
Targets :
Target T1 : 35.1% to 38.3%
Target T3 : 49.1% to 53.2%
T3: 60.9% to 64.8% is our 3rd Target since this is reversal zone so must book profit if break then take fresh trade again
Target T4 : 76.4% to 79.7%
Next Targets are 100% , 127.2% ,141.4% and final Target 161.8%.
How to take reversal trade :
If price going upside/ downside then then buy or sell levels appear on Chart ( Automatically show when price reach any reversal zone of harmonic projection pattern based .
After showing reversal levels wait for confirmation until 21.4% or 28.3 % level not break if break then exit from current buy / sell trade and take fresh reverse trade buy/ sell .
Trailing SL:
After reach 1st Target trail SL to just above or below cost ( for example we are holding sell trade from 100 1st Target 110 hit then move trailing sl to 104-105 and move SL as price move upside or Downside)
Re- Entry :
For Re-entry in any pull back Point D ( 11.4% ) is used for re-entry then SL recent high or low Point SL ( 0% ) .
Blue Line is 1st support/ Resistance
Green line is 2nd support/ resistance
Red line is 3rd Support/ resistance
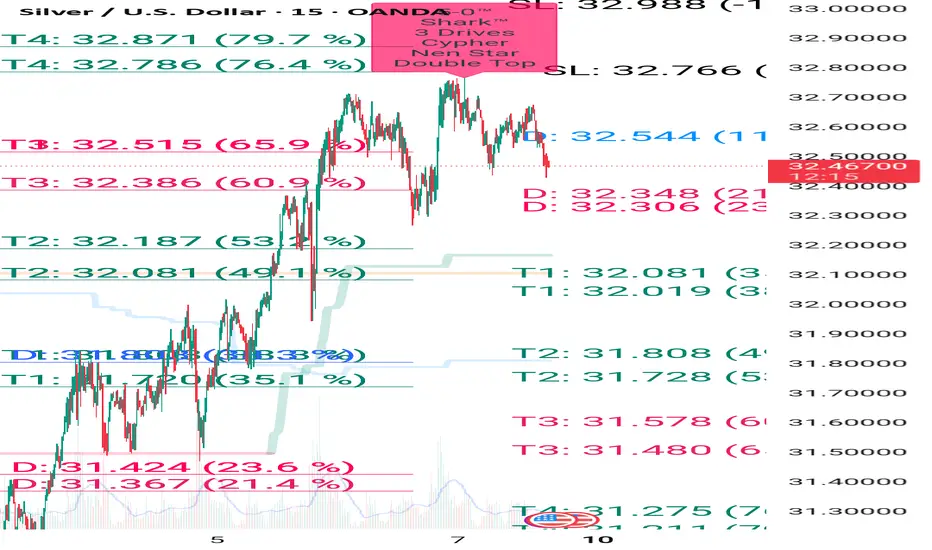
Silver profit booking started avoid buy ,sell below 32.10How to take trades using Harmonic pattern projection Trade setup is explained below :-
Entry : 1st SL point : 0% is recent top or bottom.
Trailing D: 11.4% is work as trailing SL of buy or sell trade if hit then we have to book profit
.If price goes below 2nd D 21.4% to 23.6% range then early traders can make fresh reversals trade after breaking 1st D 11.4% safe traders can reversal trade after breaking Point D 21.4% to 23.6% range
Targets :
Target T1 : 35.1% to 38.3%
Target T3 : 49.1% to 53.2%
T3: 60.9% to 64.8% is our 3rd Target since this is reversal zone so must book profit if break then take fresh trade again
Target T4 : 76.4% to 79.7%
Next Targets are 100% , 127.2% ,141.4% and final Target 161.8%.
How to take reversal trade :
If price going upside/ downside then then buy or sell levels appear on Chart ( Automatically show when price reach any reversal zone of harmonic projection pattern based .
After showing reversal levels wait for confirmation until 21.4% or 28.3 % level not break if break then exit from current buy / sell trade and take fresh reverse trade buy/ sell .
Trailing SL:
After reach 1st Target trail SL to just above or below cost ( for example we are holding sell trade from 100 1st Target 110 hit then move trailing sl to 104-105 and move SL as price move upside or Downside)
Re- Entry :
For Re-entry in any pull back Point D ( 11.4% ) is used for re-entry then SL recent high or low Point SL ( 0% ) .
Blue Line is 1st support/ Resistance
Green line is 2nd support/ resistance
Red line is 3rd Support/ resistance

GOLD SILVER VIEW Our Spot #Gold Range Prediction from 10/03/2025 to 16/03/2025 is as under.
Gold Spot :2838$-2933$
Gold INR : 83700-86500
Our Spot #Silver Range prediction from 10/03/2025 to 16/03/2025 is as under.
Silver Spot: 31.30$-32.91$
Silver INR: 93550-98400
It must be remembered that price of precious metal depends on so many world wide factors like inflation, Fed interest rate, trade barrier, geopolitical tension, demand, supply, bond yield, dollar index , GDP, payroll data, CPI, currency fluctuation, debt ceiling , expected tax & duty changes, other commodity price crude oil etc. etc. and hence there can not be any accurate barometer of predicting precious metal price.
Gold INR has been calculated taking Gold Spot international price and converting the same assuming fixed Indian rupee rate. However, this is not accurate method as change in rupee value to dollar can substantially impact Gold INR price. Pl. note that price of commodity doesn't depend upon performence of company but depend upon performence of world economy, hence it is extremely risky to trade in commodities. Commodities market also become more volatile during contract expiry.
These are not a recommendation for buy or sell. This view is only for educational purpose. You are requested to consult your financial advisor before entering in to any trade.
Last weekend good profit achieved in gold silver

Silver if break 32.30 then sell avoid buying at current price How to take trades using Harmonic pattern projection Trade setup is explained below :-
Entry : 1st SL point : 0% is recent top or bottom.
Trailing D: 11.4% is work as trailing SL of buy or sell trade if hit then we have to book profit
.If price goes below 2nd D 21.4% to 23.6% range then early traders can make fresh reversals trade after breaking 1st D 11.4% safe traders can reversal trade after breaking Point D 21.4% to 23.6% range
Targets :
Target T1 : 35.1% to 38.3%
Target T3 : 49.1% to 53.2%
T3: 60.9% to 64.8% is our 3rd Target since this is reversal zone so must book profit if break then take fresh trade again
Target T4 : 76.4% to 79.7%
Next Targets are 100% , 127.2% ,141.4% and final Target 161.8%.
How to take reversal trade :
If price going upside/ downside then then buy or sell levels appear on Chart ( Automatically show when price reach any reversal zone of harmonic projection pattern based .
After showing reversal levels wait for confirmation until 21.4% or 28.3 % level not break if break then exit from current buy / sell trade and take fresh reverse trade buy/ sell .
Trailing SL:
After reach 1st Target trail SL to just above or below cost ( for example we are holding sell trade from 100 1st Target 110 hit then move trailing sl to 104-105 and move SL as price move upside or Downside)
Re- Entry :
For Re-entry in any pull back Point D ( 11.4% ) is used for re-entry then SL recent high or low Point SL ( 0% ) .
Blue Line is 1st support/ Resistance
Green line is 2nd support/ resistance
Red line is 3rd Support/ resistance

Silver until 32.30 not break upmove will continue buy on dipHow to take trades using Harmonic pattern projection Trade setup is explained below :-
Entry : 1st SL point : 0% is recent top or bottom.
Trailing D: 11.4% is work as trailing SL of buy or sell trade if hit then we have to book profit
.If price goes below 2nd D 21.4% to 23.6% range then early traders can make fresh reversals trade after breaking 1st D 11.4% safe traders can reversal trade after breaking Point D 21.4% to 23.6% range
Targets :
Target T1 : 35.1% to 38.3%
Target T3 : 49.1% to 53.2%
T3: 60.9% to 64.8% is our 3rd Target since this is reversal zone so must book profit if break then take fresh trade again
Target T4 : 76.4% to 79.7%
Next Targets are 100% , 127.2% ,141.4% and final Target 161.8%.
How to take reversal trade :
If price going upside/ downside then then buy or sell levels appear on Chart ( Automatically show when price reach any reversal zone of harmonic projection pattern based .
After showing reversal levels wait for confirmation until 21.4% or 28.3 % level not break if break then exit from current buy / sell trade and take fresh reverse trade buy/ sell .
Trailing SL:
After reach 1st Target trail SL to just above or below cost ( for example we are holding sell trade from 100 1st Target 110 hit then move trailing sl to 104-105 and move SL as price move upside or Downside)
Re- Entry :
For Re-entry in any pull back Point D ( 11.4% ) is used for re-entry then SL recent high or low Point SL ( 0% ) .
Blue Line is 1st support/ Resistance
Green line is 2nd support/ resistance
Red line is 3rd Support/ resistance
Silver comex levels buy on dip still no sell signal appear How to take trades using Harmonic pattern projection Trade setup is explained below :-
Entry : 1st SL point : 0% is recent top or bottom.
Trailing D: 11.4% is work as trailing SL of buy or sell trade if hit then we have to book profit
.If price goes below 2nd D 21.4% to 23.6% range then early traders can make fresh reversals trade after breaking 1st D 11.4% safe traders can reversal trade after breaking Point D 21.4% to 23.6% range
Targets :
Target T1 : 35.1% to 38.3%
Target T3 : 49.1% to 53.2%
T3: 60.9% to 64.8% is our 3rd Target since this is reversal zone so must book profit if break then take fresh trade again
Target T4 : 76.4% to 79.7%
Next Targets are 100% , 127.2% ,141.4% and final Target 161.8%.
How to take reversal trade :
If price going upside/ downside then then buy or sell levels appear on Chart ( Automatically show when price reach any reversal zone of harmonic projection pattern based .
After showing reversal levels wait for confirmation until 21.4% or 28.3 % level not break if break then exit from current buy / sell trade and take fresh reverse trade buy/ sell .
Trailing SL:
After reach 1st Target trail SL to just above or below cost ( for example we are holding sell trade from 100 1st Target 110 hit then move trailing sl to 104-105 and move SL as price move upside or Downside)
Re- Entry :
For Re-entry in any pull back Point D ( 11.4% ) is used for re-entry then SL recent high or low Point SL ( 0% ) .
Blue Line is 1st support/ Resistance
Green line is 2nd support/ resistance
Red line is 3rd Support/ resistance

XAGUSD 20250305forecast silver price H1 - h4 2025 March 5
Road to 36$
Wait and see
NDS + symmetry node

XAGUSD 20250305forecast silver price H1 - h4 2025 March 5
Road to 36$
Wait and see
NDS + symmetry node

Silver buy given above 31 45 , 32$ Target hit buy on dipHow to take trades using Harmonic pattern projection Trade setup is explained below :-
Entry : 1st SL point : 0% is recent top or bottom.
Trailing D: 11.4% is work as trailing SL of buy or sell trade if hit then we have to book profit
.If price goes below 2nd D 21.4% to 23.6% range then early traders can make fresh reversals trade after breaking 1st D 11.4% safe traders can reversal trade after breaking Point D 21.4% to 23.6% range
Targets :
Target T1 : 35.1% to 38.3%
Target T3 : 49.1% to 53.2%
T3: 60.9% to 64.8% is our 3rd Target since this is reversal zone so must book profit if break then take fresh trade again
Target T4 : 76.4% to 79.7%
Next Targets are 100% , 127.2% ,141.4% and final Target 161.8%.
How to take reversal trade :
If price going upside/ downside then then buy or sell levels appear on Chart ( Automatically show when price reach any reversal zone of harmonic projection pattern based .
After showing reversal levels wait for confirmation until 21.4% or 28.3 % level not break if break then exit from current buy / sell trade and take fresh reverse trade buy/ sell .
Trailing SL:
After reach 1st Target trail SL to just above or below cost ( for example we are holding sell trade from 100 1st Target 110 hit then move trailing sl to 104-105 and move SL as price move upside or Downside)
Re- Entry :
For Re-entry in any pull back Point D ( 11.4% ) is used for re-entry then SL recent high or low Point SL ( 0% ) .
Blue Line is 1st support/ Resistance
Green line is 2nd support/ resistance
Red line is 3rd Support/ resistance

Silver XAGUSD sell on rise 30.55 - 30.40 Target sell given 32.15How to take trades using Harmonic pattern projection Trade setup is explained below :-
Entry : 1st SL point : 0% is recent top or bottom.
Trailing D: 11.4% is work as trailing SL of buy or sell trade if hit then we have to book profit
.If price goes below 2nd D 21.4% then early traders can make fresh reversals trade after breaking 1st D 11.4% safe traders can reversal trade after breaking 2nd D 21.4%
Targets :
Target T1 : 28.3% ( early trade if entry at 11.4% )
Target T1 : 35.1% to 38.2%
Target T3 : 49.1% to 53.2%
T3: 61.8% to 65.1% is our 3rd Target since this is reversal zone so must book profit if break then take fresh trade again
Target T4 : 76.4% to 79.7%
Next Targets are 100% , 127.2% ,141.4% and final Target 161.8%.
How to take reversal trade :
If price going upside/ downside then then buy or sell levels appear on Chart ( Automatically show when price reach any reversal zone of harmonic projection pattern based .
After showing reversal levels wait for confirmation until 21.4% or 28.3 % level not break if break then exit from current buy / sell trade and take fresh reverse trade buy/ sell .
Trailing SL:
After reach 1st Target trail SL to just above or below cost ( for example we are holding sell trade from 100 1st Target 110 hit then move trailing sl to 104-105 and move SL as price move upside or Downside)
Re- Entry :
For Re-entry in any pull back Point D ( 11.4% ) is used for re-entry then SL recent high or low Point D ( 0% ) .
Target is same as early 21.4% , 28.3 , 35.1 and so on
Blue Line is 1st support/ Resistance
Green line is 2nd support/ resistance
Red line is 3rd Support/ resistance

Silver comex 30.55- 30.36 downside Target sell given at 32.10How to take trades using Harmonic pattern projection Trade setup is explained below :-
Entry : 1st SL point : 0% is recent top or bottom.
Trailing D: 11.4% is work as trailing SL of buy or sell trade if hit then we have to book profit
.If price goes below 2nd D 21.4% then early traders can make fresh reversals trade after breaking 1st D 11.4% safe traders can reversal trade after breaking 2nd D 21.4%
Targets :
Target T1 : 28.3% ( early trade if entry at 11.4% )
Target T1 : 35.1% to 38.2%
Target T3 : 49.1% to 53.2%
T3: 61.8% to 65.1% is our 3rd Target since this is reversal zone so must book profit if break then take fresh trade again
Target T4 : 76.4% to 79.7%
Next Targets are 100% , 127.2% ,141.4% and final Target 161.8%.
How to take reversal trade :
If price going upside/ downside then then buy or sell levels appear on Chart ( Automatically show when price reach any reversal zone of harmonic projection pattern based .
After showing reversal levels wait for confirmation until 21.4% or 28.3 % level not break if break then exit from current buy / sell trade and take fresh reverse trade buy/ sell .
Trailing SL:
After reach 1st Target trail SL to just above or below cost ( for example we are holding sell trade from 100 1st Target 110 hit then move trailing sl to 104-105 and move SL as price move upside or Downside)
Re- Entry :
For Re-entry in any pull back Point D ( 11.4% ) is used for re-entry then SL recent high or low Point D ( 0% ) .
Target is same as early 21.4% , 28.3 , 35.1 and so on
Blue Line is 1st support/ Resistance
Green line is 2nd support/ resistance
Red line is 3rd Support/ resistance

Silver Bears sucking buy ordersSilver has fallen from high on saturday and we mark this move as A and from 31.93 low it has
made (a) move to upside and ABC irregular correction in (b) and complete (c) at 32.92 and
total move as W and x and now completed a Y correction to upside and now broken the low of
X,as per EW this move has completed the correction and more downside move is expected below 31.93

Silver XAUUSD daily time frame Long Term levels How to take trades using Harmonic pattern projection Trade setup is explained below :-
Entry : 1st D point : 0% is recent top or bottom.
Trailing SL: 20.2% is work as trailing SL of buy or sell trade if hit then we have to book profit
.If price goes below 20.2% then early or risky traders can reversal trade ,
Targets :
Target T1 : 28.3%
Target T1 : 37.8 %
Target T3 : 48.1%
T3: 60.2% to 66.9 % is our 3rd Target since this is reversal zone so must book profit if break then take fresh trade again
Next Targets are 77.5 % , 88.1 % 100% , 113.5 % , 127.3% , 141.2% and 160.2 , 177.5. final Target 200%
160.2 to 177.5% if profit booking area so book full profit and wait for reversal.
How to take reversal trade :
If price going upside/ downside then then buy or sell levels appear on Chart ( Automatically show when price reach any reversal zone of harmonic projection pattern based .
After showing reversal levels wait for confirmation until 20.2 % or 28.3 % level not break if break then exit from current buy / sell trade and take fresh reverse trade buy/ sell .
Trailing SL:
After reach 1st Target trail SL to just above or below cost ( for example we are holding sell trade from 100 1st Target 110 hit then move trailing sl to 104-105 and move SL as price move upside or Downside)
Re- Entry :
For Re-entry in any pull back Point D ( 10.1% ) is used for re-entry then SL recent high or low Point D ( 0% ) .
Target is same as early 20.2% , 28.3 , 37.8 and so on
Blue Line is 1st support/ Resistance
Green line is 2nd support/ resistance
Red line is 3rd Support/ resistance

Silver (XAG/USD) Technical Analysis – February 18Silver (XAG/USD) Technical Analysis – February 18, 2025
By Brokerir
Market Overview
Silver (XAG/USD) is currently trading at $32.628, showing signs of bullish momentum on the 30-minute Heikin Ashi chart. The price has been consolidating near the resistance zone, and based on technical indicators, a breakout seems likely. The projected upward targets are $33.338 and $34.128, where price action could face further resistance.
Key Technical Levels
Current Price: $32.628
Immediate Resistance: $33.338
Major Resistance: $34.128
Support Zone: $32.200 - $31.800
Technical Indicators & Market Structure
1. Price Action & Trend Analysis
The price of silver has been forming a higher low structure, indicating that buyers are gradually stepping in to push the market higher. The recent breakout attempt suggests an increase in bullish strength, with momentum favoring a continuation toward the next resistance levels.
2. MACD (Moving Average Convergence Divergence)
The MACD histogram is showing increasing bullish momentum. The MACD line has crossed above the signal line, a classic sign of strengthening bullish pressure. This suggests that silver could see further upside in the coming sessions.
3. Resistance & Breakout Potential
The first resistance level at $33.338 could be tested soon. If buyers sustain momentum, silver could rally towards the second key resistance at $34.128, where stronger selling pressure may emerge.
A confirmed breakout above $33.338 would likely trigger further upside movement, targeting the $34.128 zone as the next major price objective.
4. Market Sentiment & Fundamental Factors
Global market conditions, particularly the U.S. dollar strength, inflation data, and Federal Reserve policy expectations, could impact silver’s movement.
Silver remains a safe-haven asset, and if economic uncertainty increases, additional buying pressure may drive prices higher.
Conclusion & Trade Outlook
Silver is displaying a strong bullish setup, with technical indicators favoring an upside move toward $33.338 and $34.128. A confirmed breakout above the first resistance could accelerate buying momentum. However, traders should watch for potential pullbacks near key resistance zones.
📌 Trading Strategy Consideration:
A break and retest above $33.338 could provide a buying opportunity with a target of $34.128.
A failure to break resistance may result in short-term retracement toward $32.200 before another push higher.
This analysis by Brokerir provides a structured outlook on silver’s price action. Stay vigilant on price action confirmations before entering positions. Happy trading!

Silver sell trade active from 32.65 ,32$ hit sell on rise How to take trades using Harmonic pattern projection Trade setup is explained below :-
Entry : 1st D point : 0% is recent top or bottom.
Trailing SL: 20.2% is work as trailing SL of buy or sell trade if hit then we have to book profit
.If price goes below 20.2% then early or risky traders can reversal trade ,
Targets :
Target T1 : 28.3%
Target T1 : 37.8 %
Target T3 : 48.1%
T3: 60.2% to 66.9 % is our 3rd Target since this is reversal zone so must book profit if break then take fresh trade again
Next Targets are 77.5 % , 88.1 % 100% , 113.5 % , 127.3% , 141.2% and 160.2 , 177.5. final Target 200%
160.2 to 177.5% if profit booking area so book full profit and wait for reversal.
How to take reversal trade :
If price going upside/ downside then then buy or sell levels appear on Chart ( Automatically show when price reach any reversal zone of harmonic projection pattern based .
After showing reversal levels wait for confirmation until 20.2 % or 28.3 % level not break if break then exit from current buy / sell trade and take fresh reverse trade buy/ sell .
Trailing SL:
After reach 1st Target trail SL to just above or below cost ( for example we are holding sell trade from 100 1st Target 110 hit then move trailing sl to 104-105 and move SL as price move upside or Downside)
Re- Entry :
For Re-entry in any pull back Point D ( 10.1% ) is used for re-entry then SL recent high or low Point D ( 0% ) .
Target is same as early 20.2% , 28.3 , 37.8 and so on
Blue Line is 1st support/ Resistance
Green line is 2nd support/ resistance
Red line is 3rd Support/ resistance
