XAUUSD – PRICE STRUCTURE UPDATE: MAINTAINING THE TRADING ...💛 XAUUSD – PRICE STRUCTURE UPDATE: MAINTAINING THE TRADING SCENARIO 🎯
🌤 Overview
Hello everyone 💬
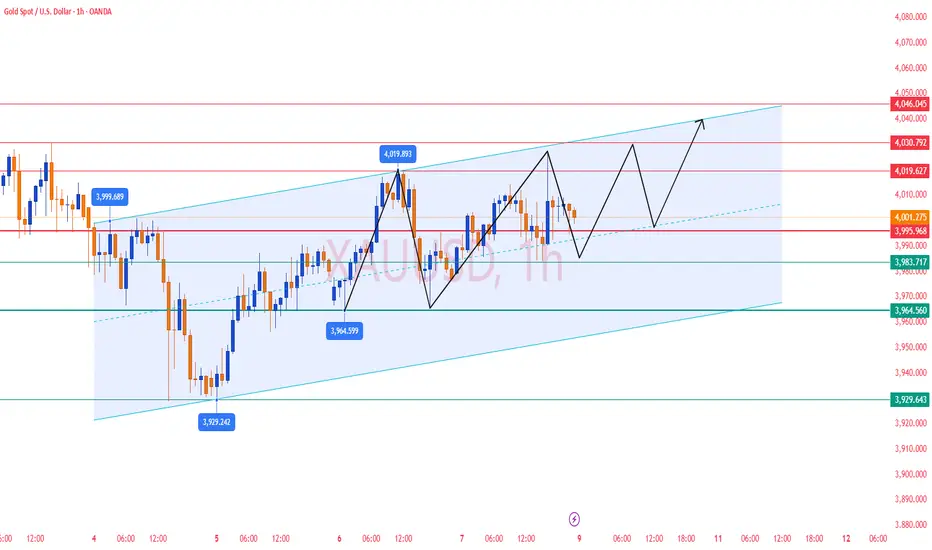
The price structure of gold is still on track as per the previous scenario — those who have bought according to the prior plan might have already profited and should continue to hold their ground.
The price in the Asian session at the start of the week has risen steadily, breaking through the 4021 zone, confirming a short-term uptrend and aiming to retest the upper edge of the H4 price channel.
This is a positive signal before the market might enter a deeper correction in the mid-week sessions.
In terms of news, the latest statement from US President Trump indicates that the government shutdown might soon end — this is a factor that could cause significant USD volatility, thereby having a short-term impact on gold prices.
💹 Technical Analysis
📈 On the H4 frame, the price remains within the medium-term upward channel, maintaining the structure of “higher lows”.
🟣 Breaking the 4021 zone confirms that upward momentum is prevailing, and the Sell Zone Liquidity 4090–4100 continues to be the short-term target for testing.
🔹 After hitting this zone, a correction is expected towards the 3920 – 3785 zone (Buy Zone Fibonacci) – where buyers might return strongly.
💫 The current price signal is entirely in line with the previous technical scenario, with no need to change the trading plan.
🎯 Reference Trading Plan
💢 SHORT scenario (short-term)
Entry: 4098–4102 | SL: 4112
TP: 4078 – 4025 – 3998 – 3920 – 3875 – 3785
💖 LONG scenario (long-term strategy)
Entry: 3785–3789 | SL: 3777
TP: 3810 – 3865 – 3925 – 3988
🌷 Conclusion
Gold prices are moving exactly as predicted in the structure 💛
Be patient, maintain discipline, and stick to the key price zones – this is the time when perseverance will yield the greatest advantage.
Trade ideas

Gold comex fresh buy given at 4000$ near 4150-80 target Key Highlights (Locked Permanently)
- Supports/Resistances: 4,080 is the critical support; breach flips bias.
- Indicators: ADX >25, RSI 62, PCR 0.94 — all thresholds confirmed.
- Liquidity: Turnover $12.9B, VWAP 4102 — strong institutional activity.
- Volatility: IV 14.3%, RV 13.2% — both below 20% threshold.
- Sentiment: Fear/Greed Index 66 = bullish confirmation.

Elliott Wave Analysis – XAUUSD (Week 2, November 2025) Momentum
W1 timeframe:
Weekly momentum is approaching the oversold zone, suggesting a high probability of a bullish reversal within the next 1–2 weeks. Once confirmed, this could mark the beginning of a new medium- to long-term uptrend.
D1 timeframe:
Daily momentum is moving toward the overbought area. During the first 1–2 trading days of the week (starting Monday), there is a strong likelihood of a downward reversal. If that occurs, the price may enter a short corrective phase to bring D1 momentum back to the oversold zone.
When both D1 and W1 momentums turn upward together from oversold levels, it would signal the potential start of a new bullish trend.
H4 timeframe:
H4 momentum is currently declining, suggesting a possible short-term drop during the Asian session. However, since price is being compressed within the major liquidity zone (POC) highlighted on the chart, the next direction remains unclear. It’s best to wait for a clear breakout beyond this liquidity area before confirming the next move.
________________________________________
🔹 Wave Structure
W1 timeframe:
The larger structure remains within wave (4) in yellow. With weekly momentum nearing oversold territory, wave (4) is likely to complete within the next 1–2 weeks, paving the way for the development of wave (5).
D1 timeframe:
The market is currently deep within the corrective phase of wave (4) in yellow, forming a W–X–Y pattern in purple.
• Wave W (purple) has been completed.
• Price is now likely forming wave X. Once wave X finishes, a downward move to complete wave Y is expected.
Wave W has already reached the 0.382 Fibonacci retracement of wave (3), meaning the minimum price objective for wave (4) has been met. When price achieves its target quickly, Elliott theory suggests the structure often extends sideways to complete in terms of time rather than depth.
A notable possibility:
• Wave W is complete.
• Wave X may have finished as a three-wave a-b-c correction (black).
• Wave Y may now be evolving as a contracting triangle (a-b-c-d-e).
This scenario will be reinforced if D1 momentum moves into the oversold zone simultaneously with a bullish reversal on W1, while price holds above 3897.
H4 timeframe:
Since D1 momentum is likely to turn downward soon, the primary short-term bias remains toward the W–X–Y structure shown on the chart.
Price is currently oscillating around the POC (Point of Control – green line), the highest liquidity area.
Price is approaching this POC from below while both D1 and H4 momentums are near reversal points — signaling potential for another short-term decline to complete wave y.
The 4038 and 4145 zones act as strong resistances and could serve as potential completion points for wave X (purple).
At present, wave X is consolidating within a triangle pattern. Since triangles typically form through contracting, overlapping waves, it’s essential to wait for a clear breakout candle above or below the triangle to determine the next trend direction.
________________________________________
🔹 Trading Plan
In the short term, avoid opening new positions while the price remains within the compression zone.
It’s recommended to observe Monday’s market open for a confirmed breakout direction — once clarity appears, a more precise and safer trading plan can be established.

XAUUSDGold is almost at the Supply. There might be possibility of reversal from here. Buy side liquidity is done. Now it can start targeting sell side Liquidity.

LiamTrading – XAUUSD | Early Week Bullish Scenario...LiamTrading – XAUUSD | Early Week Bullish Scenario: Successful Box Breakout, Watch for Retest at 4056 & Deep Buy at 3998–4000
The price has just broken out of the accumulation box and accelerated as per the weekend scenario. Bullish inclination for the day, with a near-term target of 4080 → 4110; the 4110–4112 zone is a suitable psychological resistance for scalping. Prioritise buying at the 4056 retest or deep buying at 3998–4000 when the price sweeps liquidity and then rebounds.
The US Senate takes further procedural steps to end the shutdown. Expectation of systemic risk cooling → pressure on USD decreases, supporting gold in the short term.
The process still has a few steps, fluctuations around news hours might be volatile → adhere to technicals, manage risks tightly.
Technical Analysis (H1/H2) – Volume Profile • Trendline • S/R • Fibonacci
Structure & Trendline: Box breakout upwards, trend-following capital dominates. Short-term uptrend when the price holds above 4056 (retest point of breakout zone).
Support/Resistance (S/R):
Support: 4056 (retest), 4025–4038 (FVG liquidity fill), 3998–4000 (Buy Zone Liquidity).
Resistance: 4110–4112 (psychological + short-term supply cluster), 4160–4165 (Fibo extension).
Fibonacci Extension:
1.618 coincides with 4110–4112 → likely reaction/scalp sell.
2.272 targets ~4160 → extended target/final profit exit.
Today's Trading Scenario
Continuation Buy (priority)
Entry: 4056–4060 (retest of breakout zone)
SL: 4048
TP: 4080 → 4110 → 4160
Management: Move SL to breakeven at +1R; partial close at 4080/4110.
Deep Liquidity Buy (cautious volume)
Entry: 3998–4000
SL: 3992
TP: 4020 → 4045 → 4080 → 4110
Note: Enter only with clear rejection candle (long lower wick, M1–M15 reversal) or after FVG fill and rebound.
Scalp Sell at Psychological Resistance (counter-trend)
Entry: 4110–4112
SL: 4118
TP: 4100 → 4080 → 4065
Note: Abandon trade if H1 closes strongly above 4112 or if the uptrend is too strong (breakout with volume).
Invalidation & Notes
Short-term bullish bias invalidated if H1 closes below 4048 → may test deeper at 4025–4038 or 3998–4000.
Avoid entering trades close to news hours about the US government reopening process.
Risk per trade: 0.5–1%, adhere to discipline of moving SL at +1R.
If you find this useful, comment on the price levels you're watching and hit Follow on LiamTrading to receive daily updates.

Gold 1H – Is This Pump Temporary or the Start of a Bigger Move?🟡 XAUUSD – Intraday Smart Money Plan | by Ryan_TitanTrader
📈 Market Context
Gold extended its bullish leg overnight, driven by a sharp upside displacement following a clean ChoCH on the H1 structure.
However, the impulsive rally is now pushing deep into premium territory, where higher-timeframe supply begins to re-enter the picture.
Market sentiment remains cautious ahead of U.S. consumer confidence data and upcoming comments from several Fed officials.
• A hawkish tone could strengthen the dollar intraday, making the current rally vulnerable to a pullback.
• A neutral or dovish signal may allow gold to sweep higher liquidity before forming its next decisive move.
Price is currently tapping into resting buy-side liquidity above 4060–4070, with the next pool sitting just beneath the 4090 supply zone, making this an ideal location for short-term reversals.
🔎 Technical Analysis (1H / SMC Style)
• Structure: H1 bias remains bullish after the major ChoCH, but price is now entering an exhaustion phase as it reaches unmitigated supply.
• Premium Zone: 4090–4088 aligns with the freshest H1 supply, formed right before the displacement — a prime location for a short-term reversal.
• Liquidity Sweep: The candles show aggressive wicks into higher liquidity, suggesting the market may engineer one final sweep into 4090 before rotating downward.
• Discount Zone: 3974–3976 lines up with unmitigated demand and sits directly below the previous accumulation range — an ideal discount level for continuation buys if price retraces.
🔴 Sell Setup (High-Probability Reversal)
• Entry: 4090 – 4088
• Stop-Loss: 4100
• Take-Profit Targets: → 4040 (first liquidity pocket) → 4005 (return to structure) → 3976 (discount zone & demand confluence)
🟢 Buy Setup (Demand Reaction Setup)
• Entry: 3974 – 3976
• Stop-Loss: 3967
• Take-Profit Targets: → 4005 → 4040 → 4080
(Only valid if price performs a liquidity sweep into 3976 and prints a clean M15 ChoCH.)
⚠️ Risk Management Notes
• Avoid entering early inside the premium zone — wait for bearish confirmation (M5–M15 BOS).
• The demand at 3974–3976 is strong but only valid once liquidity beneath the range has been fully taken.
• Do not chase buys near current levels; price is overextended and has no discount alignment.
• Partial profits should be secured at each liquidity point, with stops trailed using structural highs/lows.
• Intraday bias remains bullish-to-neutral, but current price is at an extreme, making shorts more favorable short-term.
✅ Summary
Gold is reaching into a major premium zone near 4090, where a short-term reversal becomes highly probable.
The 4090–4088 supply provides a clean, high-quality SMC continuation-short setup, while the 3974–3976 demand zone remains the strongest location for reactive long positions.
Stay patient — today’s movement will likely determine whether the recent pump is temporary or the beginning of a broader structural shift.
FOLLOW RYAN_TITANTRADER for daily SMC setups ⚡

GOLD LIKELY TO RETRACE INTO DEMAND BEFORE EXTENDING HIGHER📅 November 10, 2025 | XAUUSD Daily Trading Plan 💰
🧭 Market Structure Overview
Gold continues to trade within a bullish structure, confirmed by multiple Breaks of Structure (BOS) and a Change of Character (CHoCH) on the 30M timeframe.
The market recently printed a Weak High at 4070, indicating that liquidity remains above and buyers are still in control.
After a strong impulsive leg to the upside, price is expected to retrace into the nearest demand zones before resuming the bullish leg. The unmitigated order blocks around 4001–3999 and 3969–3967 present high-probability re-entry areas.
📊 Technical Breakdown
Structure: Bullish
Liquidity: Equal highs at 4070 likely to be swept before deeper retracement.
Zones of Interest:
Demand #1 → 4001–3999
Demand #2 → 3969–3967
Fair Value Gap: Between 4005–3990 offers potential rebalancing area.
🎯 Trading Plan (LONG Bias)
Entry Zone 1: 4001 – 3999
Entry Zone 2: 3969 – 3967
Take Profit (TP): 4078
Stop Loss (SL): 3994 (6$ risk)
Bias: ✅ LONG
🧩 Rationale
The recent bullish impulse following the CHoCH confirms a structural shift to the upside.
With liquidity resting above the Weak High, we anticipate a short-term retracement to fill imbalance and tap into discount demand zones.
From these zones, bullish continuation towards 4078 remains the most probable scenario — unless price breaks below 3965, which would invalidate the setup.
📌 Summary
Price remains bullish with strong momentum.
Wait for retracement into the identified demand zones for a high-probability long continuation setup.

Domestic Equity Market Trend1. Overview of the Domestic Equity Market
The domestic equity market refers to the marketplace within a country where shares of publicly listed companies are traded. In India, the two major stock exchanges are the National Stock Exchange (NSE) and the Bombay Stock Exchange (BSE). These exchanges provide the platform for investors to buy and sell equity shares, derivatives, and other securities.
The Indian stock market has seen remarkable growth, transitioning from a traditional broker-driven system to an advanced, technology-based environment. The benchmark indices—Nifty 50 and Sensex—serve as the barometers of the market’s overall performance, representing the health of leading sectors in the economy.
2. Recent Market Trends and Developments
In recent years, the domestic equity market has demonstrated resilience and expansion, driven by factors such as economic reforms, digitalization, and rising participation from retail investors.
a. Record Market Capitalization
India’s market capitalization crossed record highs, placing it among the top five global markets. The continuous inflow of foreign and domestic institutional funds, alongside Initial Public Offerings (IPOs) of emerging companies, has propelled the growth.
b. Retail Investor Dominance
Retail participation has surged significantly post-2020, aided by easy access to trading platforms, low brokerage costs, and increased financial literacy. Demat accounts have grown exponentially, indicating a structural shift where individuals are no longer mere spectators but active participants.
c. Sectoral Rotation
Different sectors have led the rally at different times—technology and pharmaceuticals during the pandemic, followed by banking, infrastructure, and capital goods in the recovery phase. This rotation indicates a healthy and balanced market evolution.
d. Growing SME and IPO Market
The SME (Small and Medium Enterprises) and mainboard IPO segments have gained strong traction. The appetite for new-age business models—such as fintech, renewable energy, and logistics—shows the market’s increasing acceptance of innovation-driven enterprises.
3. Key Drivers Influencing Domestic Equity Trends
a. Economic Growth
Equity markets move in tandem with GDP growth. India’s consistent growth rate, backed by manufacturing revival, infrastructure push, and consumption strength, supports bullish trends in equities.
b. Monetary Policy and Interest Rates
The Reserve Bank of India’s (RBI) policies on liquidity and interest rates play a crucial role. Lower interest rates typically boost equity valuations, as investors prefer equities over fixed-income assets for better returns.
c. Global Influences
Despite being a domestic market, Indian equities are affected by global events such as the U.S. Federal Reserve’s policy stance, crude oil price movements, geopolitical tensions, and global capital flows.
d. Corporate Earnings
Sustained improvement in quarterly corporate earnings has kept investor sentiment positive. Companies with strong balance sheets, high return on equity, and efficient management continue to attract long-term investments.
e. Technological Transformation
The rise of digital trading platforms, AI-based analytics, and algorithmic trading has enhanced liquidity and efficiency. This modernization has encouraged both professional and retail investors to engage more actively.
4. Sector-Wise Trends
The performance of the domestic equity market can be better understood by examining sectoral movements:
a. Banking and Financial Services
The banking sector has regained leadership, supported by improved asset quality, higher credit growth, and profitability. PSU banks have shown a strong turnaround, while private banks maintain their growth momentum.
b. Information Technology
While the IT sector faced margin pressures due to global slowdown concerns, it remains a structural growth driver given India’s digital transformation and global outsourcing demand.
c. Infrastructure and Capital Goods
This sector is witnessing a revival, backed by government infrastructure spending and private capex cycles. Stocks in this space are favored for long-term growth potential.
d. Energy and Renewable Sector
The energy sector is transforming rapidly with the focus shifting to renewables. Companies involved in solar, wind, and green hydrogen are drawing strong investor interest.
e. FMCG and Consumer Discretionary
Consumer-driven sectors benefit from rising income levels and urbanization. Despite inflationary pressures, demand remains robust, making them stable defensive plays.
5. Foreign Institutional Investors (FIIs) vs. Domestic Institutional Investors (DIIs)
The balance between FIIs and DIIs has become a defining factor for market stability. While FIIs bring in large capital inflows that can drive momentum, DIIs—such as mutual funds and insurance companies—help stabilize the market during volatile phases. The growing strength of DIIs reflects increasing domestic confidence in the Indian growth story.
6. Valuation and Liquidity Outlook
India’s equity valuations are relatively higher compared to peers, reflecting strong growth expectations. However, this also implies that any earnings slowdown could trigger short-term corrections. Liquidity remains ample, with consistent inflows from mutual funds and systematic investment plans (SIPs), which have become a cornerstone of long-term investing culture.
7. Policy and Regulatory Support
Reforms such as GST, Insolvency and Bankruptcy Code (IBC), Production-Linked Incentive (PLI) schemes, and Make in India have improved the investment climate. The Securities and Exchange Board of India (SEBI) continues to enhance transparency, corporate governance, and investor protection, strengthening market integrity.
8. Emerging Themes and Opportunities
a. Digital Economy and Fintech
India’s digital economy is expanding rapidly, creating investment opportunities in payment systems, e-commerce, and tech-driven services.
b. Manufacturing and “China+1” Strategy
Global supply chain diversification has made India a preferred destination for manufacturing investments, benefiting auto, electronics, and industrial sectors.
c. Green and Sustainable Investments
ESG (Environmental, Social, and Governance) investing is gaining momentum, with investors focusing on companies with sustainable practices and ethical governance.
d. Small-Cap and Mid-Cap Momentum
Smaller companies have outperformed large caps in recent times, driven by innovation, agility, and niche market leadership. However, this segment also comes with higher risk and volatility.
9. Risks and Challenges
No market is without risks. Key challenges for the domestic equity market include:
Global slowdown impacting exports and IT revenues.
Inflationary pressures leading to tighter monetary policies.
Political and regulatory uncertainties, especially around election periods.
Valuation concerns in overbought segments.
Liquidity shocks if foreign investors withdraw funds suddenly.
Long-term investors must stay alert to these risks while maintaining a diversified portfolio.
10. Long-Term Outlook
The long-term outlook for India’s domestic equity market remains optimistic and growth-oriented. Structural reforms, digital infrastructure, demographic advantage, and a strong entrepreneurial ecosystem make India a compelling investment destination. The combination of policy stability, rising domestic consumption, and innovation ensures that Indian equities remain a central focus for global investors.
Conclusion
The domestic equity market trend reflects a story of transformation, resilience, and opportunity. From being an emerging market to becoming one of the world’s fastest-growing equity destinations, India’s market evolution is driven by strong fundamentals, policy reforms, and investor participation. While short-term corrections are inevitable, the long-term trajectory remains bullish. For investors, staying informed, disciplined, and diversified is the key to navigating this ever-evolving landscape.

Part 1 Intraday Master ClassWhat Are Options?
An option is a financial contract that gives the holder the right, but not the obligation, to buy or sell an underlying asset (such as stocks, indices, or commodities) at a predetermined price (called the strike price) before or on a specific expiry date.
Options are classified into two types:
Call Option: Gives the right to buy an asset at a specific price.
Put Option: Gives the right to sell an asset at a specific price.
For this right, the buyer of an option pays a premium to the seller (writer) of the option.

GOLD SHOWING A GOOD UP MOVE WITH 1:10 RISK REWARD GOLD SHOWING A GOOD UP MOVE WITH 1:10 RISK REWARD
DUE TO THESE REASON
A. its following a rectangle pattern that stocked the market
which preventing the market to move any one direction now it trying to break the strong resistant lable
B. after the break of this rectangle it will boost the market potential for break
C. also its resisting from a strong neckline the neckline also got weeker ald the price is ready to break in the outer region
all of these reason are indicating the same thing its ready for breakout BREAKOUT trading are follws good risk reward
please dont use more than one percentage of your capitalfollow risk reward and tradeing rules
that will help you to to become a bettertrader
thank you

Gold Breaks Out from Accumulation, Eyes Wave 3 Expansion🔍 Market Context
Gold kicked off the new week with strong upside momentum, perfectly aligning with MMFLOW’s previous outlook — calling for a Wave 3 impulse from the accumulation base around 3,940$ – 3,970$.
The market’s reaction in early Asia confirmed a bullish structural shift, as gold continues to gain traction amid stable yields and cautious sentiment around the US Dollar.
Macro catalysts remain balanced, but liquidity behavior suggests smart money is loading into the breakout phase, positioning early for a potential run toward the 4,100$ handle this week.
If momentum sustains, this move could mark the official mid-term reversal that MMFLOW anticipated — setting up a broader recovery phase into year-end.
📊 Technical Outlook (H4 Structure)
Gold continues to follow its Elliott Wave recovery path, now developing Wave (3) within the medium-term bullish cycle.
Key Technical Zones:
• 💎 Support: 3,942$ – 3,982$ (accumulation base & breakout retest)
• 🎯 Target 1: 4,072$ – 4,133$ (Wave 3 completion zone)
• ⚙️ Target 2 / Extended: 4,189$ – 4,201$ (Fibo 1.618 extension)
• ⚠️ Invalidation: Below 3,940$ → loss of short-term momentum, return to neutral structure.
The breakout above 4,000$ reinforces bullish sentiment, while higher highs and sustained volume through 4,072$ would confirm a new impulsive phase with room to expand further.
🎯 MMFLOW TRADING View
This breakout isn’t random — it’s a smart-money-led accumulation exit after weeks of liquidity sweeps.
The narrative remains consistent: “Buy the dips inside strength.”
As long as gold stays above 3,970$, the probability of retesting 4,100$+ remains high, and a move toward 4,200$ before year-end cannot be ruled out.
⚜️ MMFLOW Insight:
“When the crowd hesitates, liquidity has already chosen direction.”

Gold Neowave Forecast (10-11-2025)Hello everyone
Sorry for absence as I go in research mode with Neowave and found something interestin, anyway lets talk about gold.
# Gold is started walking again in daily charts and its going or atleast try for the time being to break its all time again.
# I also added a blue box on the chart which is an time box, mean price must cross high within this time limits.
## Stoploss will be 3964 if breaks dont sell just exit.
Rest we will talk in the video along with BTC and Tesla.
Thank You.

XAUUSDGold is in bullish phase. It can retrace back to the demand zone in near future. Keep patience and wait for it to tap into the demand. Target whatever the recent new high would be, just above that.

XAUUSDGold is in Last phase of clearing sell side liquidity. Wait for the price to hit the supply and show rejection. It can fall down to the temporary support or demand zone. Then again can built Sell side liquidity . Keep Patience. price might go down first before hitting the supply zone.

GOLD LONG SSWING TRADEGOLD ANALYSIS 1 HOUR TF
What to Expect This Week
Early in the week
1. Gold may open slightly lower or stay near $4,000.
2. There’s a good chance it’ll dip a bit first — around $3,970–$3,960 — before going up again.
3. After that small drop, we could see a bounce back toward $4,050–$4,080.
4. If price stays strong above $4,050, it can even head toward $4,150–$4,200 later in the week.
5. If it breaks below $3,950, then the next support is near $3,900–$3,880 — that’s where buyers may step in again.

Gold Trading Strategy Reference for Next Week✅ Daily Chart Analysis
Gold has continued to fluctuate within a tight range, repeatedly surging and then pulling back sharply. The overall movement remains around the 4000 level, with 30–40 points of volatility. After a long period of consolidation, the market appears to be gathering momentum, suggesting that a breakout could be approaching.
From the daily timeframe, gold remains in a low-range consolidation and technical recovery phase. After several sessions of sideways movement, short-term moving averages have begun to turn upward, and candles are gradually stabilizing above them. This technical signal indicates that there is still room for further rebound in the near term.
✅ 4-Hour Chart Analysis
On the 4-hour chart, the short-term structure is improving, with price action slowly forming a small ascending triangle. Resistance remains near 4030, where price has repeatedly faced pressure. Candlesticks are climbing above short-term moving averages, indicating strengthening bullish momentum.
The 4030 level is a key area to watch — a decisive breakout above it could open a new upward channel, while failure to break it would likely keep gold within its current range.
On the downside, 3980 serves as an important support area; if price weakens, pay close attention to reactions around this level.
✅ 1-Hour Chart Analysis
From the 1-hour perspective, the previous short-term uptrend has paused, with 4030 turning into a crucial resistance zone. Support remains around 3985, where gold has repeatedly rebounded, showing continued buying interest. As long as this support holds, the bullish structure remains intact, and the upward potential could continue to expand. Traders can consider entering with normal position sizes near key support levels.
✅ Trading Strategy Reference
🔸Strategy 1 (Short Setup):
Sell in batches around 4030–4035,
Targets at 4000–3990,
If price breaks below, look for 3980 as the next target.
🔹Strategy 2 (Long Setup):
Buy in batches around 3980–3985,
Targets at 4020–4030,
If price breaks above, look for 4050 as the next target.
📊 Key Levels to Watch:
🔴Resistance: 4030–4046
🟢Support: 3980–3965
✅ Summary:
Gold remains in a high-level consolidation phase with a short-term bullish bias. A successful breakout above 4030 would confirm renewed upside momentum, while continued rejection at this level would likely keep the price oscillating within the range. In the short term, it’s best to trade the range — sell near resistance and buy near support — while adapting to market rhythm.
Gold weekly Outlook 10/11/2025 - 14/11/2025Wassup Lads!
So Gold, this looks very interesting, gold right now is in a very trappy orderflow, it's supported by a bullish weekly fair value gap on the downside and is facing resistance by a daily bearish fair value gap, if you drop down further to the 4h time frame, no keylevels are respected totally, indicating side ways movement.
So there's three possibilities -
1. We take out buyside and go to the sellside
2. We inverse the daily bearish fair value gap, then retest and continue higher
3. We take out the lows and create a bullish daily fair value gap
Honestly speaking, any of these 3 is possible. So it's a good idea tp stay away from gold for now unless you have an intra day A+ setup at play.
Gold looks interesting let's wait and watch.
Keep in mind to -
1. Stay disciplined
2. Manage your risk
3. Do your own research
Let's win this week

Xauusd A short sell is on the way !
A retest and a downside move will be open in tomorrow's session!

Part 2 Understanding the Structure of a CandlestickKey Terminologies
To understand options deeply, it’s essential to know the following terms:
Strike Price: The fixed price at which the option holder can buy (call) or sell (put) the underlying.
Premium: The price paid by the option buyer to the seller.
Expiry Date: The date on which the option contract expires.
In-the-Money (ITM): A call option is ITM if the underlying price is above the strike price; a put option is ITM if the price is below the strike.
Out-of-the-Money (OTM): The opposite of ITM; when exercising the option would not be profitable.
At-the-Money (ATM): When the underlying price is equal (or close) to the strike price.
Intrinsic Value: The amount by which an option is in the money.
Time Value: The portion of the option’s premium that reflects the time left until expiry and market volatility.

Basic Concepts of Options TradingWhat Are Options?
An option is a financial derivative contract that gives the buyer the right, but not the obligation, to buy or sell an underlying asset—such as a stock, index, or commodity—at a predetermined price (called the strike price) on or before a specified date (the expiry date).
Options are of two main types:
Call Option: Gives the holder the right to buy the underlying asset at the strike price.
Put Option: Gives the holder the right to sell the underlying asset at the strike price.
Each option contract typically represents 100 shares of the underlying stock in many markets (such as the U.S.), but in the Indian derivatives market (NSE/BSE), the lot size varies for different stocks and indices.

How will the golden new week be from 10-14/11?📉 H4 Analysis (Trendline, Support & Resistance)
Structure:
The price is currently moving within an upward channel.
Trendline:
Upper red trendline: Acting as dynamic resistance.
Lower red trendline: Current support, from where the price has bounced several times.
🧭 Fibonacci Levels:
0.5 = 4,130
0.618 = 4,188
→ This zone (4,180 – 4,200) is the key resistance zone.
💎 Key Levels:
Resistance: 4,180 – 4,200
(Fibo 0.618 + Previous Swing High)
Support: 3,890 – 3,920
(Previous Base + Bottom of Channel)
⚔️ Possible Scenarios:
If the price stays above 4,000 → Bullish move may continue, target 4,180–4,200.
If the price falls below 3,970 → Bearish breakdown, target 3,890 support zone.
📊 In Summary:
🔺 Resistance: 4,180 – 4,200
🔻 Support: 3,920 – 3,890
⚡ Trend: Mildly bullish, but strong resistance exists at 4,200.
SELL GOLD: 4195 – 4200
Stoploss: 4210
Take profit: 100-300-500pips
BUY GOLD: 3885 – 3890
Stoploss: 3970
Take profit: 100-300-500pips

Gold start buying on dip if break 4060 then 4150-4180 come Gold start buying on dip for nex week 4150-4180 upside will come if break 4060
How My Harmonic pattern projection Indicator work is explained below :
Recent High or Low :
D-0% is our recent low or high
Profit booking zone ( Early / Risky entry) : D 13.2% -D 16.1 % is
range if break them profit booking start on uptrend or downtrend but only profit booking, trend not changed
SL reversal zone (Safe entry ) : SL 23.1% and SL 25.5% is reversal zone if break then trend reverse and we can take reverse trade
Target : T1, T2, T3, T4 and .
Are our Target zone
Any Upside or downside level will activate only if break 1st level then 2nd will be active if break 2nd then 3rd will be active.
Total we have 7 important level which are support and resistance area
Until , 16% not break uptrend will continue if break then profit booking will start.
If break 25% then fresh downtrend will start then T1, T2,T3 will activate
1,3,5,10,15,20 minutes are short term levels.
30 minutes 60 minutes , 2 hours,3 hours, ... 1 day and 1 week chart positional and long term levels

LiamTrading – XAUUSD D1 | Scenario for Week 2 of NovemberLiamTrading – XAUUSD D1 | Scenario for Week 2 of November
Accumulation range 4047–3928, prioritise buying on breakout – watch for short at 4200 (FVG + Fib 0.382)
Overview: After the correction from the historical peak, gold is forming a bottom – accumulating in the price box 4047–3928. The D1 structure still leans towards a medium-term uptrend if the price holds above 3928; the ~4200 area coincides with a broad FVG + Fib 0.382, a “liquidity pool” prone to strong reactions.
Macro Summary
Hedging flows against public debt/deficit risks and net buying demand from some central banks/Asian bloc support the long-term trend.
Expectations of a cooling interest rate path in 2026 help ease pressure on gold, but pullbacks may still occur before major technical milestones.
Technical Analysis (D1 Frame – Trendline | S/R | Volume zone | Fibonacci)
Accumulation Range: 4047 (top of the box) ↔️ 3928 (bottom of the box). D1 closing above 4047 confirms an upper range expansion; breaking 3928 triggers a deeper decline to lower Fib levels.
Fibonacci of the most recent up wave:
The price is oscillating around 0.618 → tendency to form a base.
Deeper area if the base breaks: 0.5 ~ 3850 and 0.382 ~ 3710.
Key resistance: 4090–4120 (mid-box area), ~4200 (FVG + Fib 0.382) – expected large liquidity/short-term reversal zone.
Important support: 3990–4010 (psychological/trading cushion), 3928 (lower range – breakout mark).
Trendline: The medium-term uptrend line remains intact if corrections do not close below 3928.
Trading Scenario for the New Week
Scenario 1 – Buy with the trend on upper range breakout
Condition: D1 closes above 4047, retest holds firm at 4038–4047.
Entry: 4048–4055
SL: 4018
TP: 4090 → 4120 → 4185–4205 (FVG + Fib 0.382)
Management: Take partial profit at 4090/4120, move SL to breakeven at +1R.
Scenario 1b – Buy at the box bottom (fade range)
Entry: 3935–3945 (when there is a rejection candle/clear buying tail at 3928–3945)
SL: 3895
TP: 3995–4010 → 4040–4047
Note: If D1 closes below 3928, cancel the plan and switch bias to a bearish scenario.
Scenario 2 – Short reaction at the 4200 liquidity zone
Entry: 4185–4205 (FVG + Fib 0.382) when clear rejection appears on D1/H4
SL: 4225
TP: 4120 → 4047 → 4010 (extended target: 3850 if there is a breakdown signal)
Note: Counter-trend order; reduce volume, exit quickly if D1 closes above 4205.
Risk & Invalidation
The medium-term bullish bias remains valid as long as D1 does not close below 3928.
D1 closing below 3928 opens the path to 3850 (Fib 0.5), even 3710 (Fib 0.382).
Strong news (CPI, employment, central bank speeches) can disrupt signals; wait for candle closure according to the chosen frame.
Summary
Gold is “spring-loaded” within 4047–3928. Priority plan: Buy on breakout–hold 4047 to aim for 4090–4120 and test ~4200; simultaneously watch for short reaction at 4200. If 3928 breaks, switch scenario to decline towards 3850 → 3710.
