Gold 4H – Key Liquidity Zones Ahead of US PMI & Fed Commentary🥇 XAUUSD – Weekly Smart Money Outlook | by Ryan_TitanTrader
📈 Market Context
Gold continues to consolidate within a tight 4H range as traders prepare for a week influenced by U.S. PMI releases, Fed speeches, and shifting rate-cut expectations.
Mixed economic signals — including softer labour data but resilient manufacturing prints — have kept gold trapped between supply overhead and stacked demand levels below.
Institutional flows remain cautious, with markets waiting for clarity on the Fed’s stance. This uncertainty often fuels liquidity-driven sweeps, making this week especially favourable for SMC-style setups.
Short-term volatility is expected as price interacts with major liquidity pools on both ends of the range.
🔎 Technical Analysis (4H / SMC View)
• Price is moving within a well-defined range structure, with repeated liquidity grabs on both sides indicating accumulation by larger players.
• The latest 4H ChoCH signals continued hesitation from buyers near the mid-range, hinting that the market may engineer another sweep before committing to a directional leg.
• A significant Premium Supply Zone at 4154–4152 sits just above recent equal highs — an attractive area for liquidity hunts followed by potential short-term distribution.
• Conversely, the Discount Demand Zone at 3907–3909 aligns with previous structural reaction levels and sits below a liquidity shelf, making it an ideal zone for re-accumulation.
• Expect engineered stop-hunts around mid-range liquidity (4000–4016) before a stronger move develops.
🟢 Buy Zone: 3907–3909
SL: 3900
TP targets: 3978 → 4003 → 4016 → 4125
Rationale:
• Discount zone within the current 4H range
• Liquidity resting below the structure lows
• Potential accumulation before the next bullish impulse
🔴 Sell Zone: 4154–4152
SL: 4161
TP targets: 4080 → 4016 → 3978 → 3920
Rationale:
• Premium supply positioned above equal-high liquidity
• Likely area for a sweep before corrective downside
• Confluence with previous 4H structure rejection
⚠️ Risk Management Notes
• Wait for M15 ChoCH or BOS confirmation inside each zone before entering.
• Expect liquidity manipulation around 4000–4016, especially during US session opens.
• Avoid entries 10–15 minutes before major Fed or PMI releases to limit spread expansion.
• Scale partial profits at each structural target to lock in gains while letting runners play out.
✅ Summary
Gold remains in a controlled 4H range with clear institutional footprints above and below the current price.
Smart Money is likely to engineer a move into either the 4150 supply or the 3900 demand before choosing its next major direction.
Both setups offer high-probability opportunities when combined with intraday confirmations.
Stay patient, wait for liquidity sweeps, and respect structure.
Premium sells remain valid at 4154–4152, while discounted buys are favoured at 3907–3909.
🔔 FOLLOW RYAN_TITANTRADER for daily SMC setups ⚡
Trade ideas

Advanced Chart Patterns in Technical Analysis1. Introduction to Advanced Chart Patterns
In trading, patterns repeat because human behavior is repetitive. Fear, greed, and hope drive market movements, and these emotions get imprinted in price charts. Advanced chart patterns are an extension of classical technical formations, combining structure, volume, and momentum to forecast price trends. Mastering them helps traders differentiate between false breakouts and genuine opportunities.
Advanced patterns generally fall into two main categories:
Continuation Patterns – Indicating a pause before the prevailing trend continues.
Reversal Patterns – Signaling the end of a trend and the beginning of a new one.
2. Head and Shoulders (Reversal Pattern)
The Head and Shoulders pattern is one of the most reliable reversal signals. It indicates a change in trend direction — from bullish to bearish (standard form) or from bearish to bullish (inverse form).
Structure:
Left shoulder: A price rise followed by a decline.
Head: A higher peak than the left shoulder, followed by another decline.
Right shoulder: A lower rise, followed by a breakdown through the neckline.
Neckline: Connects the lows between the shoulders and serves as a key breakout level.
Once the price breaks below the neckline, it confirms a bearish reversal. The target is estimated by measuring the distance from the head to the neckline and projecting it downward.
Inverse Head and Shoulders works similarly but in the opposite direction — signaling a bullish reversal after a downtrend.
3. Cup and Handle Pattern
The Cup and Handle is a bullish continuation pattern resembling a teacup. It was popularized by William O’Neil in his book How to Make Money in Stocks.
Formation:
Cup: A rounded bottom, showing a gradual shift from selling to buying.
Handle: A short pullback or consolidation that follows the cup, forming a downward-sloping channel.
When the price breaks above the handle’s resistance with strong volume, it often signals a continuation of the prior uptrend.
Target: The depth of the cup added to the breakout point.
This pattern is often seen in growth stocks and long-term bullish markets.
4. Double Top and Double Bottom
These patterns are classic but essential to advanced technical traders due to their reliability and frequency.
Double Top:
Appears after a strong uptrend.
Price makes two peaks at similar levels separated by a moderate decline.
A breakdown below the “neckline” confirms a bearish reversal.
Double Bottom:
Appears after a downtrend.
Two troughs form around the same level with a peak in between.
A breakout above the neckline signals a bullish reversal.
Volume confirmation is crucial — rising volume on the breakout adds credibility to the pattern.
5. Flag and Pennant Patterns
Flags and Pennants are short-term continuation patterns that often appear after a strong price movement, known as the “flagpole.”
Flag: Forms as a small rectangular channel sloping against the main trend.
Pennant: Appears as a small symmetrical triangle following a sharp move.
These patterns typically consolidate the market before the next strong move in the same direction.
Breakout Rule:
When price breaks in the direction of the previous trend, accompanied by high volume, it confirms continuation.
Target Projection:
Length of the flagpole added to the breakout point.
6. Wedge Patterns
Wedges are advanced chart patterns signaling either continuation or reversal depending on their position and direction.
Rising Wedge:
Forms when price makes higher highs and higher lows, but the slope narrows upward.
Typically appears in an uptrend and indicates weakening bullish momentum — a bearish reversal signal.
Falling Wedge:
Forms with lower highs and lower lows converging downward.
Usually appears in a downtrend, indicating a potential bullish reversal.
Volume generally declines during formation and expands during breakout, confirming the move.
7. Symmetrical, Ascending, and Descending Triangles
Triangles represent consolidation phases and serve as reliable continuation patterns.
Symmetrical Triangle:
Characterized by converging trendlines with no clear direction bias.
Breakout direction typically follows the prior trend.
Ascending Triangle:
Horizontal resistance with rising support.
Usually forms during an uptrend, signaling bullish continuation.
Descending Triangle:
Horizontal support with declining resistance.
Typically bearish, indicating continuation of a downtrend.
Triangles are volume-sensitive patterns — declining volume during formation and surge during breakout strengthens reliability.
8. Rectangle Pattern
A Rectangle or Trading Range represents a period of indecision between buyers and sellers.
Formation: Price oscillates between horizontal support and resistance.
Interpretation:
Breakout above resistance → bullish signal.
Breakdown below support → bearish signal.
Traders often trade within the rectangle until a confirmed breakout occurs, using stop-losses near the opposite boundary.
9. Diamond Pattern
The Diamond Top is an advanced reversal pattern that forms after a prolonged uptrend. It begins as a broadening formation (wider price swings) and ends with a narrowing triangle — resembling a diamond shape.
Indicates distribution and market exhaustion.
Once price breaks below the support line, it confirms a bearish reversal.
This pattern is rare but highly reliable when spotted correctly.
10. Harmonic Patterns (Advanced Category)
Harmonic patterns use Fibonacci ratios to predict potential reversals with high precision. These include Gartley, Bat, Butterfly, and Crab patterns.
Gartley Pattern: Indicates retracement within a trend, typically completing at the 78.6% Fibonacci level.
Bat Pattern: Uses deeper retracement levels (88.6%) to identify precise turning points.
Butterfly Pattern: Suggests a reversal near 127% or 161.8% Fibonacci extensions.
Crab Pattern: Known for extreme projections (up to 224% or more), signaling deep retracements.
These patterns require advanced understanding of Fibonacci tools and are used by professional traders for precision entries.
11. Rounding Bottom and Top
Rounding Bottom:
Gradual shift from bearish to bullish sentiment.
Indicates long-term accumulation before a breakout.
Typically seen in major trend reversals in large-cap stocks.
Rounding Top:
Slow shift from bullish to bearish sentiment.
Represents distribution and is often followed by a sustained downtrend.
These patterns form over long durations (weeks or months) and are reliable for positional traders.
12. Broadening Formation
Also known as a megaphone pattern, it shows increasing volatility and investor uncertainty.
Formation: Two diverging trendlines — one ascending, one descending.
Meaning: Early sign of market instability; may precede major reversals.
Trade Setup: Enter once a confirmed breakout occurs beyond the pattern boundaries.
13. Volume and Confirmation in Chart Patterns
Volume plays a critical role in confirming pattern validity. Key principles include:
Decreasing volume during consolidation or pattern formation.
Increasing volume during breakout, confirming institutional participation.
False breakouts often occur on low volume, trapping retail traders.
Combining volume indicators (like OBV or Volume Oscillator) with pattern analysis enhances accuracy.
14. Practical Application and Risk Management
Even the most reliable patterns fail without proper risk management and confirmation strategies.
Wait for breakout confirmation with candle close beyond key levels.
Use stop-loss slightly below support or above resistance.
Combine patterns with momentum indicators like RSI or MACD for confirmation.
Avoid overtrading; focus on quality setups with clear symmetry and volume validation.
15. Conclusion
Advanced chart patterns bridge the gap between price action and trader psychology. They help traders interpret market behavior and anticipate future movements with a structured approach. Patterns like the Cup and Handle, Head and Shoulders, and Wedges reveal not just the direction but also the strength and conviction of trends.
Mastering these patterns requires practice, discipline, and confirmation through indicators and volume. When used correctly, advanced chart patterns empower traders to make informed, high-probability decisions — transforming random price data into profitable trading opportunities.
AI and Machine Learning in Stock Market Forecasting1. Introduction to AI and Machine Learning in Finance
Artificial Intelligence refers to the simulation of human intelligence in machines that can learn, reason, and make decisions. Machine Learning, a subset of AI, involves algorithms that improve automatically through experience. In finance, AI and ML are used to analyze market data, forecast trends, and automate trading strategies.
Unlike traditional statistical models that rely on fixed mathematical relationships, ML models adapt dynamically to changing market conditions. This adaptability makes them particularly useful in forecasting stock prices, where patterns are non-linear, complex, and influenced by multiple interacting variables.
2. Traditional Methods vs. AI-Based Forecasting
Traditional stock market forecasting techniques — such as fundamental analysis, technical analysis, and econometric models — depend heavily on historical data and human interpretation. These models often assume linear relationships and static patterns, which may not hold true in volatile markets.
In contrast, AI and ML models can process:
Large volumes of structured and unstructured data
Non-linear dependencies
Real-time information updates
For example, a traditional regression model may struggle to account for sudden market shocks, whereas an ML algorithm can learn from data anomalies and adapt to new market behaviors through continuous learning.
3. Machine Learning Techniques in Stock Market Forecasting
AI-driven forecasting utilizes various ML algorithms, each suited for different kinds of financial predictions:
a. Supervised Learning
Supervised learning algorithms are trained using labeled historical data — for example, past stock prices and associated indicators — to predict future values. Common models include:
Linear and Logistic Regression
Support Vector Machines (SVM)
Random Forests
Gradient Boosting Machines (XGBoost, LightGBM)
These algorithms can forecast future price movements, classify stocks as “buy,” “hold,” or “sell,” and identify potential risks.
b. Unsupervised Learning
In unsupervised learning, algorithms detect hidden patterns in data without labeled outcomes. Techniques like K-Means Clustering and Principal Component Analysis (PCA) are used to:
Identify stock groupings with similar behavior
Detect anomalies or unusual trading activities
Segment markets based on volatility or performance trends
c. Deep Learning
Deep Learning models, particularly Recurrent Neural Networks (RNNs) and Long Short-Term Memory (LSTM) networks, are highly effective in time-series forecasting.
These models capture temporal dependencies — such as how past price movements influence future prices — and are capable of handling sequential data efficiently.
For instance, an LSTM model can analyze years of price history, trading volume, and sentiment data to forecast the next day’s closing price.
d. Reinforcement Learning
Reinforcement Learning (RL) is a powerful AI approach where algorithms learn optimal trading strategies through trial and error. The system receives rewards for profitable trades and penalties for losses, gradually learning to maximize returns.
RL is increasingly used in algorithmic trading systems that make autonomous buy/sell decisions based on real-time market data.
4. Data Sources for AI-Based Forecasting
AI and ML models rely on diverse data sources to generate accurate predictions:
Historical Market Data: Price, volume, volatility, and returns over time.
Fundamental Data: Earnings, balance sheets, and macroeconomic indicators.
Alternative Data: News sentiment, social media trends, Google searches, and even satellite imagery.
Technical Indicators: Moving averages, RSI, MACD, and Bollinger Bands.
By integrating structured (numerical) and unstructured (text, images) data, AI models can capture market sentiment and detect emerging trends that traditional models may overlook.
5. Applications of AI and ML in Stock Forecasting
a. Price Prediction
Machine learning models are used to forecast short-term and long-term price movements. Algorithms such as LSTMs and Random Forests analyze time-series data to predict next-day or next-week stock prices.
b. Sentiment Analysis
Natural Language Processing (NLP), a branch of AI, interprets financial news, analyst reports, and social media content to gauge market sentiment.
For example, a surge in negative news sentiment about a company may signal an upcoming drop in its stock price.
c. Portfolio Optimization
AI systems analyze correlations among different assets and optimize portfolios to maximize returns while minimizing risk. Tools like Markowitz’s modern portfolio theory can be enhanced by machine learning models that adapt dynamically to market volatility.
d. High-Frequency Trading (HFT)
In high-frequency trading, AI algorithms execute thousands of trades per second based on micro-movements in prices. ML models process real-time market data streams and make ultra-fast trading decisions with minimal human intervention.
e. Risk Management and Anomaly Detection
AI systems monitor trading patterns to identify abnormal behavior, potential fraud, or risk exposure. These models help financial institutions comply with regulations and safeguard investor assets.
6. Benefits of AI and ML in Forecasting
Accuracy and Efficiency: AI models can analyze vast datasets quickly and produce precise forecasts.
Adaptability: They adjust to evolving market dynamics without manual recalibration.
Automation: Reduces human error and enables algorithmic trading.
Sentiment Integration: Incorporates behavioral and psychological aspects of markets.
Continuous Learning: Models improve over time as they process more data.
AI thus empowers traders, analysts, and institutions to make data-driven decisions and respond rapidly to market changes.
7. Challenges and Limitations
Despite their promise, AI and ML in stock forecasting face certain limitations:
Data Quality Issues: Inaccurate or biased data can mislead models.
Overfitting: ML models may perform well on training data but fail in real-world scenarios.
Black-Box Nature: Many AI models lack transparency in how they generate predictions, posing trust issues.
Market Unpredictability: Events like political crises, pandemics, or natural disasters can disrupt models trained on historical data.
Ethical and Regulatory Concerns: Use of AI-driven trading can lead to market manipulation or flash crashes if not monitored.
Hence, human oversight remains essential even in AI-based systems.
8. Future of AI and ML in Financial Forecasting
The future of AI in finance lies in hybrid models — combining human expertise with machine intelligence. Emerging technologies such as Quantum Computing, Explainable AI (XAI), and Federated Learning will further enhance forecasting capabilities.
Moreover, integration of blockchain data, real-time global sentiment, and predictive analytics will make AI-driven models more robust and transparent.
In the coming years, AI systems are expected to play a central role not just in forecasting but also in risk management, compliance automation, and personalized investment advice through robo-advisors.
9. Conclusion
AI and Machine Learning have transformed the way investors, institutions, and analysts approach the stock market. From pattern recognition and sentiment analysis to autonomous trading and portfolio optimization, these technologies offer powerful tools for understanding and predicting market behavior.
While challenges such as data quality, overfitting, and transparency remain, continuous advancements in AI research promise more reliable and interpretable forecasting systems. Ultimately, the combination of human insight and AI-driven analytics represents the future of intelligent investing — where data, algorithms, and human judgment work hand in hand to navigate the ever-changing financial markets.

XAUUSD Eyes 4000$ Breakout as Accumulation Phase Near Completion🔍 Market Context
After a week of sideways consolidation within a broad range, gold (XAU/USD) is showing the first signs of structural recovery.
The market is gradually carving a potential short-term bottom, hinting that the corrective phase may be ending — and a breakout from the range could be imminent.
Despite the lack of new macro catalysts, sentiment remains underpinned by renewed safe-haven flows and expectations that the Fed will maintain its easing stance through early 2026.
Traders are now watching closely whether the 4,000$ handle will finally give way — a key inflection zone that could trigger aggressive momentum buying if reclaimed.
📊 Technical Structure (H1–H4)
Gold is currently trading above the intraday demand zone 3,969$–3,982$, maintaining a short-term bullish structure while compressing under resistance.
The descending trendline and Fibo confluence near 4,019$–4,048$ act as the next critical reaction area for breakout confirmation.
Key Technical Zones:
• 💎 Demand Zone: 3,969$ – 3,982$ (liquidity base + ascending trendline confluence)
• 🎯 Primary Resistance: 4,019$ – 4,048$ (trendline + Fibo 1.272/1.618)
• ⚙️ Bullish Target: 4,046$ → 4,052$ → 4,090$ (extended range liquidity)
• ⚠️ Invalidation: Below 3,960$ → risk of a deeper correction toward 3,940$.
🎯 MMFLOW Outlook
Smart money appears to be absorbing liquidity within the 3,970$ zone, suggesting accumulation before expansion.
If gold can break and sustain above 4,000$, the bias flips decisively bullish — opening the door for a range expansion toward 4,050$+.
This could mark the beginning of a new impulse phase following weeks of compression.
⚜️ MMFLOW Insight:
“When volatility sleeps, liquidity quietly builds the next trend.”

15 MINUTES CANDLE CHART ANALYSIS$XAU/USD BUY NOW
ENTERY NOW 4006.00
TP 1 4030.00
TP 2 4050.00
TP 3 4070.00
TP 4 4100.00
SL 3964.00
Do not use more than 2X leverage.

The Psychology Behind Winning TradesThe Psychology Behind Winning Trades 🧠💹✨
Introduction – Hook:
📊 “Why do some traders consistently win 💰 while others struggle 💔?”
It’s rarely the strategy—it’s the mindset behind the trade! 🧠🌟
Your emotions, thoughts, and biases control your decisions, even with perfect technical skills. 🎯
1️⃣ What is Trading Psychology?
Trading psychology is the study of how emotions and mental habits affect trading decisions. 🌈🧘♂️
It’s about understanding:
How fear 😨, greed 😍, or impatience ⏳ impacts your trades
Why you sometimes ignore your rules 📝
How discipline 💪 can make the difference between profit 🏆 and loss 💸
💡 Tip: Even the best strategies fail if your mind isn’t in control. 🧠✨
2️⃣ Common Psychological Traps & How They Appear in Trades
Trap Emoji Effect Example in Trading
Fear 😨 Exiting too early Closing a winning trade because you’re scared of losing profits 💔
Greed 😍 Holding losing trades Waiting for a loss to “come back” and losing more money 💸
FOMO 🏃♂️💨 Jumping impulsively Entering trades last minute because everyone else is trading 🚀
Revenge Trading 😤🔥 Emotional loss-chasing Trying to recover losses by taking bigger, risky trades 💣
💡 Insight: Recognizing these emotions is the first step to controlling them. 🌟
3️⃣ How to Master Your Trading Mind
1️⃣ Pre-Trade Preparation 🧘♀️✅
Check your emotional state before trading 🕊️
Confirm your trade plan is clear 📋✨
2️⃣ During the Trade ✋🎯
Stick to your rules, don’t let emotions take over 💪🔥
Avoid impulsive exits or entries ⏱️❌
3️⃣ Post-Trade Reflection 📖🖊️
Keep a Trading Journal: note emotions, mistakes & wins ✨📓
Review trades to improve your mindset over time 📈🌟
4️⃣ Pro Tips for Winning Psychology
🔥 Mindset Checklist:
Am I trading calmly? 😌💭
Am I following my plan? 📋✅
Am I chasing losses or profits emotionally? ⚖️💡
💡 Daily Mindset Practice: Meditation 🧘♂️, journaling ✍️, or reviewing trades 📊 can help you stay disciplined under pressure 💎🌟
5️⃣ Why It Matters
Trading without psychology = strategy leaks money 💸💨
Emotional control = consistency, higher win rates, confidence 🏆💪
Professionals don’t just trade charts—they trade themselves 🧠✨
6️⃣ Engagement Section
👇 Question for your audience:
“What’s the biggest psychological trap YOU’ve faced in trading? Share your story below! 💬💭💖”

when banks panic all financial market seems unstable Go 4 Gold.Gold has been one of the best investments mankind have ever discovered and it can't be replaced . when financial markets seems doubtful go for gold.

Elliott Wave Analysis – XAUUSD (Gold) | November 7, 2025 Momentum
D1 timeframe:
Daily momentum is turning upward, but just one more bullish candle will push it into the overbought zone. This suggests that the current upward move may not be sustainable, and a short-term correction could occur soon.
H4 timeframe:
H4 momentum is about to turn bullish from the oversold area. If this signal is confirmed, we can expect a short-term upward move. However, as the market is currently in a balanced state, even a small push from either buyers or sellers could shift momentum direction. Therefore, it’s better to observe carefully rather than act too early.
90M timeframe:
Momentum on the 90-minute chart is turning downward, indicating a possible short-term pullback before any further advance.
________________________________________
Wave Structure
D1 timeframe:
The ongoing rise in momentum indicates that wave X is still unfolding, meaning the corrective phase is not yet complete.
H4 timeframe:
Wave X is currently forming. The liquidity zone at 4028 remains a key level to watch.
If the price breaks above this zone, the next target will likely be the upper liquidity zone at 4070.
On the H4 chart, the green level around 4007 represents the highest-volume area, currently acting as a strong resistance.
Combined with the H4 bullish momentum reversal, it shows buying pressure exists, but the resistance remains heavy, making the 4007–4028 region a key battleground.
We should wait for a clear breakout before confirming the next direction.
90M timeframe:
• A triangle-like structure seems to be forming, but it’s not yet complete, so confirmation is needed.
• Waves a and b appear finished; the market may now be forming wave c (black) or wave d (black).
• Since H4 momentum is turning bullish, if the price breaks above 4012, it will likely confirm wave c continuation.
• Conversely, if the price drops toward 3950, completing a three-wave WXY (blue) structure, we can consider it wave d instead.
Currently, wave c (black) is temporarily labeled since the structure already shows three subwaves completed.
Therefore, I expect a decline toward 3950, where we can look for a short-term buy setup.
________________________________________
Trade Plan
• Buy Zone: 3952 – 3950
• Stoploss: 3935
• TP1: 3980
• TP2: 4000

XAUUSD BUYGold is in a consolidation before pushing up. these are internal structure level for small trade.
if it comes down to Nearby small demand we can see a small buy orders pushing price to supply.
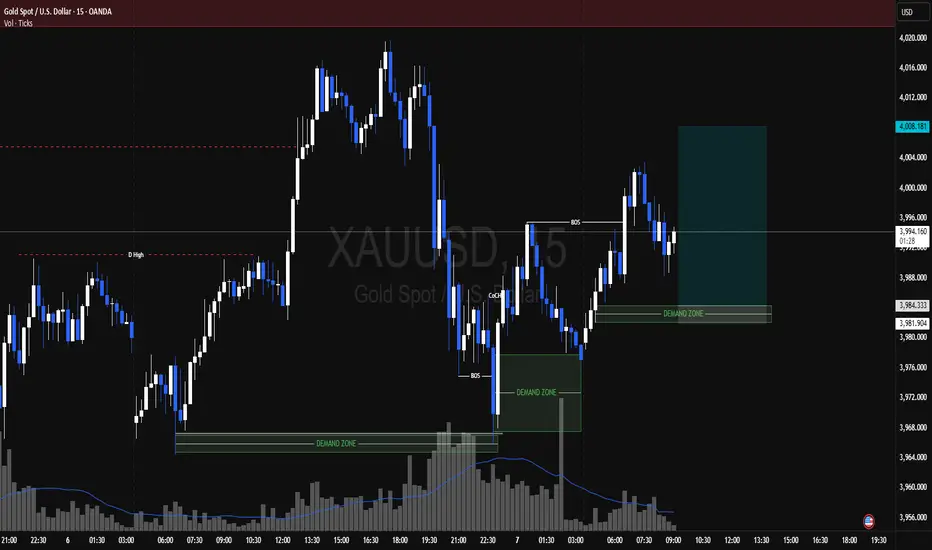
Gold Rejection at Resistance – Bearish Channel Targeting 3930📉 Analysis:
The chart shows a clear shift from an uptrend into a bearish correctional channel:
1. Uptrend Broken
Price previously followed a clean uptrend channel, making BOS (Break of Structure) swings upward.
A ChoCH (Change of Character) occurred, confirming momentum weakening.
2. Strong Resistance Zone
Price entered the 4018–4030 resistance level, marked as a weak high.
This zone acted as a reaction area, causing multiple rejections.
3. Bearish Channel Formation
After hitting resistance, price began forming lower highs and lower lows inside a falling channel.
The rejection line confirms sellers defending the zone.
4. Expected Bearish Leg
The projected path shows consolidation inside the channel followed by a sharp downward impulsive move.
Clean liquidity below supports the bearish scenario.
5. Targets
Major target: 3930
(Highlighted as the trader's target and matches channel support + demand zone.)
📌 Summary
Gold is rejecting the 4020–4030 resistance and forming a bearish channel. A continuation downward toward 3930 remains likely unless price breaks above the resistance with strong momentum.

XAUUSD LOOKING FOR LTF LONGS I'm breakeven out in the last one , I’ll still be actively watching for a lower-timeframe bullish shift during this session.

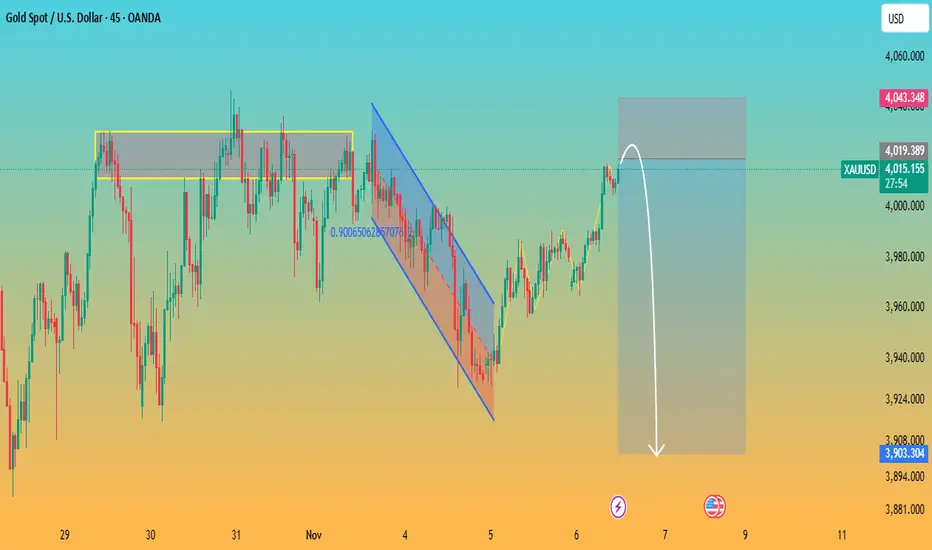
Gold Rejection at Resistance with Potential Bearish PullbackAnalysis:
The chart shows XAUUSD approaching a strong horizontal resistance zone around 4015–4020, a level where price has previously been rejected multiple times (highlighted in yellow). The market recently broke out of a falling channel, showing short-term bullish momentum, but now price is stalling again at this key resistance.
The grey zone above suggests a supply area, and the white arrow indicates a projected bearish move. As long as gold stays below this resistance, the probability of a downward correction increases.
A potential bearish target appears around 3900–3920 (previous support zone), where buyers may re-enter.
Key Points:
Strong multi-touch resistance at 4015–4020
Price showing early rejection signs
Bearish correction likely if price fails to break above resistance
Downside targets: 3920, possibly 3900
GOLD IS SETTING UP FOR ANOTHER BULLISH RUN — BUY THE DIP BEFORE November 7, 2025 — GOLD Daily Trading Plan 💰
🎯 Bias: LONG Setup (Buy the Dip)
Gold continues to show bullish market structure after multiple BOS (Break of Structure) confirmations on both intraday and H1 charts.
Price has reacted from the previous demand area 3969–3977, leaving a clean FVG below, suggesting unfilled imbalance and potential liquidity resting underneath.
At the moment, XAUUSD is hovering near 4007, approaching a minor supply zone at 4018–4020. I expect price to potentially sweep liquidity above 4018, then retrace back toward 3975–3969 to form a higher low before continuing its bullish leg.
Key confluences supporting the long bias:
✅ Multiple BOS and CHoCH shifts confirm bullish intent.
✅ FVG + Volume Gap below aligns with a discount zone for entries.
✅ Structural higher low formation still intact as long as price holds above 3965.
📌 Trade Plan:
🟩 Buy Zone: 3977 – 3969
⛔ Stop Loss: 3963 (max 6 points)
🎯 Take Profit 1: 4005
🎯 Take Profit 2: 4018
If price decisively breaks above 4020, expect continuation toward 4035–4040, but intraday traders should secure profits around the 4018 zone.
In case of a deeper retracement, watch for liquidity grabs near 3965–3950 FVG before another bullish push.

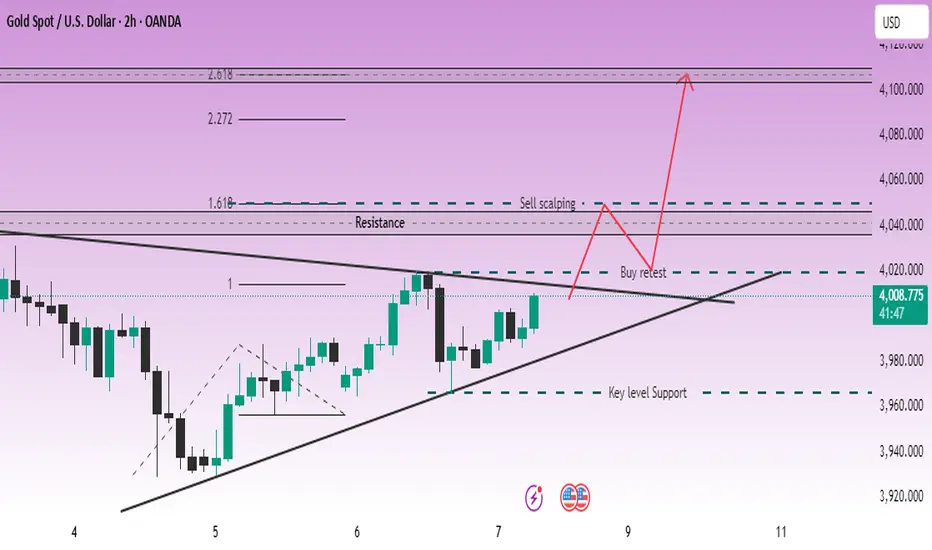
LiamTrading – Gold compressed at the triangle peak; watch for...LiamTrading – Gold compressed at the triangle peak; watch for a break at 4020 (H2)
After a week of accumulation, the price is pressing against the triangle peak between the descending trendline (from late October) and the ascending trendline (from 5/11). The advantage will clearly lean towards an increase if 4020 is broken and held.
Technical Analysis (prioritise H2, Volume Profile – Trendline – S/R – Fibonacci)
Trendline & Structure
The descending trendline is blocking recovery waves; the ascending trendline supports adjustment waves.
Closing the H2 candle above the confluence area ~4020 will confirm a clear upward movement.
Support / Resistance (S/R)
Main support: 3970–3972 (swing low & “Key level Support”).
Decision zone: 4014–4020 (break–retest zone).
Resistance: 4045 (medium-term), 4050 (supply for scalp orders), upper band 4105–4110.
Volume Profile (recent session / composite)
POC magnet: 4015–4017 → likely profit-taking/fluctuations; staying above POC turns this area into a launchpad.
LVN: around 4020 → beautiful break-and-go; failing to hold often pulls back to 4015/4010.
Fibonacci Extension (H2 swing)
1.618 coincides with 4045–4050 → first upward target.
2.272/2.618 creates a liquidity zone 4095–4110 → area may weaken/strong profit-taking.
Today's Trading Scenarios
Scenario 1 – Buy on breakout direction
Entry: 4020–4022 after closing above trendline + retest holding 4018–4020
SL: 4014
TP: 4045 → 4070 → 4100–4110
Management: Partially close at 4045; move SL to breakeven when reaching +1R. Staying above 4020 means POC 4015–4017 should switch roles to support.
Scenario 1b – Buy on adjustment wave (before breakout, cautious volume)
Entry: 3998–4002 (“400x”) when there is an upward reaction at the ascending trendline
SL: 3988
TP: 4017 → 4045
Note: H2 closes below 3988 → cancel the order.
Scenario 2 – Sell scalp at resistance
Entry: 4048–4052 (confluence Fibo 1.618 + supply zone)
SL: 4056
TP: 4040 → 4030 → 4020
Note: This is counter-trend. Ignore if H2 closes strongly above 4052.
Summary
The upward bias is confirmed when breaking–holding 4020, opening targets 4045 → 4070 → 4100+. Before that signal, trade within the range respecting POC 4015–4017 and ceiling 4045/4050. Risk per order 0.5–1%, move SL to BE when reaching +1R.
Gold 1H – Pullback Expected as USD Softens After Jobless Claims🟡 XAUUSD – Intraday Trading Plan | by Ryan_TitanTrader
📈 Market Context
Gold is trading within a corrective structure today as the U.S. dollar weakens slightly following higher-than-expected Jobless Claims.
Market sentiment remains mixed ahead of upcoming Fed speeches, which could provide clues about December policy expectations.
• A more hawkish tone could trigger a deeper downside move toward unfilled discount zones.
• Conversely, any dovish signals may push gold into a short-term liquidity grab before resuming its corrective trend.
Liquidity remains concentrated near the $4,030 area, where price may tap into resting buy-side liquidity before forming the next bearish leg.
🔎 Technical Analysis (1H / SMC Style)
• Structure: Current bias shows corrective bearish intent following recent ChoCH → BOS sequence on H1.
• Premium Zone: The 4030–4028 region aligns with an unmitigated H1 supply — ideal for continuation shorts.
• Liquidity Sweep: Price may reach 4030 to sweep early breakout buyers before confirming downside continuation.
• Discount Zone: Strong demand sits at 3932–3934, overlapping with previous bullish displacement and unmitigated demand.
🔴 Sell Setup
• Entry: 4030 – 4028
• Stop-Loss: 4040
• Take-Profit Targets: → 3980 → 3964 → 3934 (major demand zone)
🟢 Buy Setup (Countertrend Reaction)
• Entry: 3932 – 3934
• Stop-Loss: 3925
• Take-Profit Targets: → 3964→ 3995 → 4020
(Only valid if liquidity sweep and bullish reaction occur at the demand zone)
⚠️ Risk Management Notes
• Wait for M15 BOS/ChoCH confirmation at both zones to avoid premature entries.
• Avoid trading directly at the minor support around 3964 — it is not a valid SMC entry zone.
• Prioritize the sell setup; intraday bias remains corrective-bearish within a broader range.
• Secure partial profits at the first liquidity target and trail stops according to structure.
✅ Summary
Gold is likely to seek premium liquidity near 4030 before resuming its corrective move lower.
The 4030–4028 supply area offers a clean continuation-short entry, while 3932–3934 remains the strongest discount zone for reactive long setups.
Stay adaptable — the market maintains a mild bearish tone while waiting for further Fed guidance.
FOLLOW RYAN_TITANTRADER for daily SMC setups ⚡

XAUUSD – AWAITING CONFIRMATION OF UPTREND – TARGET 4050💛 XAUUSD – AWAITING CONFIRMATION OF UPTREND – TARGET 4050 🎯
🌤 1. Overview
Hello everyone 💬
Gold today remains in a phase of indecision – waiting for signals to confirm a new trend.
On the H2 chart, the price has broken the downtrend line and is retesting this line. The structure of “higher lows” indicates that buying pressure is gradually gaining dominance.
The previous peak around 4018 is currently the decisive point for the trend – if the price confirms a breakout above, the upward momentum may extend towards the 4050 area.
Currently, the market is fluctuating within the range of 3964 – 4018, and needs to break out of this zone to determine a clearer direction.
💹 2. ICT Perspective
📈 The price has broken the downtrend line and retested the structure on the H2 chart – an early signal for the potential formation of an uptrend.
🟣 The area 3964–4018 is a short-term liquidity accumulation zone before the price expands.
🔹 OB 4040–4042 coincides with significant resistance, suitable for short sell orders (scalp) if there is a strong reaction.
💫 When the price surpasses 4018, the upward structure will be confirmed and the expansion target may aim towards 4050 – 4077.
🎯 3. Reference Trading Plan
💖 BUY scenario (priority when confirmed)
Entry: above 4018 | SL: 4011
TP: 4025 – 4033 – 4050 – 4077
💢 Short SELL scenario (scalping)
Entry: 4040–4042 | SL: 4046
TP: 4022 – 4015 – 3998
⚠️ 4. Important Notes
Clear confirmation is needed when breaking the 4018 zone before entering a buy order.
If the price continues to fluctuate within the 3964–4018 range, trading should be limited.
Today is Friday, manage risk more tightly, prioritise accuracy in each order.
🌷 5. Conclusion & Interaction with LanaM2
Gold is showing positive signals 💛
Be patient and wait for reactions around the 4018 zone – this could be the start of a new uptrend if clearly confirmed.

XAUUSD TRADE SETUP @3996.480
stop at AR low 3985.600
tp 4046.615
Last trading day of the week, so caution makes sense. There are a few potential news catalysts that could create some volatility. My bias here is long, and I’m scaling into the position gradually as confluences develop.
Add this pair to your watchlist and monitor price action. Only take the trade if it aligns with your own analysis and directional bias. This isn’t a chase setup — patience matters here.

Gold Again Bullish side Buy Gold 4018 above cross
Then buy gold
Target 4039,4060,4075,4110
Sell Gold 4006
Target 3995,3988,3965,3930,3900,3880
Wait for correction

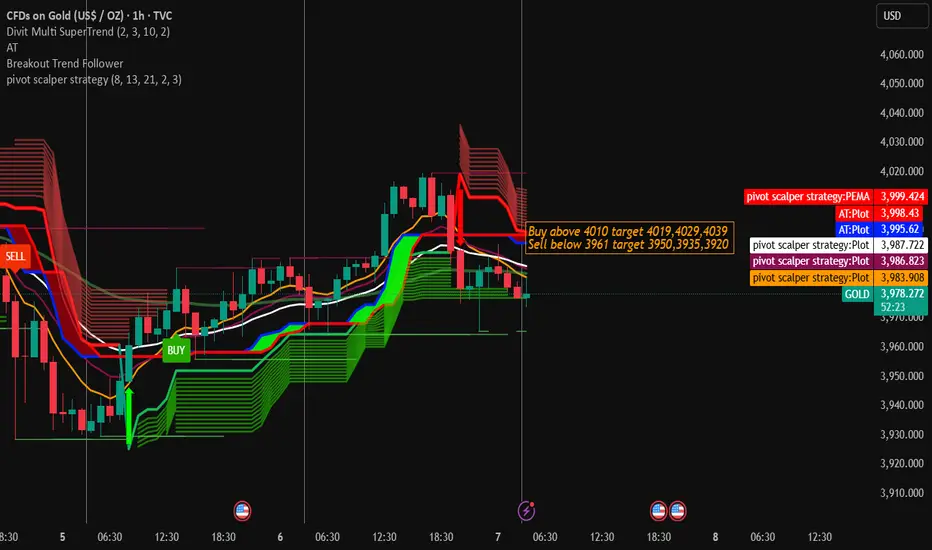
Gold Trading Strategy for 07th November 2025💰 GOLD TRADING PLAN (INTRADAY SETUP)
🟢 BUY SETUP (LONG TRADE)
📈 Entry Condition:
Wait for a 1-hour candle to close above ₹4010.
Once the candle closes, buy only if the price stays above ₹4010.
🎯 Targets:
🥇 Target 1: ₹4019
🥈 Target 2: ₹4029
🥉 Target 3: ₹4039
🛑 Stop Loss (SL):
Keep a stop loss below ₹4000 or below the previous candle’s low, whichever is safer.
💡 Tips for Beginners:
Always wait for the candle to close before entering — don’t enter mid-candle.
Use a limit order or stop order for precision.
If the price hits the first target, move your stop loss to cost price to protect your capital.
🔴 SELL SETUP (SHORT TRADE)
📉 Entry Condition:
Wait for a 15-minute candle to close below ₹3961.
Once it closes below, enter a sell position only if the price stays below ₹3961.
🎯 Targets:
🥇 Target 1: ₹3950
🥈 Target 2: ₹3935
🥉 Target 3: ₹3920
🛑 Stop Loss (SL):
Place a stop loss above ₹3972 or the previous candle’s high, whichever is higher.
💡 Tips for Beginners:
Confirm the trend direction using a moving average or RSI indicator before entering.
Never chase the trade — wait patiently for candle confirmation.
Manage risk properly: never risk more than 1–2% of your trading capital on a single trade.
⚠️ DISCLAIMER
📜 This information is for educational purposes only and not financial advice.
Trading in gold or any financial market involves high risk. Always do your own research (DYOR) and consult with a certified financial advisor before making real trades. The market can move unexpectedly — use stop loss and proper position sizing to protect your capital.
Gold Trading Strategy | November 6-7✅ From the 4-hour timeframe, gold experienced a significant pullback after touching 4019 and is currently in a consolidation phase following a short-term rebound failure. The candlesticks have fallen back below the short-term moving averages, while the MACD continues to weaken.
🔸 Moving Average Structure:
MA5 and MA10 have flattened and are slightly turning downward → indicating weakening bullish momentum. MA20 continues to suppress the price, showing clear overhead pressure. Price has returned below the short-term MA cluster, reflecting weakening mid-term upside momentum and fading rebound strength.
🔸 Bollinger Bands Structure:
The middle band (3978–3980) has become a key short-term support. The upper band is narrowing downward, suggesting reduced volatility and short-term consolidation. Candlesticks failed to hold above the middle band, indicating insufficient rebound strength and a corrective sideways structure.
✅ From the 1-hour timeframe, gold staged a technical rebound after a sharp decline, but the strength remains limited and failed to stand above MA20, leaving the price in a weak rebound pattern.
🔸 Moving Average Structure:
MA5 and MA10 are flattening and intertwining, while MA20 applies downward pressure. The moving average convergence signals a consolidation phase.
🔸 Bollinger Bands:
The middle band (3994) serves as short-term resistance, while the lower band (3967) continues to rise, indicating supportive pressure at the bottom. After the bearish momentum was released, a minor technical rebound is reasonable, but the upside remains limited.
🔴 Resistance Levels: 3994–3996 / 4003–4005 / 4015
🟢 Support Levels: 3978–3980 / 3966–3968 / 3942
✅ Trading Strategy Reference
🔰 Rebound Short Setup
If gold rebounds to:
3994–3996 or 4003–4005 and faces rejection → consider light short positions
🎯 Targets: 3980 / 3970
⛔ Stop Loss: above 4008
🔰 Pullback Long Setup
If gold pulls back to:
3978–3980 and stabilizes → consider light long positions
🎯 Targets: 3994–3996
⛔ Stop Loss: below 3968
✅ Overall Outlook:
Gold is currently showing a weak corrective rebound and remains overall bearish. Short-term rebound strength is limited. Unless price can stabilize above 4010–4015, further downside support tests are likely.

XAUUSD – Consolidation Before Drop**Gold (XAUUSD) – Consolidation Before Potential Downside Move**
Gold continues to hover in a consolidation range after the recent breakout and structural shift on the 3H chart. The bullish momentum that previously dominated has now slowed, indicating a possible distribution phase forming near the $4,050–$4,100 zone.
The market structure shows repeated rejections at the upper boundary, suggesting that buyers are losing strength. With BOS (Break of Structure) confirmations in the recent candles and a clear lack of higher highs, a potential downside continuation could unfold once the current range is broken.
If sellers take control below $3,978, the next liquidity targets lie around **$3,886** and possibly **$3,614**. This scenario aligns with the broader retracement expectation after a strong prior uptrend.
However, a confirmed breakout above the consolidation area would shift the short-term bias back to bullish, with upside potential toward **$4,248** and beyond.
**Market Outlook:** Neutral → Bearish
**Bias:** Short-term corrective move expected
**Key Levels:**
* Resistance: $4,050 – $4,100
* Support: $3,886 – $3,614
**Tags:** #Gold #XAUUSD #GoldAnalysis #XAUUSDforecast #GoldPricePrediction #GoldTrading #GoldMarket #Commodities #TradingViewIdeas

XAUUSD SUPPORT, RESISTANCE & TRENDLINE ANALYSIS I am back!!
Go "LONG" if it breaks the trendline with 4023.97 as the first target and if it breaks that as well then aim for 4035 adn further breaking that might lead to 4045.
Go " SHORT" if it breaks 4005.20 with 3986.56 as the first target and breaking that trendline might lead to 3967.92 and if it breaks and sustains that as well then we might expect a move till 3949.10
Note: As long as it stays above 3977 you can expect the momentum to be Bullish. If only it breaks the 3977 mark then it might lead till the apbe mentioned Bearish targets.
Also kindly follow candle patterns as well and then go for confirmation.
Happy Trading.

Gold (XAUUSD) – Bears Eye the 4000 Wall! Short Setup AheadGold is currently trading within a tight range of 3990 – 3960, and price action is now approaching the crucial resistance zone at 3990 – 4000.
📈 This area has acted as a strong supply zone in recent sessions — and could once again attract sellers.
💡 Trading Plan:
🔸 Sell Zone: 4000 – 4003
🎯 Targets: 3990, 3980 and 3970
🛑 Invalidation: View remains valid below 4012 — a sustained break above this level would negate the short setup and could open the door for further upside momentum.
📊 Bias: Bearish near resistance until confirmed breakout above 4012
💬 Watch for rejection signals or bearish candles in this zone before entering.
⚠️ Disclaimer
This is for educational purposes only — not financial advice. Always manage your risk and use proper position sizing.
Your feedback drives our content and keeps everyone trading smarter. Let’s make those pips together! 🚀
Happy Trading,
– The InvestPro Team
