Gold Pulls Back From All-Time High – Correction Looks Limited📊 Market Overview
Gold slightly corrected from its all-time high near $4,239, showing early signs of a short-term pullback, but the overall trend remains bullish.
Despite the correction, fundamental sentiment still supports Gold:
💬 US–China trade tensions and geopolitical risks continue to fuel demand for safe-haven assets.
💵 The US Dollar remains under pressure amid expectations of a Federal Reserve rate cut later this year.
⚖️ Ongoing concerns about a possible US government shutdown further enhance Gold’s attractiveness.
These factors suggest that the current dip is likely a healthy correction within a strong uptrend, not a reversal.
🧠 Technical Structure (MMFLOW Wave View)
Gold has likely completed a minor Wave (V) on the M30 chart, forming a new ATH Zone near 4,239.
Currently, price is unfolding a corrective A–B–C pattern, expected to find support at key liquidity zones before resuming the uptrend.
Our model highlights two potential BUY setups and a short-term SELL scalp opportunity for today’s trading session.
🔑 Key Levels to Watch
🔵 BUY Setup 1
Zone: 4,184 – 4,182
SL: 4,178
TP: 4,188 – 4,192 – 4,196 – 4,200 – 4,210 – 4,220 – ???
🟢 BUY Setup 2 (Deeper Retrace)
Zone: 4,148 – 4,146
SL: 4,140
TP: 4,152 – 4,156 – 4,160 – 4,170 – 4,180 – 4,190 – 4,200
🔴 SELL SCALP Opportunity
Zone: 4,230 – 4,234
SL: 4,238
TP: 4,220 – 4,215 – 4,210 – 4,200 – 4,190 – ???
⚙️ MMFLOW Trading View
📈 Price is currently respecting Wave (A) of the correction.
We expect a possible (B) retracement toward 4,220 – 4,230, followed by (C) decline completing near 4,147 – 4,150 (Fibo 0.618 / CP Buy Zone).
From there, Smart Money may re-enter long positions targeting a fresh liquidity sweep toward the 4,285 SELL ZONE.
In short:
The uptrend remains intact, only a short-term correction is unfolding.
Patience is key — best opportunities will likely appear around 4,150 – 4,180 range.
The structure aligns perfectly with both technical confluence (Elliott + Liquidity Zones) and macro sentiment.
If the market holds above 4,140, Gold could aim for new highs toward 4,285 – 4,300 in the next few sessions.
However, traders should:
✅ Always use Stop Loss — volatility is high near record highs.
✅ Avoid overtrading in narrow pullback zones.
✅ Focus on reaction at key liquidity levels before entering.
⚡️ Summary
Gold remains technically bullish with limited downside correction.
Watch for price reaction around 4,184 and 4,147 — both zones represent strong liquidity areas where Smart Money may look to buy again.
After completing this correction, a new impulsive leg up toward 4,285+ could unfold, potentially marking the next all-time high.
Trade ideas

Option Greeks and Advanced Hedging Strategies1. Introduction to Option Greeks
Options are derivative instruments that derive their value from an underlying asset, such as stocks, indices, commodities, or currencies. Unlike equities, the price of an option depends on several factors, including the underlying asset's price, volatility, time to expiration, and interest rates. Option Greeks quantify how sensitive an option’s price is to these variables, offering actionable insights into risk management.
There are five primary Greeks: Delta, Gamma, Theta, Vega, and Rho. Each provides a unique perspective on the risks and potential rewards associated with holding an option. Understanding these Greeks is critical for designing hedging strategies, structuring trades, and managing portfolio exposure.
2. Delta (Δ): Price Sensitivity to the Underlying
Delta measures the sensitivity of an option’s price to a $1 change in the price of the underlying asset. It ranges from 0 to 1 for call options and -1 to 0 for put options.
Call Options: Delta ranges from 0 to +1. A delta of 0.5 implies that if the underlying asset rises by $1, the option’s price will increase by $0.50.
Put Options: Delta ranges from -1 to 0. A delta of -0.5 indicates that a $1 increase in the underlying asset decreases the put option’s price by $0.50.
Delta also represents the probability of an option expiring in-the-money (ITM). For example, a delta of 0.7 suggests a 70% chance of finishing ITM. Traders use delta to gauge directional exposure, and delta can also serve as a foundational element in hedging strategies such as delta-neutral hedging, which will be discussed later.
3. Gamma (Γ): Rate of Change of Delta
Gamma measures the rate of change of delta in response to a $1 change in the underlying asset. While delta provides a linear approximation, gamma accounts for the curvature of option pricing.
High gamma indicates that delta can change significantly with small movements in the underlying asset, which is common for at-the-money (ATM) options nearing expiration.
Low gamma implies more stable delta, typical of deep-in-the-money (ITM) or far-out-of-the-money (OTM) options.
Gamma is crucial for traders managing delta-neutral portfolios. A high gamma position requires frequent rebalancing to maintain neutrality, as the delta shifts rapidly with price movements.
4. Theta (Θ): Time Decay of Options
Theta measures the sensitivity of an option’s price to the passage of time, assuming all other factors remain constant. Time decay is especially significant for options traders, as options lose value as expiration approaches.
Long options (buying calls or puts) have negative theta, meaning they lose value over time.
Short options (selling calls or puts) have positive theta, benefiting from the erosion of time value.
Theta is a critical factor in strategies such as calendar spreads or short straddles, where time decay can be exploited to generate profit.
5. Vega (ν): Sensitivity to Volatility
Vega measures an option’s sensitivity to changes in the volatility of the underlying asset. Volatility reflects market uncertainty; higher volatility increases the probability that an option will expire ITM, thus raising its premium.
Long options benefit from rising volatility (positive vega).
Short options benefit from declining volatility (negative vega).
Understanding vega is essential for strategies like straddles, strangles, and volatility spreads, where traders aim to profit from changes in implied volatility rather than directional price movements.
6. Rho (ρ): Sensitivity to Interest Rates
Rho measures the sensitivity of an option’s price to changes in the risk-free interest rate. While often overlooked in equity options due to low short-term interest rate fluctuations, rho becomes important for long-dated options (LEAPS) or currency options.
Call options increase in value with rising interest rates (positive rho).
Put options decrease in value with rising interest rates (negative rho).
Rho is generally less significant for short-term trading but critical for interest rate-sensitive instruments.
7. Combining Greeks for Holistic Risk Management
Individually, each Greek provides insight into one risk factor. However, professional traders consider them collectively to understand an option's total risk profile.
Delta addresses directional risk.
Gamma adjusts for changes in delta.
Theta manages time decay exposure.
Vega quantifies volatility risk.
Rho handles interest rate risk.
By monitoring these Greeks, traders can develop robust hedging strategies that dynamically adjust to market conditions.
8. Advanced Hedging Strategies
Hedging in options trading involves taking positions that offset risk in an underlying asset or portfolio. Advanced strategies often combine multiple Greeks to achieve delta-neutral, gamma-neutral, or vega-sensitive hedges, minimizing exposure to adverse market movements.
8.1 Delta-Neutral Hedging
Delta-neutral strategies aim to neutralize the directional exposure of a portfolio. Traders adjust their positions in the underlying asset or options to achieve a net delta of zero.
Example: Holding a long call option (delta = 0.6) and shorting 60 shares of the underlying stock (delta = -1 per share) results in a delta-neutral position.
Benefits: Protects against small price movements, ideal for traders who want to profit from volatility or time decay.
Limitations: Requires frequent rebalancing, especially with high gamma positions.
8.2 Gamma Hedging
Gamma hedging focuses on controlling the rate of change of delta. High gamma positions can result in delta swings, exposing traders to unexpected losses.
Traders achieve gamma neutrality by combining options with offsetting gamma values.
Example: A long ATM call (high gamma) may be hedged with OTM calls or puts to stabilize delta changes.
Benefits: Provides stability for delta-neutral portfolios.
Limitations: Complex to implement and can involve high transaction costs.
8.3 Vega Hedging
Vega hedging mitigates volatility risk. Traders who expect volatility to fall may sell options (short vega) while hedging long options (positive vega) to offset exposure.
Example: A trader long on an option may sell a different option with similar vega exposure to create a neutral vega position.
Benefits: Protects against unexpected spikes or drops in implied volatility.
Limitations: Requires deep understanding of options pricing and volatility behavior.
8.4 Theta Management and Calendar Spreads
Theta management involves leveraging time decay to generate income while maintaining a controlled risk profile.
Calendar spreads involve buying long-dated options and selling short-dated options on the same underlying asset.
Traders profit as the short-term option decays faster than the long-term option, benefiting from positive theta differential.
Benefits: Generates steady income and exploits time decay patterns.
Limitations: Sensitive to volatility changes, requiring careful vega management.
8.5 Multi-Greek Hedging
Professional traders often hedge portfolios using combinations of Greeks to achieve a multi-dimensional hedge.
Delta-Gamma-Vega Hedging: Neutralizes directional risk, delta swings, and volatility exposure simultaneously.
Useful for institutional traders managing large, complex portfolios where single-Greek hedges are insufficient.
Requires continuous monitoring and dynamic rebalancing to adapt to changing market conditions.
9. Practical Considerations in Hedging
While advanced Greek-based hedging strategies offer theoretical precision, practical implementation involves challenges:
Transaction Costs: Frequent rebalancing and multiple trades can reduce profitability.
Liquidity Risk: Some options may lack sufficient market liquidity, complicating execution.
Model Risk: Greeks are derived from mathematical models like Black-Scholes; real-world deviations can affect hedging effectiveness.
Market Gaps: Sudden, large price moves may bypass delta or gamma adjustments, leading to losses.
Traders must weigh the trade-offs between hedge precision and operational feasibility.
10. Real-World Applications
Option Greeks and hedging strategies are widely used in various contexts:
Institutional Portfolios: Delta-gamma-vega hedges protect large portfolios from market shocks.
Volatility Trading: Traders exploit implied vs. realized volatility differences using vega strategies.
Income Generation: Theta-positive strategies like covered calls and credit spreads provide steady cash flows.
Risk Management: Corporations with exposure to commodity prices or foreign exchange rates use option hedges to stabilize earnings.
11. Conclusion
Option Greeks are indispensable tools for understanding and managing the risks inherent in options trading. They provide a quantitative framework for measuring price sensitivity to underlying asset movements, time decay, volatility changes, and interest rates. Advanced hedging strategies leverage these Greeks to create positions that mitigate directional, volatility, and time-related risks.
While Greek-based hedging can be complex, the benefits are substantial: enhanced risk control, improved portfolio stability, and the ability to profit in diverse market conditions. Success requires a deep understanding of each Greek, continuous monitoring of market dynamics, and a disciplined approach to portfolio management. By mastering Option Greeks and advanced hedging strategies, traders gain a powerful edge in navigating the sophisticated world of derivatives trading.
XAUUSD: Profit-Taking Pressure Emerges XAUUSD: Profit-Taking Pressure Emerges - Trading Strategy as Gold Adjusts
Hello traders community,
Today's trading session witnessed a strong "Price Rejection" of XAUUSD at the new peak, triggering a nearly $20 drop. Although the long-term bullish structure remains intact, the profit-taking signal from buyers is evident. This article will delve into the analysis of key price zones and outline a detailed trading strategy in the context of the adjusting market.
📊 Technical Analysis
The H1 chart provides us with an overview of the current liquidity zones and price structure:
Fibonacci Resistance Zone: The price reacted strongly at the confluence of the 2.618 Fibonacci Extension levels, around the $4240 area. A strong bearish candle emerged right after the price touched this zone, confirming it as an extremely potential "Sell zone." Sellers have officially stepped in.
Point of Control (POC) and Liquidity: The Volume Profile (VPVR) indicator shows the area with the highest trading volume concentration (POC) is at $4196. This is the "magnet" zone attracting price in the short term. If the price recovers, this will be the decisive tug-of-war zone.
Key Support Zones:
$4196 (Buy Scalping): The POC zone acts as the first price support point. Scalping traders can look for short-term buying opportunities here.
$4158 (Buy Zone): This is a stronger support zone, the bottom of the previous uptrend, and also an area with significant trading volume. Buyers are likely to return strongly if the price adjusts here.
📰 Market Sentiment
Profit-Taking Pressure: After a hot growth streak, Gold's sharp drop of nearly $20 is a healthy adjustment move. The selling force mainly comes from short-term profit-taking traders.
"Sharks" Still Accumulating: Notably, while the price adjusts, the world's largest gold ETF, SPDR Gold Trust, increased its gold holdings by 1.15 tonnes. This move shows that large institutions remain optimistic about Gold's long-term prospects and are taking advantage of the dip to accumulate more. This is a signal contrary to short-term price action, which traders need to pay special attention to.
🎯 Actionable Trading Plan
With the current technical signals and market sentiment, we prioritize the strategy of selling when the price recovers (Sell the Rally).
Scenario 1: Sell on Downtrend (Sell) 📉
Entry Zone: Wait for the price to recover to the $4228 zone. This is the "retest" area of the liquidity zone previously controlled by sellers.
Stop Loss: $4235, above the nearest minor peak.
Take Profit: $4210 - $4188 - $4165 - $4133.
Scenario 2: Buy at Strong Support (Buy) 📈
Entry Zone: If the price continues to drop, look to buy at the "Buy zone" $4158.
Stop Loss: $4150, a safe level below the support zone.
Take Profit: $4173 - $4190 - $4205 - $4230.
Scenario 3: Short-Term Scalping (Scalping Buy) ⚡️
Entry Zone: Quick buy at the POC zone $4196.
Stop Loss: $4188, a short and tight stop loss level.
Take Profit: $4210 - $4228.
Summary
In the short term, sellers are temporarily dominant after Gold failed to conquer the $4240 resistance zone. The main strategy is to sell when the price recovers. However, the buying action of the SPDR fund indicates that the medium and long-term uptrend remains very solid. Therefore, buying orders at strong support zones like $4158 are also an opportunity not to be missed.
Trade with discipline and manage your capital tightly. Wishing all traders an effective trading day!
Note: This analysis is based on personal views and is for reference purposes only, not direct investment advice.

XAUUSD – Safe-Haven Flows Continue to Support GoldMarket Context:
Gold has attracted strong buying for the fourth consecutive session, supported by a mix of global risk factors: renewed US–China trade tensions, rising geopolitical uncertainty, and growing fears of a prolonged US government shutdown.
Meanwhile, dovish expectations from the Federal Reserve are keeping the USD under pressure — further enhancing the appeal of gold as a non-yielding safe-haven asset.
During the Asian session, XAU/USD printed a fresh all-time high, with bulls now eyeing a potential extension toward the 4,200 USD/oz region amid escalating global concerns.
Technical Outlook (M30):
Gold continues to respect its ascending channel structure, maintaining dynamic support between 4,167 – 4,154.
As long as price holds above 4,139, the broader trend remains bullish, with the next liquidity target sitting at 4,240 – 4,241.
Key Zones to Watch:
Liquidity Sell Zone: 4,240 – 4,242
ATH Zone / Short-Term Resistance: 4,190 – 4,200
OBS Buy Zone – CP Trendline Support: 4,141 – 4,139
Secondary Buy Zone: 4,114 – 4,112
Trading Plan:
🔹 BUY Zone
Entry: 4.141 – 4.139
SL: 4.134
TP: 4.145 → 4.150 → 4.155 → 4.160 → 4.170 → 4.180
🔹 BUY Zone
Entry: 4.114 – 4.112
SL: 4.106
TP: 4.120 → 4.125 → 4.130 → 4.140 → 4.150
🔹 SELL Zone (Scalp Reaction)
Entry: 4.240 – 4.242
SL: 4.248
TP: 4.235 → 4.230 → 4.225 → 4.220 → 4.210 → 4.200
Summary:
The bullish market structure remains intact as long as price holds above the 4,139 zone.
Watch for potential long opportunities from 4,141 – 4,139, where the confluence of trendline and order block support could trigger fresh demand.
Bulls remain in control, targeting the 4,240 – 4,241 liquidity area in the coming sessions.
📊 What’s your take — will gold break above 4,200 or pause for a correction first?
👉 Follow MMFLOW TRADING for daily market structure insights and institutional-style setups.
🟣 Chart: XAUUSD M30 – Smart Money Flow structure highlighting liquidity pools, CP confluence and key buy/sell zones.

Gold as said earlier buy on dip 4245-4260 this week target Gold maximum target on upside dome for current week now wait for dip then buy
How My Harmonic pattern projection Indicator work is explained below :
Recent High or Low :
D-0% is our recent low or high
Profit booking zone ( Early / Risky entry) : D 13.2% -D 16.1 % is
range if break them profit booking start on uptrend or downtrend but only profit booking, trend not changed
SL reversal zone (Safe entry ) : SL 23.1% and SL 25.5% is reversal zone if break then trend reverse and we can take reverse trade
Target : T1, T2, T3, T4 and .
Are our Target zone
Any Upside or downside level will activate only if break 1st level then 2nd will be active if break 2nd then 3rd will be active.
Total we have 7 important level which are support and resistance area
Until , 16% not break uptrend will continue if break then profit booking will start.
If break 25% then fresh downtrend will start then T1, T2,T3 will activate
1,3,5,10,15,20 minutes are short term levels.
30 minutes 60 minutes , 2 hours,3 hours, ... 1 day and 1 week chart positional and long term levels

Elliott Wave Analysis – XAUUSD (16/10/2025)
🔹 MOMENTUM
D1:
Currently, the daily momentum has formed five consecutive bullish candles and is now approaching the overbought zone.
👉 This indicates a high probability of a correction within the next 1–2 days.
H4:
Momentum on H4 is still rising.
Today, the price may continue to climb slightly or move sideways to push H4 momentum into the overbought zone before a potential reversal.
H1:
Momentum on H1 is also nearing the overbought zone, suggesting that a short-term pullback could occur during the Asian session.
________________________________________
🔹 WAVE STRUCTURE
D1 Chart:
The structure remains within an extended Wave (5).
With D1 momentum about to enter the overbought area and this bullish phase already lasting for five candles, there is a strong chance of a correction today or tomorrow.
H4 Chart:
The price is currently in orange Wave (5), while purple Wave (3) is still unfolding.
Since H4 momentum is rising, price may extend slightly higher or consolidate sideways before a possible reversal.
H1 Chart:
Price is now in yellow Wave (5), where five minor blue waves have been completed.
The price zone around 4242.89 corresponds to the 0.618 Fibonacci retracement of blue Waves 1–3.
Within blue Wave (5), we can also count five smaller black sub-waves, and interestingly, 4242.89 again aligns with the 0.618 Fibonacci level of black Waves 1–3.
➡️ This creates a strong resistance area, from which a deep correction forming purple Wave (4) is highly possible.
________________________________________
🔹 TRADING PLAN
• Avoid holding long positions for too long — this stage is best suited for short-term scalp trades.
• Focus on observing price action and waiting for a confirmed top formation before planning any Swing setups.
• Sometimes, staying on the sidelines is the best strategy.
👉 I will update the Swing signal once a clearer confirmation appears.

XAU/USD – Buyers Reclaim Structure, Targeting Liquidity Zone🔍 Market Context
After a strong Liquidity Sweep yesterday, gold has rebounded and formed consecutive Break of Structure (BoS) , confirming buyers have regained control.
The price has now filled the Fair Value Gap (FVG 4,191 – 4,202) and is heading towards the Sell Liquidity Zone 4,237 – 4,240 USD — a concentration of pending sell orders and stop-losses from previous short positions.
The current structure shows strong bullish momentum , however, the possibility of a correction from this high liquidity area is noteworthy.
💎 Technical Analysis
Liquidity Sweep: Completed, clearing liquidity below 4,070.
FVG (Fair Value Gap): 4,191 – 4,202 → filled, confirming price balance.
Sell Liquidity Zone: 4,237 – 4,240 → potential resistance zone, likely strong reaction.
OB Zone | Buy: 4,143 – 4,145 → nearby support, expected first reaction when price corrects.
OB Deep | Buy: 4,110 – 4,115 → deep demand zone, confluence with Premium Zone 4,156 – 4,118.
Overall Structure: The main trend remains bullish , with strong upward momentum but requires a technical correction for re-accumulation.
📈 Trading Scenarios
1️⃣ Main Scenario – Sell reaction at liquidity zone
When the price approaches the Sell Liquidity Zone 4,237 – 4,240 USD , observe candlestick reaction (rejection, bearish engulfing).
If confirmation signals appear, open a short-term sell order .
Target: OB Buy Zone 4,145 → 4,110 USD.
Stop Loss: above 4,245 USD.
➡️ This is a liquidity reaction setup, high probability when the market encounters resistance confluence with Fibonacci zone 0.786–1.0.
2️⃣ Alternative Scenario – Buy with trend from OB
If the price corrects to the OB Zone 4,143 – 4,145 USD and shows a clear reaction (strong rejection or minor structure break),
→ a buy with the main trend can be opened.
Target: return to 4,200 → 4,235 USD.
Stop Loss: below 4,130 USD.
If the price drops further, the OB Deep Buy 4,110 – 4,115 USD will be the final “liquidity attraction” zone for a new upward bounce.
⚠️ Risk Management
Avoid FOMO buying at 4,200+ as it is near the liquidity resistance zone.
Prioritise short-term sell at 4,237 if clear signals are present.
When price corrects to OB, wait for reaction before buying, do not bottom fish early.
💬 Conclusion
After completing the liquidity sweep, gold has confirmed a return to bullish structure with multiple consecutive BoS.
Currently, the price is approaching the liquidity zone 4,237 USD – a short-term correction is highly likely.
The 4,145 – 4,110 USD zone will be where buyers await reaction to accumulate orders and continue the medium-term uptrend.
👉 Reasonable Strategy:
Short sell at 4,237 USD if reversal signals are present.
Wait to buy at OB zone 4,145 – 4,110 USD when clear reaction occurs.

Gold Bulls Unstoppable Another All-Time High! Gold continues its unstoppable march north, printing fresh all time highs almost daily. Despite a brief shakeout over the past couple of sessions, buyers stepped in aggressively, confirming strong demand on every dip.
From a technical perspective, the uptrend remains firmly intact. Price is comfortably holding above the 4,200 zone, which now acts as immediate support. The volume profile shows a significant cluster around 4,190–4,205, indicating strong buying interest in this area this is the level to watch for short term structure.
On the fundamental side, the macro backdrop continues to support gold: geopolitical tensions, central bank accumulation, and lingering inflation expectations all add fuel to the rally.
Bulls are clearly in control, and as long as gold sustains above 4,200, the path of remains up also watch two rising trendline carefully in case of breakdown we can expect pullback ., the move is getting a bit extended, so we have be cautious with fresh entries at these stretched levels.

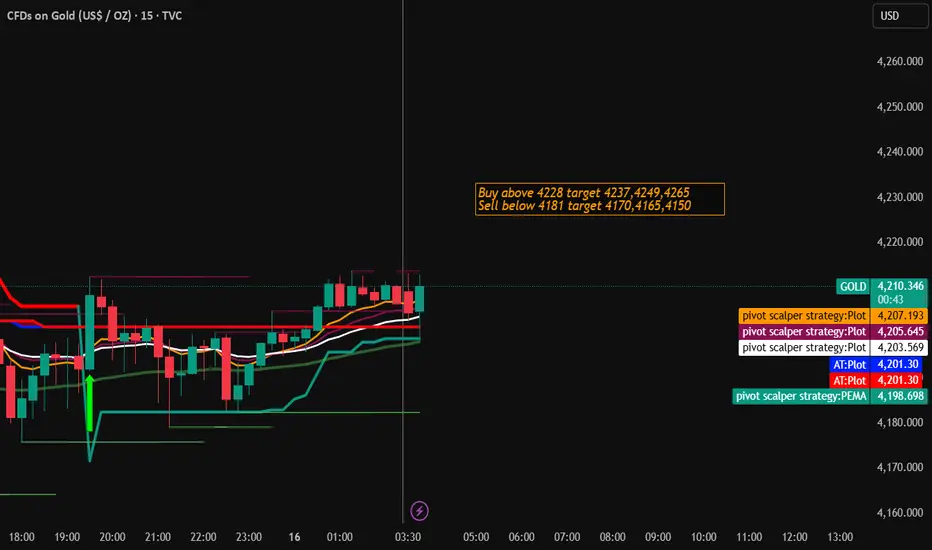
Gold Trading Strategy for 16th October 2025🟡 GOLD TRADING STRATEGY (INTRADAY SETUP)
💰 Buy Setup:
🔹 Entry: Above the high of 15-min candle (only if candle closes above $4228)
🎯 Targets:
1st Target → $4237
2nd Target → $4249
3rd Target → $4265
🛡️ Stop Loss: Below $4218 (or previous candle low)
🔻 Sell Setup:
🔹 Entry: Below the low of 1-hour candle (only if candle closes below $4181)
🎯 Targets:
1st Target → $4170
2nd Target → $4165
3rd Target → $4150
🛡️ Stop Loss: Above $4190 (or previous candle high)
⚙️ Strategy Notes:
📈 Wait for candle confirmation on closing basis before entering.
📊 Follow strict risk management — avoid over-leveraging.
⏰ Works best during London–US session overlap for high volatility.
⚠️ Disclaimer:
This analysis is for educational and informational purposes only. It does not constitute financial advice or trading recommendations. Trading in commodities like Gold (XAU/USD) involves risk of capital loss. Always perform your own analysis or consult your financial advisor before executing any trade.
Gold trading strategy | October 15-16✅ From the 4-hour chart: Gold is currently trading between the midline and upper boundary of the ascending channel, with the overall trend still dominated by the bulls. The moving averages (MA5, MA10, MA20) remain in a bullish alignment, confirming an upward trend in the short to medium term. However, since the candlesticks have been bullish for several consecutive sessions, there is some short-term technical correction pressure.
The Bollinger Bands continue to expand upward, with the upper band around 4246. The price is moving near the upper band, showing a strong consolidation phase. The middle band (around 4122) provides interim support, while the lower band (around 3999) serves as the major bullish defense zone.
Gold is expected to consolidate within the 4170–4240 range before deciding its next direction.
✅ From the 1-hour chart: After reaching the 4218 high, gold quickly pulled back and is now oscillating between 4190–4205. The MA5 and MA10 have flattened, indicating weakening short-term momentum. The MA20 (around 4192) acts as current support, and price is fluctuating around this area.
The Bollinger Bands are slightly narrowing, suggesting reduced volatility in the short term. The middle band (around 4192) serves as the key pivot level—if broken, the price may retest the 4170 region.
Overall, the structure remains strongly consolidative, with a tendency to rebound upward after a pullback. As long as 4150 remains unbroken, gold still has potential for another upward move. A break below 4150, however, could trigger a deeper short-term correction.
🔴 Resistance Levels: 4225–4235
🟢 Support Levels: 4165–4175
✅ Trading Strategy Reference:
🔰 If gold pulls back to the 4165–4175 area and holds, consider entering long positions in batches.
🎯 Targets: 4200 / 4218
🔰 If the price rebounds to the 4225–4235 zone and faces resistance, consider a light short position.
🎯 Targets: 4170–4160
🔥Trading Reminder: Trading strategies are time-sensitive, and market conditions can change rapidly. Please adjust your trading plan based on real-time market conditions.

XAUUSD DOWNSIDE VIEW confirmations aligned for a potential bearish move:
✅ Volume analysis completed
✅ Trendline breakout confirmed
✅ Channel breakout confirmed
✅ Candle confirmation done
Now it’s time to wait patiently for price action to unfold.
⚠️ Important news ahead — expect high volatility, manage risk carefully.

Gold Next? Up or DownHello traders, here is my another analysis about gold where you can see dofference b/w candle chart and line chart.
As you can see its line chart of monthly tf where we can see price is in circle wave 3, and making 3 of 3, so in my opinion price will drop down for 4 of 3 and then price will go for 5 of 3, wave 4 of 3 is not found yet so i will not say that price is in 5 of 3,corection should visible on line chart very obvious but still not, correction is must its not my wish its chart requirment.
Its my opinion and idea not trading advise so please plan your trades according to your analysis. good luck and best wishes to all traders.

XAUUSD 1H Buy Limit Projection — 15.10.25🟡 Overall Setup
This is a 1-hour timeframe projection chart for XAUUSD (Gold vs USD). The market is currently in a strong uptrend, moving inside an ascending channel (blue trendline).
The price at the time of projection: $4,198.76
🧭 Key Zones & Plan
Entry Zone (Buy Limit):
Marked at $2203–$2206 (FVG zone — Fair Value Gap).
The chart suggests to wait for breakout and retest of the yellow zone before buying.
Support Zone:
Highlighted in yellow box, indicating strong demand area where the breakout is expected to happen.
“CANDLE MOVEMENT AREA” below shows the probable pullback path.
Trade Timing:
Suggested after 11:30 AM (October 15).
Waiting for structure confirmation before entry.
🏁 Target Levels
TP 1: Around $4,228 – $4,243 (0.5–0.618 Fibonacci zone).
TP 2: Around $4,320, which is the top of the ascending structure.
⚠️ Stop Loss Zone
SL is placed below $4,165, under the yellow demand zone.
Protects against false breakout.
📈 Price Movement Projection
The black line arrows project the expected retracement down to entry zone, then bullish breakout and rally upward toward target zones.
Trend continuation is expected until tomorrow with breakout & retest.
✅ Summary of Strategy:
Trend: Bullish
Action: Buy at retest zone (2203–2206)
TP: 4243 (TP1) / 4320 (TP2)
SL: Below 4165
Timing: After 11:30 AM IST

XAUUSD | Gold Holds Firm as Buyers Dominate the MarketGold continues to demonstrate a strong and orderly bullish structure, with momentum sustained by a combination of market confidence and macroeconomic positioning. The metal’s consistent upward drive reflects ongoing demand for safety amid lingering inflationary concerns and uncertainty surrounding global economic recovery. Institutional accumulation remains visible, suggesting that investors are positioning ahead of potential policy adjustments and currency fluctuations.
The recent moderation phase appears to be a controlled pause rather than weakness, indicating that buyers are maintaining control while the market digests prior gains. Should current stability in yields persist and geopolitical tensions remain elevated, gold could extend its advance in the medium term, reaffirming its role as a key hedge within diversified portfolios.

XAUUSD // Liquidity Grab // ATH# Gold Spot / U.S. Dollar - Liquidity Analysis
Market Structure Analysis
Key Liquidity Zones Identified
The chart highlights two critical liquidity zones where significant price action is anticipated:
**Upper Liquidity Zone: $4,212 - $4,219**
This zone represents an area of accumulated buy-side liquidity, typically formed by stop-losses from short positions and buy-stop orders. The red shaded area indicates where institutional players may target for liquidity capture before potential reversals.
**Lower Liquidity Zone: $4,157 - $4,162**
This zone marks the sell-side liquidity area, where stop-losses from long positions and sell-stop orders cluster. This level serves as a potential magnet for price action seeking to capture liquidity before any significant directional move.
Technical Setup
**Channel Pattern**
Gold is currently trading within a well-defined ascending channel on the intraday timeframe. The parallel trend lines show:
- Consistent higher highs and higher lows
- Price currently positioned in the mid-range of the channel
- Recent bounce from the lower channel boundary
**Demand Zone**
A marked demand zone is visible at lower levels, indicating previous buying interest and potential support.
Price Action Scenarios
Bullish Scenario (Green Path):
If price maintains support at current levels or the lower demand zone, we could see:
1. Continuation toward the upper liquidity zone ($4,219)
2. Potential liquidity sweep above this zone
3. Possible rejection after capturing buy-side liquidity
Bearish Scenario (Red Path):
If price fails to hold current structure:
1. Drop toward the lower liquidity zone ($4,162)
2. Liquidity grab below this level
3. Potential reversal after capturing sell-side liquidity
#Liquidity Concept
The annotation "Liquidity !!!!!!" emphasizes the importance of these zones. In institutional trading theory, price often moves to areas of high liquidity (where stop-losses cluster) before making significant directional moves. This is commonly referred to as a "liquidity sweep" or "stop hunt."
Trading Considerations
When price approaches either liquidity zone, traders should watch for:
- Rejection wicks suggesting liquidity capture completion
- Break and retest patterns for confirmation
- Changes in momentum indicators
Risk Management Notes
- The 5-minute timeframe requires precise execution and tight risk management
- Liquidity zones can be quickly swept through in volatile conditions
- Always use appropriate position sizing relative to account risk tolerance
- Consider wider timeframe context for overall trend direction
Disclaimer
This analysis is provided for educational purposes only and represents a technical perspective on price structure and liquidity zones.
It is not financial advice or a recommendation to buy or sell. Gold trading involves substantial risk of loss. Always conduct your own research, use proper risk management, and consider consulting with a qualified financial advisor before making trading decisions.

Markets Brace for U.S. Retail Sales & Fed Volatility XAUUSD – Intraday Trading Plan | by Ryan_TitanTrader
📈 Market Context
Gold prices hover near ₹4,190 after an early-week rally as traders brace for U.S. Retail Sales data and a new round of Federal Reserve speeches later today.
Recent gains were fueled by softer inflation readings, yet the dollar remains resilient amid hawkish undertones from Fed officials. Markets are now balancing between expectations of slower growth and persistent rate-cut caution.
A stronger-than-expected Retail Sales print could pressure gold temporarily, but any dovish signal from Fed speakers may quickly restore bullish momentum. Expect liquidity hunts on both sides before a confirmed direction forms.
🔎 Technical Analysis (1H / SMC Style)
• Structure remains bullish after multiple Breaks of Structure (BOS) and a recent Change of Character (ChoCH) confirmation.
• Price is approaching the Premium Zone (4211–4209) — a potential liquidity sweep area where short-term sellers may react.
• Below, the H1 FVG Buy Zone (4145–4149) offers a discount entry aligned with recent BOS support and previous mitigation points.
• Maintaining a bullish bias while awaiting clean reaction within the FVG zone is key for continuation toward new highs.
🔴 Sell Setup: 4211 – 4209
SL: 4218
TP targets: 4190 → 4175 → 4155
🟢 Buy Setup: 4145 – 4147
SL: 4138
TP targets: 4170 → 4190 → 4220+
⚠️ Risk Management Tips
• Wait for M15 ChoCH/BOS confirmation before entry to avoid false breaks.
• Expect high volatility around Retail Sales and Fed remarks — spread widening is likely.
• Partial take-profits near intra-day liquidity points are recommended.
✅ Summary
XAUUSD remains bullish on structure but faces a potential liquidity grab around 4211–4209 before retracing into the H1 FVG buy zone (4145–4149).
Smart money may seek to accumulate long positions after a controlled pullback, especially if Fed commentary echoes a slower policy tightening path.
Intraday bias leans Buy the Dip, with caution around macro-driven volatility spikes.

October 15th Gold and Forex AnalysisOctober 15th Gold and Forex Analysis
Viewpoint: The current international spot gold price is around 4190. Today's high of 4218 represents a $76 increase from the previous trading day. While the increase is not significant compared to the past few days, this surge was driven by Powell's remarks and the continued US government shutdown. The current market rally may be accelerating, or it could be the final frenzy (due to sudden negative news). I would like to remind everyone to set a stop-loss order to protect your principal.
Technical Analysis
Daily Chart Level: Following an Upward Cycle
1. Trend and Rhythm: The daily chart closed with a full, large bullish candlestick, confirming a strong bullish pattern. The market is currently following a typical upward cycle: consecutive rising highs -> consolidation at high levels -> a single bearish pullback -> continued upward momentum.
2. Key Positions:
Resistance: The current price has broken through the previous high, and there is currently no clear resistance above. Focus on inertial upward momentum. Support: 4100 (the 5-day moving average moving up tomorrow) has become the core lifeline of the current bullish trend. The second highest support level is 4050 (the 10-day moving average).
3. Future Forecast:
Today (Wednesday) is likely to see another positive close, continuing the strong trend.
Tomorrow (Thursday), be highly alert to the possibility of a single-day bearish pullback, targeting a test of the 5-day moving average support level near 4100 yuan/gram.
If a pullback occurs, it should be viewed as a "squat and jump" opportunity, a rare opportunity to enter the market at a low point within the trend.
4-Hour Level: Keep a close eye on the moving average support.
1. Current Trend: This cycle exhibits a "consecutive bullish and single-day bearish" pattern of forced gains, with the moving average system showing a perfect bullish alignment.
2. Dynamic Support:
Strong Support: 4180 (the current 5-period moving average). As long as the price remains above this line, the market remains extremely strong.
Key Support: 4156 (the current 10-period moving average). This is a short-term watershed between bulls and bears. Only a significant break below this level would signal the end of this short squeeze rally, ushering in a deep correction toward the middle band.
Note: The above support levels will shift upward rapidly over time and require dynamic tracking.
Hourly Level: High-Level Oscillation
1. Intraday Trend Review: The strong rally in the Asian session exceeded expectations. After accurately touching 4218 (the upper band of the hourly chart channel) in the European session, the price plummeted to 4165 before rebounding, confirming the effectiveness of the channel resistance.
2. Night Trading Range:
Upper Resistance: 4220 - 4225 (derivative of the upper band of the channel). If this area is touched, monitor for signs of resistance and attempt a short-term short position.
Lower Support: 4170 (the middle band of the hourly chart and the previous channel retracement point). If it falls back to this area, monitor for signs of stabilization, using it as an entry point for intraday long positions.
Strategy: The market is likely to fluctuate strongly at high levels. We recommend looking for opportunities to buy low and sell high near resistance and support levels, focusing on short-term trading.
Trade with caution and manage risk. Best of luck!
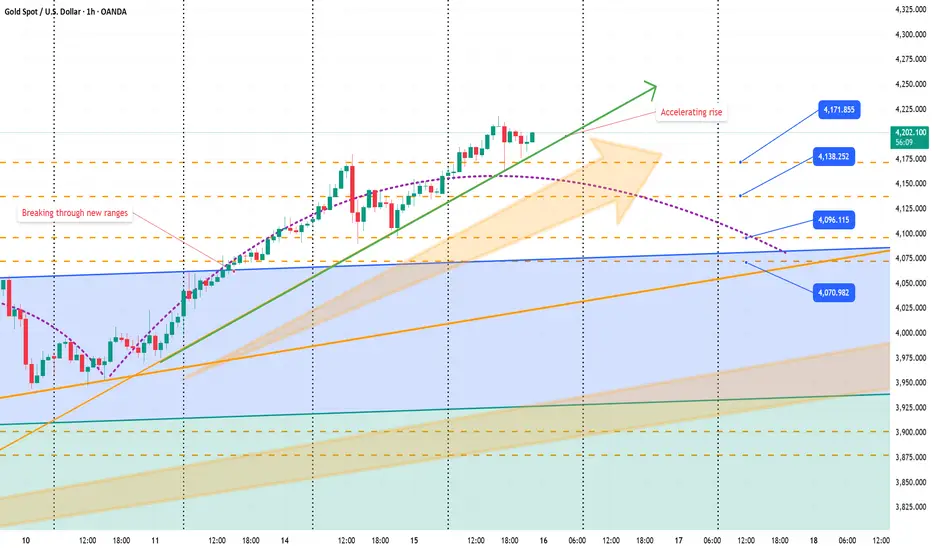
Gold Pullback Opportunity Within Strong Bullish MomentumAnalysis:
The XAU/USD chart shows that gold has maintained a powerful upward trajectory, breaking out of its previous consolidation channel (highlighted in purple). After the breakout, price surged to new highs near 4,120, confirming strong bullish momentum.
Currently, the market is showing a minor pullback toward the 4,090–4,060 zone — a region aligning with previous resistance turned support. This retracement appears healthy and could provide buyers a chance to re-enter before another leg up.
The bullish continuation setup is supported by:
Previous breakout retest: The price is testing the prior resistance area, which could now act as strong support.
Momentum structure: Higher highs and higher lows remain intact.
Favorable risk-reward ratio: The long position targets around 4,180, with stops below 4,060 support.

Gold Rallies to $4218 As Bulls Eyeing for $4250-$4300Gold continues to establish new record high as the prevailing bullish rally maintains sequential Higher High-Higher Low structure as all stars seem to be in collusion to boost Gold prices in a seemingly unstoppable rally until initial signs of exhaustion begin to appear.
Asian session began with strength and European session witnessed rally extending to new record high at $4218 followed by a quick drop to $4165 which was again quickly absorbed by liquidity hunters resulting in bounce back off the lows rebounding to $4206
For now, bullish momentum remains intact supported by price stability above $4165 while strong break and follow up stability above $4220 will resume upside to advance towards next overhead extension $4235 opening the way to accomplish next leg higher $4250 & $4270 followed by $4300
Fundamental Drivers:
.Markets are pricing the growing expectations of at least two cuts in key interest rate by the Federal Reserve for this year which is bolstering Gold prices at present. Any dovish tilt will lower the real yields boosting Gold prices.
.Dollar Index struggles below 200 Day SMA 99.70 as dollar demand loses grip pushing the index to 98.70
.Lingering US Government shutdown shows no signs of agreement in Congress to resolve the deadlock increasing the chaos in administration and causing further concerns among investors.
.Geo political instability in various countries is worsening the crisis situation and increasing the political risks as well as fiscal concerns.
.Central banks (Peoples Bank of China in particular) continue accumulating Gold to reserves in a strategic move to ward off the risks of dollar dependence as the US grapples with its ever mounting national debt of $37 trillion and its debt servicing getting more difficult.
.Frequent volatility in global stocks and indices create sense of fear and uncertainty among global investors driving smart money flow towards more trusted investment in Gold which has proven its store of value in times of crisis.
.ETF inflow keeps rising at record pace, boosting structural demand and prices of Gold.
.CTAs as well as leading Banks have been revising bullish forecasts further up which instils confidence among Gold investors and a significant sense of FOMO is driving Gold prices in record run that seems unstoppable at least for the time being as any price pullback is quickly being bought leading to yet another higher high-higher low structure, keeping the prevailing bullish momentum intact.
.Trade tariff escalations resume with The US President Donald J Trump announcing additional 100% tariff on China, over and above the 30% tariff already in place which has reignited the simmering tensions.
Technical Drivers:
.The Gold price momentum is currently in a strong bullish structure, confirmed by a clear sequence of Higher Highs (HH) and Higher Lows (HL).The price reaction to pullback towards local demand zone $4165 ,that aligns with 30 minute 50 EMA, a strong buying intervention has been noticed rebounding to immediate resistance $4206 implying a break above preceding hurdle (Break of Structure).
The current sideways price behaviour is a consolidation before breakout and goal scoring between buy side liquidity and sell side liquidity.
The current consolidation phase may be an attempt to seek additional liquidity and order flows before deciding on next bullish extension towards $4235-$4250-$4270
.If Gold fails to clear above $4206, the zone that capped gains of recent bounce off the lows of $4165, or gets rejection/fails to clear through $4218, a selling pressure may be witnessed retesting $4165 below which $4155-$4150 followed by 1 hourly 50 EMA at $4135 is likely. This zone may again accumulate defensive longs before resuming impulsive move which is conditioned by presence of a bullish price formation such as Change of Character(COCH) or Break of Structure(BOS).
Bullish Scenario:
If Gold succeeds clearing through intraday high and immediate resistance zone $4218-$4220, expect further advance towards next Fibonacci extension $4235 followed by $4250-$4270 while major resistance could be psychological benchmark $4300
Bearish Scenario:
Failure to break above or rejection from $4218-$4220 immediate resistance will resume selling and profit booking led selling to revisit $4165 below which next support sits at $4250 and 1 hourly 50 EMA $4135 while major support sits at $4080 - $4035
Overall Outlook:
The prevailing price action and stability above 1 Hourly 50 EMA $4165 suggests bullish momentum and a decisive break above $4220 will call for further bullish move to continue advance towards $4250-$4270-$4300
However, heights and record highs are mostly news sensitive and very prone to flash crash which urges caution on heights as any news may trigger massive sell off at the drop of a hat.
It is highly recommended to exercise strict risk management, position sizing and remain updated with the latest news developments to avoid ugly surprises.

GOLD AT ATH! $4,200 BATTLE – Which Fibo Zone Fires First?Gold is fiercely battling the $4,200 mark after hitting a new All-Time High near $4,220. Bulls are pausing, but macro risks (geopolitics, trade war warnings) keep the trend Long. Our focus: Sniping the Reaction Zones.
🎯 THE FIBO ACTION ZONES (H1/M30)
1. STRATEGIC BUY ZONE (Optimal Long Entry):
Zone 1: 4162 - 4158 (The crucial Fibo Retest/0.618 support).
Zone 2: 4144 - 4140 (Deeper strong support).
Action: Wait for the pullback into 4162 - 4158 and execute a BUY upon bullish confirmation.
2. SELL/TP ZONES (Profit Taking & Resistance):
TP Target 1: 4208 - 4212 (Immediate Fibo Resistance).
TP Target 2: 4225 - 4250 (Fibo Extension 1.5 - 1.618).
Action: Look for SCALP SELL opportunities or take profits (TP) here if price rejects these levels.
📈 TODAY'S MOVE: Patience for the 416x retest. Join the Long trend aggressively only after a solid bounce confirmation!
⚠️ Risk Management: Keep SL tight below your chosen BUY Zone. Discipline over FOMO!

Explaining the seller trap in XAUUSD/GOLDIt is an explanatory video about how sellers are trapped between market rumours and profit booking phases.
The gold chart is a classic example of this in the current scenario, where everyone is waiting to short Gold and gets trapped in the resulting volume.
Be careful with the trade setups.
I have mentioned the clear range of bullish and bearish continuation.

XAUUSD - TP hit _ 15/10/25Overall trend bullish
1. Candle broke out of the resistance
2. retested back to resistance and confirmed support
3. Entered during bottom wick
4. Closed full at TP level ( round level 4200 )

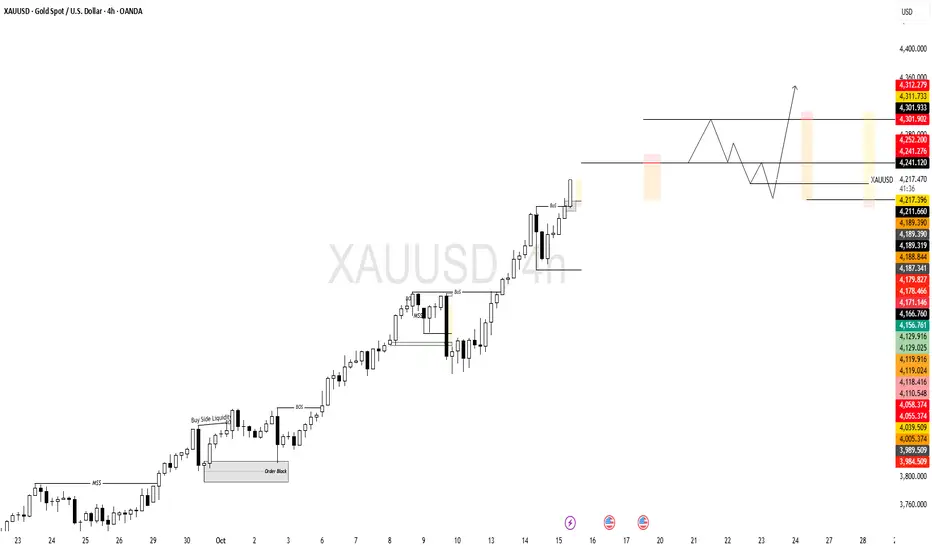
This is a technical analysis chart for Gold (XAUUSD) on a 4-hourChart Analysis
Bullish Trend: The market is in a clear uptrend. This is shown by the series of "BOS" or Break of Structure points, where the price consistently breaks above previous highs, creating higher highs and higher lows.
Liquidity Sweep: The label "Buy Side Liquidity" points to a previous high. The price moved above this level, likely triggering stop-loss orders from sellers and attracting new buyers, which fueled the subsequent upward move.
Order Block: An "Order Block" (the last down-candle before a strong upward move) is marked. These zones are often seen as strong areas of demand where institutions have placed large orders.
Recent Break of Structure: The most recent price action shows another strong "BOS," confirming the continuation of bullish momentum.
a pullback before the next move higher.
Create a New High: The price is expected to make a small push up to establish a new peak.
Pullback to Demand: The projection shows the price then pulling back down into the area of the previous high that was just broken (highlighted with the yellow box). This area is now expected to act as a support or demand zone. Traders anticipate that buyers will step in at this level.
Consolidation: Price may bounce around in this zone for a short period as buyers accumulate positions.
Continuation Upward: After finding support, the price is projected to resume its uptrend, breaking the recently created high and continuing its move up (as indicated by the red arrow).