Bullish sentiments on goldWe're in an uptrend so today we're trading from an h1 fvg targeting the opposite external liquidity....since London session we expect to see a continuation to the target.
Trade ideas
XAUUSD | Bulls Hold Control Above 4070 - Eyes on 4090–4100 ZoneGold (XAUUSD) continues to show strong bullish structure, and price action above the 4070 key support reinforces buyers’ dominance.
If price sustains above this level, the next upside liquidity area sits at 4090–4100 , a zone where previous reactions have occurred.
Bullish Scenario:
Holding above 4070 keeps momentum pointed toward 4082 and then the 4090 zone.
The bullish outlook remains valid as long as price stays above 4059, which currently acts as intraday invalidation.
What I’m Watching:
A clean intraday consolidation above 4070
Momentum strength into 4082
Whether buyers can break into the 4090–4100 resistance pocket
This setup highlights how the market could behave, not financial advice—just educational analysis.
📌 Disclaimer:
This analysis is for educational purposes only and is not financial advice. Always manage risk and follow your trading plan.
Your feedback drives our content and keeps everyone trading smarter. Let’s make those pips together! 🚀
Happy Trading,
– The InvestPro Team

Elliott Wave Analysis – XAUUSD (18 November 2025)1️⃣ Momentum
D1 Timeframe:
D1 momentum is approaching the oversold zone, signaling that a potential reversal may be forming.
Although this does not confirm a daily reversal yet, it is an early warning that bearish momentum may be weakening soon.
H4 Timeframe:
H4 momentum is also nearing the oversold zone, suggesting that a reversal or recovery bounce could appear shortly.
H1 Timeframe:
H1 momentum is beginning to turn upward, indicating that in the short term we can expect a bullish pullback on the H1 timeframe.
________________________________________
2️⃣ Wave Structure
D1 Wave Structure:
Price is currently still moving inside wave Y.
With D1 momentum entering the oversold zone, we do not have a confirmed reversal yet, but it alerts us to the rising probability of one forming soon.
Wave W previously took 8 days to complete. Since momentum cycles often form in 5–8 daily candles, this time structure can be used as a reference when observing the development of wave Y, as waves W and Y tend to share similar timing characteristics.
________________________________________
H4 Wave Structure:
On H4, a 5-wave sequence (blue) has completed, and price is currently in wave 5.
Combined with D1 momentum nearing oversold, this leads to three possible scenarios:
1️⃣ Scenario 1:
This 5-wave decline is wave (1) of a larger 5-wave structure inside purple wave Y.
If so, once wave (5) finishes, we will see a wave (2) pullback, aligning with the upcoming D1 momentum reversal.
2️⃣ Scenario 2:
Wave Y may end earlier than expected, failing to reach the 3746 target.
If this occurs, a new trend could begin sooner, coinciding with the next D1 momentum reversal.
3️⃣ Scenario 3:
D1 momentum enters the oversold zone but remains compressed there, dragging price lower for a deeper extension before any reversal happens.
These three possibilities help guide our chart observation and prepare for multiple outcomes.
________________________________________
H1 Wave Structure:
On H1, price is also forming a 5-wave decline (blue) and is currently in wave 5.
The projected target for wave 5 is around 3958, which is where we expect a Buy setup.
Additionally, RSI is showing bullish divergence across the lows, reinforcing the probability that price is completing wave 5 and preparing for a short-term bounce.
________________________________________
3️⃣ Trade Plan
• Buy Zone: 3959 – 3957
• Stop Loss: 3938
• TP1: 4000
• TP2: 4096
• TP3: 4145

Part 3 Learn Institutional Trading Option Buyers
Pay premium.
Have limited risk (premium loss).
Have unlimited profit potential (in theory).
Bet on directional moves.
Option Sellers (Writers)
Receive premium upfront.
Have limited reward (premium earned).
Can face significant or unlimited risk.
Bet on time decay, sideways markets, or low volatility.

LiamTrading – XAUUSD H1 | Gold on a downward trend, hitting ...💛 LiamTrading – XAUUSD H1 | Gold on a downward trend, hitting strong support around 4005 🎯
Gold has plunged from its peak, currently “visiting” the 4005–3990 zone, where trendline + POC/OB + high liquidity converge. This is a zone where a technical rebound might occur, but the short-term trend remains bearish, so any BUY orders need to wait for clear confirmation.
🔍 Fundamental Analysis
Goldman Sachs forecasts that during 2025–2026, central banks will purchase an average of ~80 tons of gold per month, a significant driver that could push gold towards 4,900 USD/oz by the end of 2026.
This keeps the long-term trend of gold bullish, but in the short term, deep corrections like the current one are normal to “shake off” positions before big money returns.
📊 Technical Analysis
Current trend:
H1 is still in a short-term downtrend phase (lower high – lower low), with prices below the 4080–4100 resistance zone and below the nearest descending trendline.
Main support zones:
4005–3990: intersection of long-term rising trendline, POC – OB, old VAH/VAL zone → crucial support, potential for bottom-fishing buying force.
3975–3977: deeper support, coinciding with liquidity zone & recent low.
Key resistance zones:
4098–4100: confluence of resistance + trendline test → ideal zone to watch for SELL retracement.
Above is the cluster 4011 – 4053 – 4077 – 4098–4100 acting like “steps” for scalping orders.
Volume Profile:
Heavy trading volume around the 4000–4020 zone → prices tend to revisit this area multiple times before moving away.
🎯 Reference Trading Scenarios
SELL – following the downtrend (priority)
Entry: 4098–4100
SL: 4105
TP: 4082 → 4060 → 4035 → 4012
Price retraces to resistance + descending trendline.
Only trigger when M15–H1 shows clear rejection candles (pin bar/bearish engulfing) around 4098–4100.
BUY – catching the rebound at strong support
Entry: 3975–3977
SL: 3970
TP: 3995 → 4025 → 4050 → 4080
Confluence support zone at channel bottom + POC/OB + liquidity.
Only BUY when there is strong rejection or a clear reversal pattern (M15–H1).
⚠️ Price zones to watch for scalping
4011 – 4053 – 4077 – 3939
These zones are suitable for short scalps, prioritising the main trend (currently bearish), quick exits – do not hold positions too long.
🧠 Risks & Invalidations
H1 closes above 4105 → reduces SELL priority, wait for new structure.
H1 closes below 3970 → bad structure for BUY side, potential for further decline to lower zones.
Are you watching to BUY or SELL gold in this zone?
👉 Comment your perspective & Follow LiamTrading channel for daily XAUUSD plans.

WILL GOLD CONTINUE TO DROP?1. Market Context Yesterday, gold was almost in accumulation throughout the Asian–European session and only broke out strongly in the latter half of the US session.
After breaking out of the accumulation zone, the price dropped sharply around 4006 – a crucial key level – and surged strongly from there.
However, statements from FED members remain hawkish, affirming the stance of keeping interest rates high for longer and not considering rate cuts yet.
This creates
-Downward pressure on gold
-Cash flow leaning towards USD
------>>Market sentiment prioritises SELL on price recovery
➡️ Conclusion: Today, the main scenario remains SELL following the trend, BUY is only a secondary strategy & short scalp when reaching strong support.
🎯2. Today's Trading Scenario
(SL: 10 points TP 10 points. RR ratio:1-2/1:3/1:5)
🔻 Main SELL (priority)
SELL Zones:
4050 – 4055
4075 – 4080
4105 – 4110
🟦 Secondary BUY
BUY Zones:
3996 – 3994
3965 – 3960
3935 – 3930
3895 – 3890

GOLD DAILY TRADING 17/11: BUY TODAY🦁 THE GOLDEN ARENA – 17 NOV, 2025
“Rebound or Trap? Let the Orderflow Decide.”
A visually striking TradingView plan – part narrative, part tactical map. This is not just a bias, it’s a battlefield strategy.
🧭 MARKET CONTEXT SNAPSHOT
Price currently consolidating around 4076 – 4084, after clean breaks of structure (BOS) and a deep retracement.
Significant supply zones confirmed at 4157 – 4180, where POC clusters, FVG imbalances, and volume absorptions align.
Orderflow on M5–M30 shows fading buy pressure and aggressive sells into lower highs.
🎯 CORE STRATEGIES FOR TODAY
🔺 Scenario 1: Breakout Trap SELL (High Conviction)
Target Zone 4178 – 4180 (Main Supply)
Stop Loss (SL) 4185
Take Profit 1 (TP1) 4155 (Low volume node)
Take Profit 2 (TP2) 4100 (Local support)
Take Profit 3 (TP3) 4040 (Structural SSL level)
🔍 Why this setup?
Clear liquidity pool above 4178 being targeted.
Volume tapering off into the move → classic reversal signal.
Footprint shows absorption candles at key supply.
🪙 Scenario 2: FVG Scalping SELL (Secondary)
Entry Zone 4157 – 4158
SL 4163
TP 4100 – 4105
✅ Perfect for short-term scalpers looking to ride the intraday rejection from the imbalance zone.
🟢 Bullish Reversal INVALIDATION (Failsafe Plan)
Trigger Break and hold above 4185
Entry Breakout Buy above 4190
SL 4175
TP 4220
Only flip bullish if aggressive buyers step in + strong delta + profile breakout.
🧱 KEY PRICE ZONES TO MONITOR
Level Description
4185 Stopline – invalidates Sell
4178 – 4180 Main SELL Zone (POC + FVG)
4157 – 4158 Minor FVG Scalping Area
4100 Micro support + Bull trap
4040 SSL – liquidity target
📊 VOLUME & ORDERFLOW INSIGHT
M5–M30 Footprints:
Massive seller imbalances from 4175+
Footprint at 4084 shows buyer exhaustion
Volume Profile:
High-volume node at 4178 acting as strong resistance
Low-volume gap below 4155 → fast price travel zone
Delta:
Negative delta buildup confirming sell bias
💡 EXECUTION CHECKLIST
✅ Wait for entry trigger at marked zones – don’t pre-empt.
🚫 Avoid FOMO buy into supply unless 4185 is cleanly broken.
🔔 Set alerts at 4157 and 4180 for rejection signs.
🧠 TRADING MANTRA OF THE DAY
"The chart speaks in structure,
The volume whispers the truth,
But the orderflow shouts the conviction."
📌 Bias: SELL on retracements toward supply → hold for 4100–4040
📌 Watchlist: Footprint aggression, absorption blocks, spoof traps

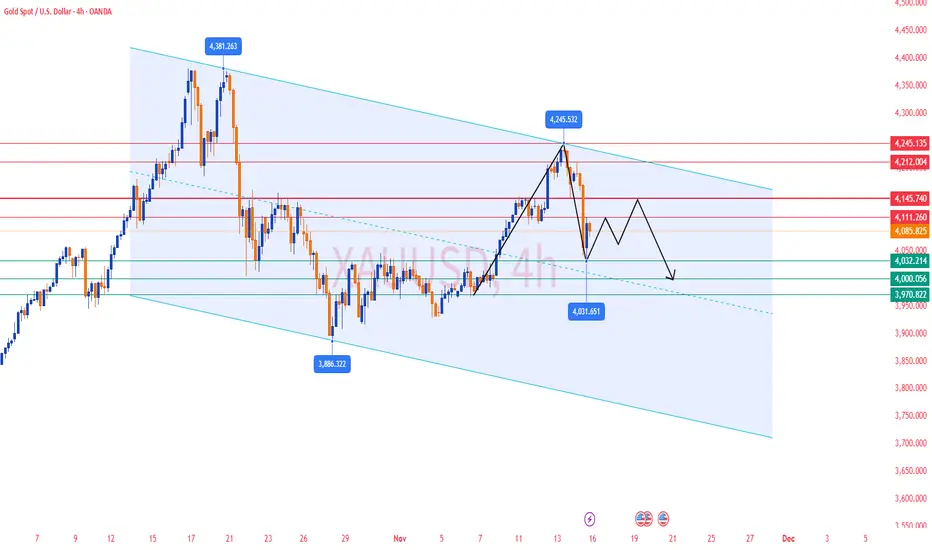
Gold Analysis & Trading Strategy | November 17-18✅ From the 4-hour chart, after gold topped at 4245, the price continued to break downward and is still trading below all short-term moving averages (MA5 / MA10 / MA20). This indicates that the larger-cycle bearish trend remains intact.
MA5 < MA10 < MA20 — the bearish alignment is clear, and every rebound has been suppressed near MA10 (4110).
💹 Bollinger Bands:
The lower band continues to extend downward, the middle band (around 4146) is sloping lower, and the lower band has moved down to 4035.
Gold is currently oscillating weakly near the lower band, suggesting that the market is still releasing downside momentum and the lower support has not stabilized.
✅ From the 1-hour chart, gold has been unable to hold above MA20 (around 4084).
MA5 and MA10 are pressing downward, while MA20 and MA60 act as strong resistance. Each rebound candle shows an upper wick, indicating heavy selling pressure.
The 1-hour timeframe is a weak consolidation and there is no valid sign of bottoming or reversal.
💹 Bollinger Bands:
The bands are narrowing at the lows, with the middle band (around 4084) moving sideways.
The market is consolidating at low levels and may choose a direction soon — with a higher probability of continuing downward in line with the main trend.
🔴 Resistance Levels: 4110–4120 / 4140–4150
🟢 Support Levels: 4060–4050 / 4032–4035
✅ Trading Strategy Reference:
🔰 If gold rebounds to 4110–4120 and meets resistance, consider light short positions. The target can be set at 4050–4030. If the decline continues, further targets are 4000 and 3930–3887.
🔰 If gold rebounds to 4140–4150 and faces rejection, high-position shorts can be taken, targeting 4100–4080.
🔰 If gold pulls back to 4035–4040 and stabilizes, consider low-position longs, targeting 4060–4080.
🔥Trading Reminder: Trading strategies are time-sensitive, and market conditions can change rapidly. Please adjust your trading plan based on real-time market conditions.

XAUUSDTrading is easy, but trading with convection is only possible after you have 5-6 years of experience trading in every market.
It is this experience that can tell you how high the market can go, if you are tracking the stock correctly, and only then can you estimate how much profit booking can happen.
This is possible only with experience. Its the time to book profit in gold. gold ready for create a new lower high formation.

Automated AI Trading1. What is Automated AI Trading?
Automated AI trading is a system that uses machine-learning models to identify market patterns, predict price movements, and execute trades without human intervention. It operates on:
Data (price, volume, order flow, macro news, sentiment)
Logic (rules, model predictions, risk parameters)
Execution engines (API connectivity with brokers/exchanges)
Feedback loops (continuous learning and improvement)
Unlike traditional algo trading, which follows fixed mathematical rules (e.g., moving average crossover), AI-driven trading systems learn from data, recognize non-linear relationships, adapt to different market regimes, and evolve over time.
How AI differs from simple algos:
Traditional Algo Trading AI-Driven Trading
Follows fixed rules Learns from millions of data points
Struggles in changing markets Adapts to new volatility and structure
Limited to indicators Understands patterns, order flow, sentiment
No self-improvement Continuously improves via ML models
This shift is why the world’s biggest hedge funds—Citadel, Renaissance, Two Sigma—rely heavily on AI-powered trading.
2. Core Components of Automated AI Trading
**1. Data Collection Systems
AI learns from large amounts of data such as:
Historical price data (candles, ticks)
Volume profile and order-book data
News articles, macro releases
Social media sentiment
Company fundamentals
Global market correlations (Forex, commodities, indices)
The more accurate the data, the more powerful the AI.
2. Machine-Learning Models
AI trading uses models like:
Supervised learning → Predicting future prices from historical patterns
Unsupervised learning → Detecting hidden clusters and regimes
Reinforcement learning → Teaching models how to “reward” profitable actions
Deep learning → Working on complex and high-dimensional inputs (order flow, charts)
For example, a reinforcement learning model may learn to buy dips in a rising market and fade breakouts in a choppy market because it has “experienced” millions of simulated trades.
3. Strategy Engine
This links model predictions to market actions. It includes:
Entry signals
Exit signals
Stop-loss and target placement
Position sizing
Hedging decisions
Time-based rules
Even if the AI predicts a bullish move, the strategy engine decides:
how much capital to deploy,
how many trades to execute,
whether to trail SL or take partials,
whether to hedge via options.
4. Order Execution Engine
This is the part that actually executes trades through APIs. It handles:
Slippage control
Spread detection
Smart order routing
Latency optimization
High-frequency micro-decisions
Professional systems place orders in milliseconds to take advantage of liquidity pockets.
5. Feedback & Reinforcement System
AI trading bots track every action:
Did the model react correctly?
Was there unnecessary drawdown?
Did volatility shift?
Did correlations break?
These results feed back into the learning cycle, making the system smarter.
3. How Automated AI Trading Works Step-by-Step
Here’s a simplified version of how an AI system might trade Nifty or Bank Nifty:
Data Input:
The AI collects candlesticks, volume profile, India VIX, global cues (SGX/GIFT Nifty), news sentiment, and order-flow metrics.
Prediction:
The model predicts probabilities such as:
Market trending or ranging
Expected volatility
Direction bias (up/down/neutral)
Strength of buyers vs sellers
Signal Generation:
If the AI believes there is a 70% chance of an upside breakout based on VWAP deviation, delta imbalance, and global sentiment, it triggers a buy signal.
Risk Management:
The AI sets SL based on ATR or structure, adjusts position sizing based on volatility, and may hedge using options if needed.
Execution:
Orders are placed instantly at the best liquidity point, often slicing orders to reduce slippage.
Monitoring & Adaptation:
If volatility spikes due to news, the AI tightens stops or exits early.
Feedback Learning:
After the trade, the outcome is fed back into the model to refine future decisions.
This continuous loop is what makes AI trading so powerful.
4. Types of AI Trading Strategies
AI systems can run multiple strategy categories simultaneously:
1. Trend-Following AI Strategies
They identify trending markets using ML-based pattern recognition.
Useful for:
Indices
FX
Commodities
2. Mean Reversion AI Strategies
The AI detects overextensions or liquidity vacuum areas.
Excellent for:
Low-volatility equities
Options premium selling
3. High-Frequency Trading (HFT)
AI reads order-book microstructure and executes trades in milliseconds.
4. Arbitrage & Statistical Arbitrage
The system scans correlated assets (e.g., Nifty–BankNifty, Gold–USDINR) and identifies mispricing.
5. Option Trading AI Models
They use Greeks, IV crush patterns, gamma exposure, and flow data to:
Sell premium during low volatility
Buy options during breakout volatility expansions
Hedge positions dynamically
5. Advantages of Automated AI Trading
1. Eliminates Emotional Trading
Fear, greed, revenge trading, and FOMO are removed completely.
2. Faster Decision Making
AI can scan hundreds of markets in milliseconds.
3. High Accuracy in Pattern Recognition
It sees relationships invisible to human eyes.
4. Consistency
AI follows rules perfectly 24/7 with no fatigue.
5. Ability to Adapt
Markets shift from trending to ranging, from low to high volatility—AI systems detect these shifts early.
6. Better Risk Management
AI adjusts SL, TS, exposure, and hedging dynamically.
6. Limitations of Automated AI Trading
Despite its power, AI trading has practical challenges:
1. Overfitting Risk
Models may memorize old data and fail in live markets.
2. Regime Changes
AI trained on low-volatility years might struggle during black-swan events.
3. Technology Costs
High-quality data, GPUs, and low-latency infra are expensive.
4. Black-Box Nature
Many AI decisions lack transparency—difficult to interpret.
5. Dependency
Traders relying too much on bots may lose market intuition.
7. The Future of Automated AI Trading
The next era will combine:
AI + Market Structure
Using volume profile, liquidity zones, order-flow imbalance.
AI + Global Macro Intelligence
Models that read FOMC statements, inflation prints, and currency flows.
AI + Voice/Chat Interfaces
Traders will speak: “AI, manage my Nifty long, hedge with a put spread,” and the system will execute.
AI-Driven Portfolio Automation
Fully autonomous wealth-management engines.
We are entering a world where AI will not assist traders—it will act as a complete trading partner.
Conclusion
Automated AI trading is transforming financial markets by combining vast data processing, machine learning, and rule-based automation. It removes human emotion, enhances precision, adapts to market shifts, and executes strategies with high speed. While it comes with limitations like overfitting and model opacity, the benefits far outweigh the challenges. Whether you trade indices, equities, commodities, or options, AI will play a central role in future trading success.

this is the tringle pattern , tringle contines the trendthis is the tringle pattern , tringle contines the trend, so we can continew with the trend

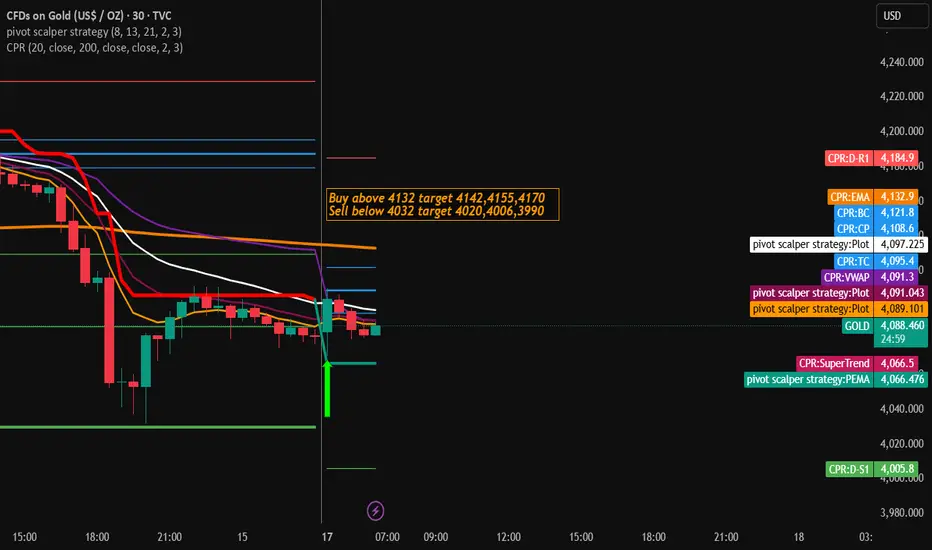
Gold Trading Strategy for 17th November 2025Gold Trading Plan
💰 Buy Setup (Long Trade)
Buy only if gold price closes above the high of the 30-minute candle at:
$4132
Targets:
$4142 (Target 1)
$4155 (Target 2)
$4170 (Target 3)
Idea:
If the price closes above $4132, it shows buyers are strong. Enter after the breakout and aim for the targets one by one.
📉 Sell Setup (Short Trade)
Sell only if gold price closes below the low of the 30-minute candle at:
$4032
Targets:
$4020 (Target 1)
$4006 (Target 2)
$3990 (Target 3)
Idea:
If the price closes below $4032, sellers are taking control. Enter after the breakdown and aim for the mentioned targets.
✔️ Tips for New Traders
Always wait for the 30-minute candle to close before entering the trade.
Use a stop loss to limit risk:
For buys, SL can be below $4125 (or below breakout candle).
For sells, SL can be above $4038 (or above breakdown candle).
Avoid trading during high-impact news unless experienced.
⚠️ Disclaimer
This information is for educational purposes only and not financial advice. Trading involves risk. Always do your own analysis and consult a financial advisor before making any trading decisions.
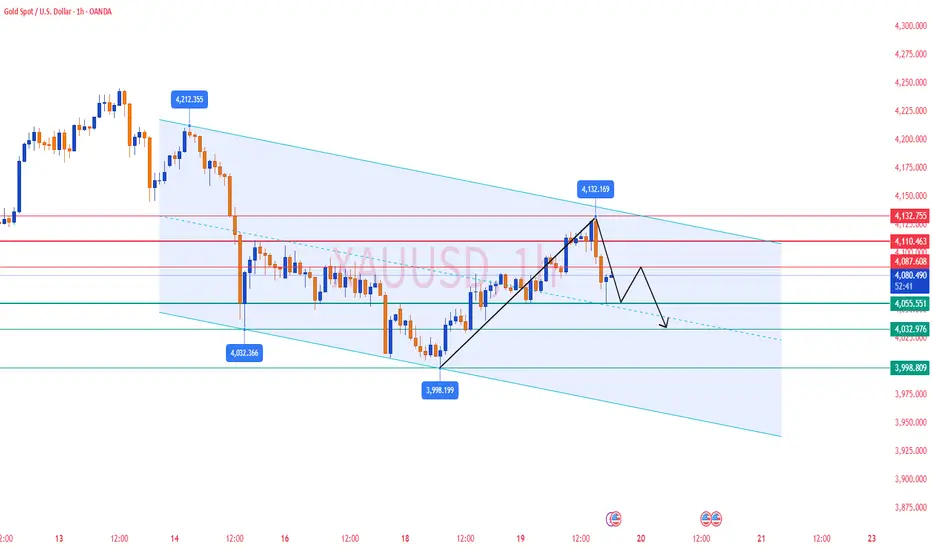
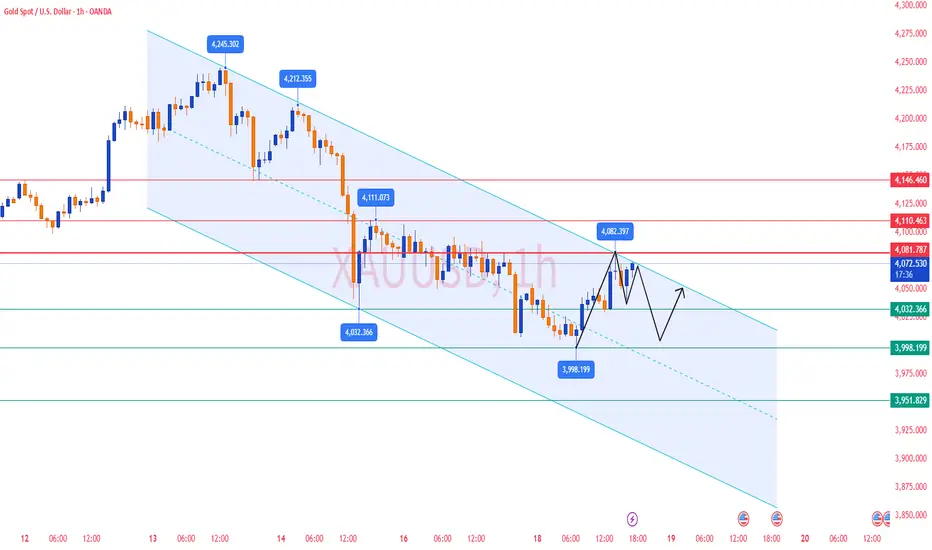
XAUUSD: Likely continuation following pullbackXAUUSD has surged into a strong uptrend, and I predict that this momentum will continue, with a potential target around 4,150, as shown on my chart.
The current price level may be a critical turning point. Here, the price could find support and continue to rise, or if it breaks below, we might see an extension of the downward trend.
If I had to choose a direction, I would lean towards more upside, but the final decision should be based on price action to determine the next move.
However, if the price breaks decisively below the trendline, it would invalidate the bullish scenario, indicating that the uptrend could pause or even reverse in the short term.
These are just my personal views based on chart analysis, not financial advice. Always verify your setups and manage your risk carefully.

Gold Analysis & Trading Strategy | November 19-20✅ From the 4-hour chart, gold experienced a strong rebound yesterday, releasing some short-term bullish momentum. However, the price encountered significant resistance near 4132 (previous high + upper Bollinger Band).
The latest candle shows a large bearish candle with a long upper wick, which is a classic signal of bulls failing to break higher and profit-taking pressure intensifying.
MA5 and MA10 have started to turn downward, indicating weakening short-term momentum.
MA20 (around 4089) still provides partial support, but it has already been broken through quickly.
The upper Bollinger Band (around 4130) remains a strong resistance level, with price quickly falling below the mid-band after the spike.
The lower wick touched 4055, suggesting that short-term buying interest exists in this area.
The short-term rebound structure has been damaged, and the 4-hour timeframe has entered a corrective phase turning weaker again.
If gold breaks below 4058–4050, bearish momentum will strengthen further.
✅ On the 1-hour chart, gold formed a short-term high at 4132, followed by a sharp sell-off.
Two consecutive large bearish candles broke below MA5 / MA10 / MA20 / MA60, forming a classic one-sided reversal signal.
The bullish structure is completely broken, and moving averages have shifted back into a bearish alignment.
Key support lies at 4050–4049, a strong confluence support zone. Breaking below this area will open further downside potential.
The current small rebound is weak and only a technical correction, showing that bears still dominate the short-term price action.
The rebound only reached below MA20 (around 4085), showing that selling pressure above remains strong.
Short-term structure is bearish, and any weak rebound is unlikely to break above 4085–4090. After the rebound, price is still likely to retest the 4050 area.
🔴 Resistance Levels:4085–4090 / 4100–4110 / 4125–4132
🟢 Support Levels:4058–4050 / 4030 / 3998
✅ Trading Strategy Reference
🔰 Strategy 1: Short at 4085–4090 (Main Idea)
If gold rebounds to 4085–4090 and shows resistance:
Light short positions
Stop-loss: 4098
Targets: 4060 / 4050
👉 Current trend is bearish; selling rebounds is the main logic.
🔰 Strategy 2: Short again at strong resistance (Aggressive Short)
If gold rebounds to 4100–4110:
Medium-sized short positions
Stop-loss: 4118
Targets: 4065 / 4050
👉 This area is strong resistance; short-term breakout probability is low.
🔰 Strategy 3: Breakout shorts below 4050 (Trend-following)
If price breaks 4050:
Bearish momentum will accelerate
Targets: 4030 / 4000
👉 4050 is the key level determining whether bears will continue the downward move.
📌 Summary
4H rebound was rejected; structure turning weaker
1H shows a sharp breakdown; bears dominate short-term price action
4085–4090 is the main zone for selling rebounds
4050 is the most important support today—breaking it will open deeper downside
Gold Trading Strategy for Next Week✅ From the daily chart, gold closed with a large bearish candle, showing a clear decline. Short-term rebound pressure is heavy and market sentiment has turned bearish. The 4000 psychological level is the key support: if it holds, gold may continue to fluctuate within the upper range; if it breaks, the price may further fall toward 3930 or even the 3886 area for support. OANDA:XAUUSD
✅ From the 4-hour chart, gold is still in a corrective phase, and the overall structure remains weak. If the price can climb back above the key moving averages, bulls still have a chance to repair the structure; if not, bears will continue to dominate, and the probability of further downside increases.
✅ From the 1-hour chart, the short-term structure has already formed a Head and Shoulders top, and the rebound strength is limited. If gold cannot break above 4150 next week, the current rebound will form the right shoulder, creating continued downward pressure. After Friday’s sharp drop, gold is expected to see a technical rebound early next week, and the next move will depend on the strength of that rebound.
🔴 Resistance Levels: 4110–4120 / 4140–4150
🟢 Support Levels: 4030–4050 / 4000–3970
✅ Trading Strategy Reference:
🔰 If gold rebounds to 4110–4120 and meets resistance, consider light short positions. The target can be set at 4050–4030. If the decline continues, further targets are 4000 and 3930–3887.
🔰 If gold rebounds to 4140–4150 and faces rejection, high-position shorts can be taken, targeting 4100–4080.
🔰 If gold pulls back to 4035–4040 and stabilizes, consider low-position longs, targeting 4060–4080.
✅ Overall, next week’s short-term gold trading should focus on selling the rebounds, with buying on dips as a secondary approach. If gold fails to break above 4150, the Head and Shoulders top pattern will be confirmed, and the bearish trend is expected to continue.
LiamTrading – XAUUSD H1 | Gold Holds 0.618, Bullish Scenario...💛 LiamTrading – XAUUSD H1 | Gold Holds 0.618, Bullish Scenario Preferred for Wednesday 🎯
Gold continues to recover after the previous decline and is currently sitting right at the 0.618 Fibonacci level on the H1 timeframe — indicating buyers still have the upper hand. Price is also holding above the rising trendline and the thick Volume Profile area around 407x, so for today’s session, I continue to prioritise BUY setups in line with the trend.
📰 Macro – News Context
After the U.S. government reopened, the market is preparing for a series of economic data today and tomorrow → both USD and Gold may experience strong volatility.
President Trump attacked Fed Chair Powell, calling him “stupid and incompetent,” saying he once wanted to fire him immediately but was stopped by advisors.
👉 Because of this, market sentiment is very sensitive: if data leans towards a rate-cut scenario, Gold could gain additional support.
📊 Technical – H1 with Fibonacci, Trendline & Volume Profile
Fibonacci 0.618: Price is holding at the 0.618 level of the latest downswing; if this level holds, the natural target will be the upper FVG + resistance zone 4120–4150.
H1 Uptrend Line: The trendline from the recent low is supporting price very well; each retest generates a bullish reaction → an ideal area to wait for BUY entries.
Volume Profile & Liquidity:
The 4075–4080 zone is Buy Liquidity — thick volume, lots of order flow → suitable as an entry point if price retests.
VAL ~4040 and the Support + FVG area around 4020 are the next defence zones if the market sweeps deeper.
Upside liquidity:
Past H1 FVG remains unfilled up to at least 4150, so if the bullish scenario plays out, Gold can easily extend into this zone.
🎯 Trading Scenarios (LiamTrading)
1️⃣ Primary Setup – BUY with Trend
Entry: 4078–4080 (trendline retest + strong volume cluster)
SL: 4073
TP: 4094 → 4120 → 4140 → 4175
💡 Notes:
Wait for a clean M5–M15 bullish reaction (long lower wick, pin bar, or bullish engulfing) around 4078–4080 before entering.
Once price moves ~1R in profit, move SL to breakeven for account protection.
2️⃣ Short-term Scalping Zones
Support – quick buys: 4048–4023 (VAL + lower FVG zone).
Resistance – quick sells: 4121–4151 (FVG + upper liquidity zone).
These are only for scalping, so:
Enter on smaller timeframes (M5–M15).
Take profits quickly, avoid holding through major news.
✅ Summary
Short-term trend: Bullish bias as long as price holds above the H1 trendline and the 0.618 zone.
Main plan: Wait for BUY at 4078–4080, targeting 4120 → 4140 → 4175.
So, what do you think — will Gold push straight to 4150, or will it sweep down toward 404x first?
👉 Share your view in the comments & Follow LiamTrading to get daily XAUUSD plans on TradingView.

Gold Strategy 11/18: Break this Points gold will more FALL📝 GOLD TRADING PLAN – Nov 18
1. Market Context
Price is moving around 4030–4040 after a bearish BMS break.
Main structure: corrective bounce within a broader liquidity-seeking environment.
Expectation: liquidity sweep → reaction → directional move.
2. Key Trading Zones (from chart)
🔽 BUY ZONES
Primary Buy Zone
3982 – 3980
→ SL: 3977
Strong confluence (trendline + OB + support).
Deep Buy Zone
3927 – 3920 (OB zone)
→ SL below 3920
Only active if price sweeps below 3980 and continues lower.
🔼 SELL ZONE
Primary Sell Zone
4056 – 4058
→ SL: 4061
Strong confluence: FVG + resistance + liquidity sweep zone.
Sell Targets
TP1: 4000
TP2: 3980
TP3: 3930 (only if heavy news-driven volatility)
3. Expected Price Scenarios
Scenario 1 – Most Probable
🔹 Price retests trendline → minor bounce → pushes into 4056–4058
🔹 Sell from that zone → target 4000 → 3980
Scenario 2 – Secondary
🔹 Price drops first → reaches 3982–3980
🔹 Look for bullish reaction → Buy → retest 4040–4050
Scenario 3 – High-volatility Move (News Impact)
🔹 If price breaks below 3980 decisively → drops toward 3927–3920
🔹 Strong Buy zone → expect reversal back into 4000–4030
4. News Impact – Nov 18
High-impact events today:
FED speakers: Waller, Barr, Barkin (10:00pm–11:00pm)
→ Strong volatility expected on gold.
President Trump Speaks – 6:00am
USD Housing Starts – 8:15pm
🔔 Notes:
Avoid large positions before major speeches.
Keep SL tight; gold reacts aggressively to USD news.

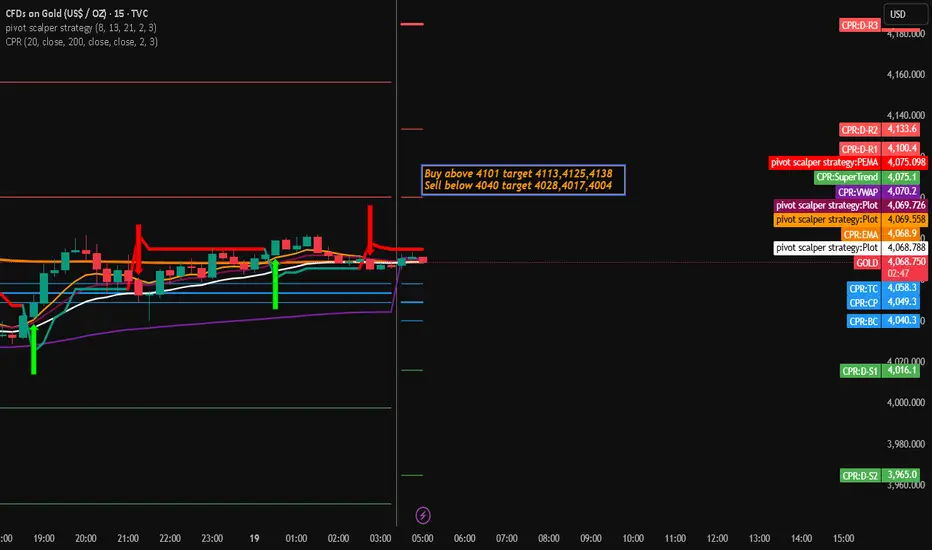
Gold Trading Stategy for 19th November 2025📈 Gold Trading Setup 💰
Buy Setup 🟢
Condition: Enter Buy if Gold (XAU/USD) closes above the high of the 15-minute candle.
Entry Level: Above 4101
Targets:
Target 1: 4113
Target 2: 4125
Target 3: 4138
Sell Setup 🔴
Condition: Enter Sell if Gold (XAU/USD) closes below the low of the 1-hour candle.
Entry Level: Below 4040
Targets:
Target 1: 4028
Target 2: 4017
Target 3: 4004
🛑 Important Disclaimer 📉
This is not financial advice. Trading involves substantial risk and may not be suitable for all investors. Only trade with capital you can afford to lose.
Do your own research (DYOR) before making any trading decisions.
Past performance is not indicative of future results.
Market conditions can change rapidly, and no strategy is foolproof.
Always use appropriate risk management, including stop-loss orders.
Gold/XAUSSD weekly analysis and possible sell/buy scenarios....Currently gold is showing pressure and generating sell signals. There are multiple sell opportunities developed in Gold in different time frames. And we can anticipate couple of opportunities out of these will trigger. Gold has already created CISD on HTF and tested daily FVG and changed delivery and showing down fall in price. There is already one sell scenario executed. And we can see few more in coming week.
1. Price has already changed delivery in daily time frame and tasted daily FVG and price is falling now.
2. Currently price is holding at daily FVG and we may see slight pull back around the levels of 424152 & 4205 and then further fall till ~3888 level.
3. We can see another higher probability sell scenario at 4300 level if aforementioned levels are breached.
4. RSI is also showing sell side pressure, giving another confluence.
5. Most probably price will take liquidity of FVG/RDRB level and create MSS/CISD/TS/iFVG in LTF.
6. Price should show rejection/reversal in respective LTF (1h/15m) at FVG zone.
7. Take the trade only once clear entry model i.e. turtle soup. iFVG break, CDS or MSS happens on LTF
All these combinations are signalling a high probability and ~10R trade scenario.
Note – if you liked this analysis, please boost the idea so that other can also get benefit of it.
Also follow me for notification for incoming ideas.
Also Feel free to comment if you have any input to share.
Join me on live stream for real time update.
Disclaimer: This analysis is for educational purposes only and does not constitute investment advice. Please do your own research (DYOR) and check with your financial advisor before making any trading decisions.

Gold Analysis & Trading Strategy | November 18-19✅ From the 4-hour chart, gold remains in an overall bearish correction structure.
MA5 and MA10 have formed a bearish crossover and continue to suppress the candlesticks, indicating that the short-term rebound is limited.
MA20 is located near 4097, acting as significant resistance. As long as the price fails to stabilize above this level, the bearish structure will not change.
The Bollinger Bands show a downward opening, reflecting a weak trend.
Price previously broke below the lower band (around 3980) and although it has since rebounded, it still remains below the middle band.
Gold has repeatedly tested the 3997–4000 support zone and formed brief rebounds, but the strength is weak — this is still technical correction rather than a trend reversal.
✅ On the 1-hour chart, gold shows a clear short-term rebound correction.
Price has broken above MA5 and MA10 and is holding above the short-term moving averages, indicating strengthening rebound momentum.
The upper resistance comes from the Bollinger upper band at 4075–4078, an area where gold has repeatedly been rejected.
MA20 (around 4036–4040) has shifted from resistance to short-term support.
As long as this level holds, the 1-hour structure still has room to extend the rebound.
Long lower wicks and concentrated trading around 4050–4060 suggest that buyers are trying to establish a short-term base.
However, the short-term rebound has not changed the bigger bearish structure.
If gold fails to break through 4075–4080, the rebound may end and the price could return to its bearish rhythm.
🔴 Resistance Levels: 4075–4080 / 4100–4108 / 4150
🟢 Support Levels: 4036–4040 / 4000–3997 / 3953
✅ Trading Strategy Reference
🔰 Strategy 1 — Look for short positions near resistance (trend-following):
If gold rebounds to 4075–4080 and shows rejection:
Consider taking light short positions
Stop Loss: above 4088
Targets: 4050 → 4035 → 4000
👉 This zone combines multiple moving-average resistance and the Bollinger upper band, making it a high-probability area for trend-following shorts.
🔰 Strategy 2 — Short-term long positions from support (countertrend, light positions):
If gold pulls back to 4035–4040 and stabilizes:
Consider a short-term long position
Stop Loss: below 4030
Targets: 4060 → 4075
👉 This is only a corrective rebound trade — not suitable for large positions.
🔰 Strategy 3 — If gold breaks below 4000, downside may accelerate:
A break below 3997–4000 could trigger a stronger sell-off, with targets toward:3953 → 3920
✅ Summary
Gold remains in a bearish, downward-dominated structure, and the current rebound is still a weak correction.
As long as the price remains suppressed below 4080–4100, the bearish trend remains intact.
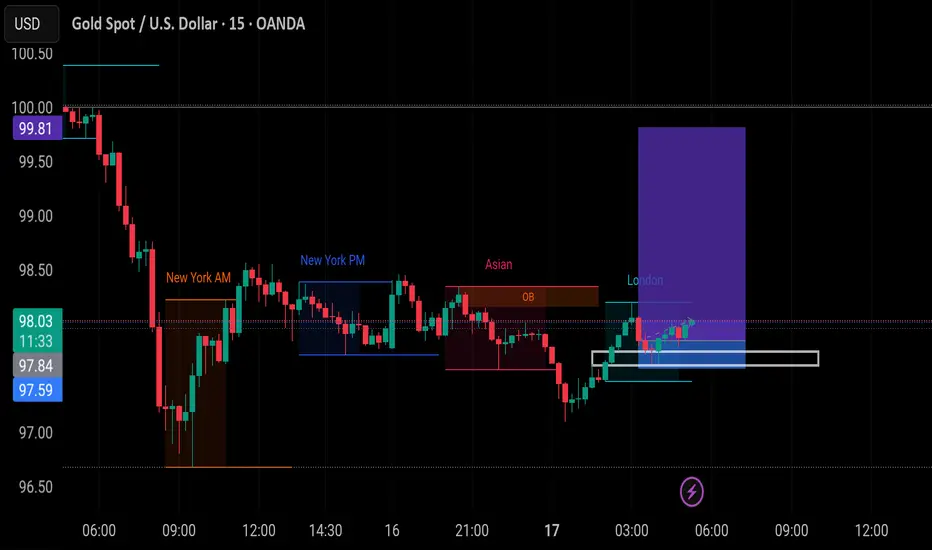
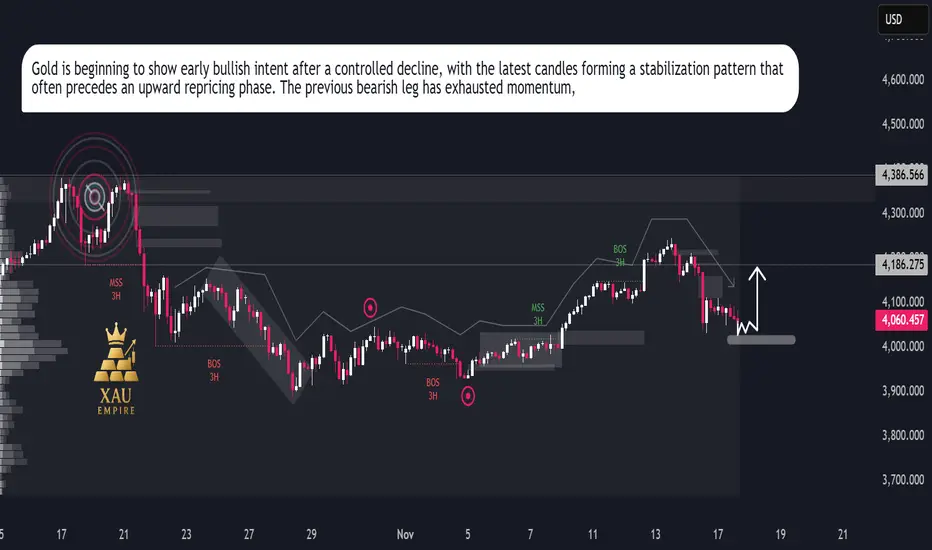
XAUUSD Repricing MoveXAUUSD Repricing Move
Gold continues to trade inside a broader corrective cycle, with price action showing a clear transition from prior strength into a short-term distribution phase. The chart highlights repeated breaks in market structure and shifts in order flow, signalling a controlled decline built on institutional rebalancing.
After the recent downside sweep, price is now hovering around a key reaction zone where liquidity has already been absorbed. Sellers dominated the previous swing, but the latest candles show a slowdown in bearish momentum, indicating that the market may be preparing for a corrective repricing attempt.
The volume footprint on the left side of the chart reflects previous heavy activity from major participants, and the current area sits beneath an inefficiency pocket that remains unmitigated. This opens the door for a short-term bullish rotation if buyers defend this accumulation region. The marked arrow in your chart aligns with a potential internal shift where gold could attempt a short retracement toward the mid-range of the prior move.
Momentum indicators embedded in the structure show reduced volatility, meaning the market may be positioning itself for a liquidity-driven bounce rather than continuing straight lower. The next sessions will reveal whether this zone becomes a launch point for a recovery leg or if the broader trend resumes its downward trajectory.
XAUUSD MULTI TIMEFRAME ANALYSIS Hello traders , here is the full multi time frame analysis for this pair, let me know in the comment section below if you have any questions , the entry will be taken only if all rules of the strategies will be satisfied. wait for more price action to develop before taking any position. I suggest you keep this pair on your watchlist and see if the rules of your strategy are satisfied.

PCR Trading Strategies How Option Contracts Work
Options have three crucial components:
1. Strike Price
The price at which the buyer can buy or sell the asset.
2. Expiry Date
The date when the option contract becomes invalid (weekly/monthly expiry in India).
3. Premium
The cost of buying the option.
Buyers pay the premium.
Sellers (writers) receive the premium.
Premium fluctuates based on demand, volatility, and time remaining.
