Commodities & MCX Gold-Silver Trading: A Complete Guide1. Introduction to Commodity Markets
Commodities have been the backbone of trade for centuries. They represent raw materials or primary agricultural products that can be bought, sold, and exchanged. Commodity markets are essential because they provide a platform for producers, consumers, and invest
Key stats
About SPDR S&P 500 ETF Trust
Home page
Inception date
Jan 22, 1993
Structure
Unit Investment Trust
Replication method
Physical
Dividend treatment
Distributes
Distribution tax treatment
Qualified dividends
Income tax type
Capital Gains
Max ST capital gains rate
39.60%
Max LT capital gains rate
20.00%
Primary advisor
SSgA Funds Management, Inc.
Distributor
ALPS Distributors, Inc.
ISIN
US78462F1030
SPY is the best-recognized and oldest US listed ETF and typically tops rankings for largest AUM and greatest trading volume. The fund tracks the massively popular US index, the S&P 500. Few realize that S&P's index committee chooses 500 securities to represent the US large-cap space - not necessarily the 500 largest by market cap, which can lead to some omissions of single names. Still, the index offers outstanding exposure to the US large-cap space. It's important to note, SPY is a unit investment trust, an older but entirely viable structure. As a UIT, SPY must fully replicate its index (it probably would anyway) and forgo the small risk and reward of securities lending. It also can`t reinvest portfolio dividends between distributions, the resulting cash drag will slightly hurt performance in up markets and help in downtrends. SPY is a favored vanilla trading vehicle.
Related funds
Classification
What's in the fund
Exposure type
Electronic Technology
Technology Services
Finance
Stock breakdown by region
Top 10 holdings
India’s Growing Derivatives Market & Weekly Expiries1. Introduction
Financial markets act as the lifeblood of an economy, channelizing savings into productive investments. Within these markets, derivatives have emerged as a vital instrument for managing risk, enhancing liquidity, and providing opportunities for speculation and arbitrage. India, whic
Stock Market is in Risk OnThe US market, as well as some assets, is in a risk-on mode.
Most assets have their own seasonality.
The chart above shows one of them:
In recent years, in the period July-September, a correction began on the US market.
A number of macro indicators also speak in favor of a correction and that it

Global Macro Factors in TradingIntroduction
Trading is not just about charts, patterns, or company earnings—it’s also about understanding the bigger picture. This bigger picture is shaped by global macroeconomic factors that influence the flow of money across countries, sectors, and asset classes.
A trader who ignores global ma
Option Trading : Options trading gives you the right or obligation to buy or sell a specific security on or by a specific date at a specific price. An option is a contract that's linked to an underlying asset, such as a stock or another security.

PCR (Put and Call Ratio) TradingThe Put-Call Ratio (PCR) is a technical indicator that measures the relative volume of put options to call options in a specific timeframe. It's used to gauge overall market sentiment, with a higher PCR indicating more bearish sentiment and a lower PCR suggesting more bullish sentiment.

SPDT S&P 500 TRUST analysis for today 17 April 2025Break down below 524.5
Targets will follow as
522
518
I provide analysis for intraday for option traders. Follow me.

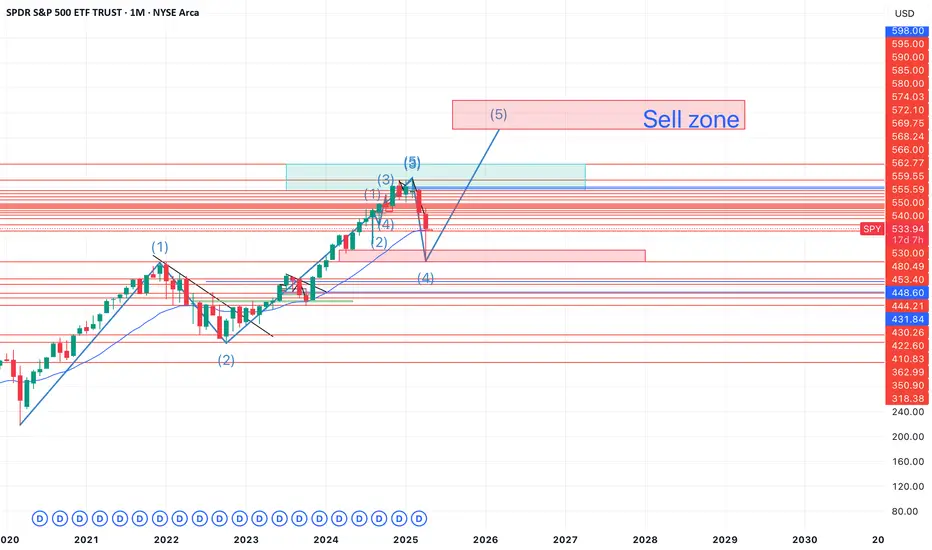
SPY wave 5 on monthlyIf SPY sustains above 480 on monthly close, we can consider it as end of wave 4 and the beginning of wave 5. 640 will act as a resistance and once 640 is broken, SPY target would be 695-740 zone where SPY will complete its wave structure. The move from 640 to 700 is most likely retail fomo. Good zon
VISUAL INVESTOR: An Investing Tutorial for EveryoneToday is a wonderful day! I am overwhelmed with positive emotions, like a racer who has crossed the finish line. My first book, The Visual Investor, is out on TradingView. It's written for everyone, from those just starting out in the stock market to experienced investors. You could say you're holdi

The Inside Out InvestorThere is a common misconception that investing in stocks is always stressful and emotionally overwhelming. Many people think that this activity is only available to extremely resilient people or crazy people. In fact, if you know the answers to three key questions, investing becomes a rather boring

See all ideas
Displays a symbol's price movements over previous years to identify recurring trends.
Frequently Asked Questions
An exchange-traded fund (ETF) is a collection of assets (stocks, bonds, commodities, etc.) that track an underlying index and can be bought on an exchange like individual stocks.
SRD assets under management is 576.37 B EUR. AUM is an important metric as it reflects the fund's size and can serve as a gauge of how successful the fund is in attracting investors, which, in its turn, can influence decision-making.
Since ETFs work like an individual stock, they can be bought and sold on exchanges (e.g. NASDAQ, NYSE, EURONEXT). As it happens with stocks, you need to select a brokerage to access trading. Explore our list of available brokers to find the one to help execute your strategies. Don't forget to do your research before getting to trading. Explore ETFs metrics in our ETF screener to find a reliable opportunity.
SRD invests in stocks. See more details in our Analysis section.
SRD expense ratio is 0.09%. It's an important metric for helping traders understand the fund's operating costs relative to assets and how expensive it would be to hold the fund.
No, SRD isn't leveraged, meaning it doesn't use borrowings or financial derivatives to magnify the performance of the underlying assets or index it follows.
Yes, SRD pays dividends to its holders with the dividend yield of 1.09%.
SRD shares are issued by State Street Corp.
SRD follows the S&P 500. ETFs usually track some benchmark seeking to replicate its performance and guide asset selection and objectives.
The fund started trading on Jan 22, 1993.
The fund's management style is passive, meaning it's aiming to replicate the performance of the underlying index by holding assets in the same proportions as the index. The goal is to match the index's returns.