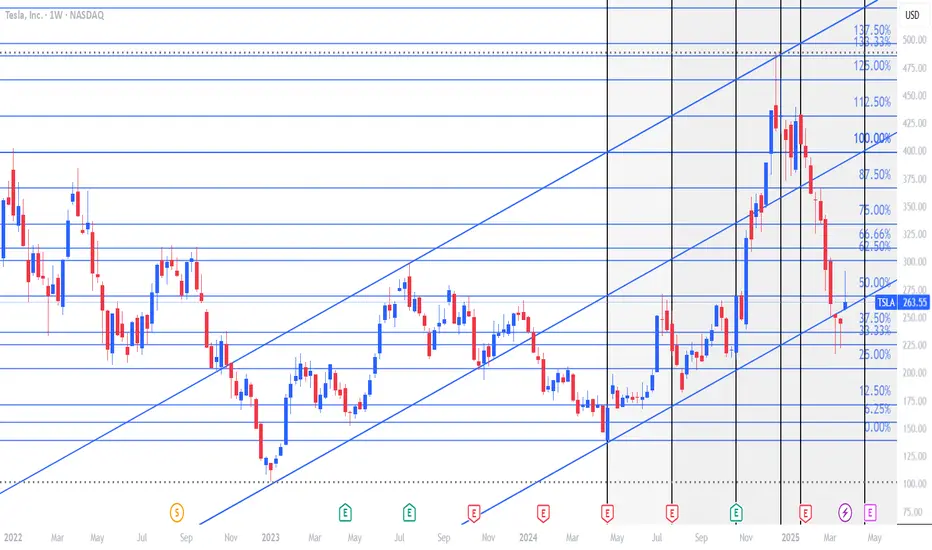
Tesla Nasdaq Stock Gann Weekly Analysis 31 March 2025...Chart below shows weekly chart analysis. We square the low of 22 April 2024.
Price objective on upside is achieved one week before with a 50% time objective. As price was early and moving with double speed it needed a price adjustment which was seen quickly on it. Whenever price moves ahead of time and price targets are achieved one needs to book profits as price can correct with time. Same was seen on Tesla with one price cycle correction within a short period of time. We are within the annual cycle completion band. The price of 269 is very important for it.
Happy Trading !!!
N.B. Not a financial advice to buy or sell.
With usual disclaimers as applicable within the reach of this
beautiful trading analysis platform. Thanks to the developers
of the program for this opportunity to use it freely to
express our ideas to the community of traders.
Trade ideas
TSLA @ 248 - Analysis 13-MAR-2025Resistance: 489
Supports: 100/0.9987
As per my analysis, TESLA is reversing from this level. If that is the case, we can see big bull run towards $700/1000.
Downside extensions can be 187, 144, 107, 57.
Reversal from any of these levels, can see 488 first and further 700/1000+.

Elliott Waves Insights: Tesla’s Roadmap to SuccessHello friends, let's analyze Tesla's chart using theory. This is a 4-hour chart where we can clearly see that the higher degree, primary degree wave ((3)) in black has been completed. Currently, we're on the verge of completing wave ((4)) in black of the primary degree, which has three subdivisions marked in blue as (A), (B) & (C).
(A) and (B) are completed, and (C) is near completion. Within (C), we have five subdivisions in red, of which 1, 2, 3, & 4 are completed, and the 5th is also more than 60% complete. Once the red fifth is complete, it will mark the end of blue (C) and primary degree wave ((4)) in black.
As soon as wave ((4)) is complete, we can expect a reversal, which should be wave ((5)). Which should cross the high of wave ((3)) which is ATH, So, we're expecting wave ((5)) to start move upwards.
Now, friends, what's the invalidation level for this view? It's $139.20. This is a level that wave ((4)) should not cross, as it's the low of black wave ((2)). According to theory, wave 2 cannot retrace more than 100% of wave 1, wave 3 cannot be the shortest in impulse, and wave 4 cannot enter the territory of wave 1, which is here we’re witnessing in current scenario, which is considering we’re in any diagonal or triangle of higher degree.
If wave ((4)) crosses $139.20, it will invalidate our view. We might be missing some dots to join or create the picture perfectly. Currently, the price is around $222, and we might see a small bounce before making a lower low possibly around $200. If we witness a divergence there, it could lead to a reversal.
Please note that this study uses theory and structures, involves multiple possibilities, and focuses on one potential scenario. There's a risk of being completely wrong. This is for educational purposes only, and users should not trade or invest solely based on this study.
I am not Sebi registered analyst.
My studies are for educational purpose only.
Please Consult your financial advisor before trading or investing.
I am not responsible for any kinds of your profits and your losses.
Hope this post is helpful to community
Thanks
RK💕
Disclaimer and Risk Warning.
The analysis and discussion provided on in.tradingview.com/u/RK_Charts/ is intended for educational purposes only and should not be relied upon for trading decisions. RK_Charts is not an investment adviser and the information provided here should not be taken as professional investment advice. Before buying or selling any investments, securities, or precious metals, it is recommended that you conduct your own due diligence. RK_Charts does not share in your profits and will not take responsibility for any losses you may incur. So Please Consult your financial advisor before trading or investing.

TSLA Chart analysis -Daily Falling wedge BreakDown Target doneThis is a daily candlestick chart of Tesla Inc. (TSLA) with some technical analysis annotations. Here’s a breakdown of the key insights:
### **1. Price Action and Pattern:**
- The chart shows a descending triangle pattern that broke downwards.
- After breaking down from the triangle, the price dropped by **-113.47 points (-31.11%)** from the breakdown point.
---
### **2. Key Gap Zones:**
- ✅ **Gap 255 – 275 Range**
- Price recently filled or tested this gap zone.
- Currently consolidating near this range.
- ✅ **Gap 242 – 218 Range**
- If the price breaks below the current zone, the next key support is in this lower gap range.
---
### **3. Volume Profile:**
- High volume nodes are visible around **326–275**, suggesting strong historical trading activity (potential resistance).
- Current price near **262.67** shows declining volume, indicating possible indecision or lack of strong buying interest.
---
### **4. Support and Resistance Levels:**
- **Support:**
- Around **250.71** (previous low)
- Next major support at **209.84**
- **Resistance:**
- **273.35** (prior support turned resistance)
- **325.61 – 326.46** (volume profile resistance)
---
### **5. Volume Trend:**
- Volume has been elevated during the recent sell-off, indicating strong selling pressure.
- A reversal would need to see increased green volume and a hold above the 255–275 range.
---
### ✅ **Outlook:**
- If the price holds above **255**, a bounce toward **273–275** is possible.
- A break below **250** could trigger further downside toward the **242–218** range.
- Watch for volume confirmation and reaction near support/resistance zones for directional bias.
---

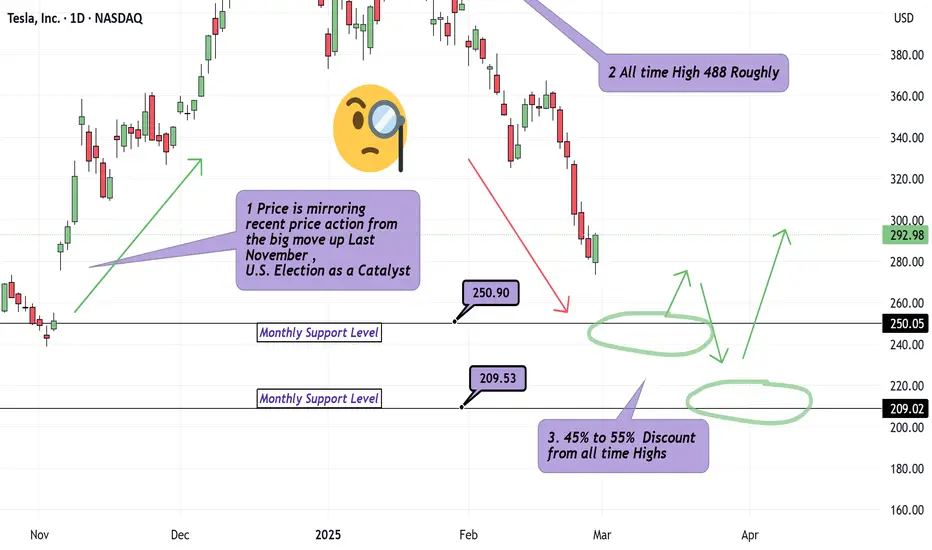
What is an Appropriate Tesla Discount? Multiple Timeframes!Hello Traders.. It's been too long.
We are back with our first analysis in over 4 months. We answer : What is an appropriate price to either jump on the train or scale into original positions on Tesla? Jumping in around 250, probably decent for at least a 4Hr to Daily Chart Swing. Safer Longs appear to be around 209 as I have outlined with green arrows, labeling the multiple pivots in the recent 5 Year range on Tesla. Tesla is coming down alongside the broader Indices which can be expected. Just because Friday Feb 28th showed us a Solid Hammer looking candle suggesting strong buying power, this does not mean much to me for 3 reasons.
1) This price action has developed in the middle of the move up we observed during Election week late last year.
2) The candle closed without a top wick and so the next daily candle , in theory, has no range to fill moving forward.
3) Momentum at the moment is also Bearish.
Discipline Traders! Leave a comment or Boosted rocket if you'd like to see similar analysis.
Effective inefficiencyStop-Loss. This combination of words sounds like a magic spell for impatient investors. It's really challenging to watch your account get smaller and smaller. That's why people came up with this magic amulet. Go to the market, don't be afraid, just put it on. Let your profits run, but limit your losses - place a Stop-Loss order.
Its design is simple: when the paper loss reaches the amount agreed upon with you in advance, your position will be closed. The paper loss will become real. And here I have a question: “ Does this invention stop the loss? ” It seems that on the contrary - you take it with you. Then it is not a Stop-Loss, but a Take-Loss. This will be more honest, but let's continue with the classic name.
Another thing that always bothered me was that everyone has their own Stop-Loss. For example, if a company shows a loss, I can find out about it from the reports. Its meaning is the same for everyone and does not depend on those who look at it. With Stop-Loss, it's different. As many people as there are Stop-Losses. There is a lot of subjectivity in it.
For adherents of fundamental analysis, all this looks very strange. I cannot agree that I spent time researching a company, became convinced of the strength of its business, and then simply quoted a price at which I would lock in my loss. I don't think Benjamin Graham would approve either. He knew better than anyone that the market loved to show off its madness when it came to stock prices. So Stop-Loss is part of this madness?
Not quite so. There are many strategies that do not rely on fundamental analysis. They live by their own principles, where Stop-Loss plays a key role. Based on its size relative to the expected profit, these strategies can be divided into three types.
Stop-Loss is approximately equal to the expected profit size
This includes high-frequency strategies of traders who make numerous trades during the day. These can be manual or automated operations. Here we are talking about the advantages that a trader seeks to gain, thanks to modern technical means, complex calculations or simply intuition. In such strategies, it is critical to have favorable commission conditions so as not to give up all the profits to maintaining the infrastructure. The size of profit and loss per trade is approximately equal and insignificant in relation to the size of the account. The main expectation of a trader is to make more positive trades than negative ones.
Stop-Loss is several times less than the expected profit
The second type includes strategies based on technical analysis. The number of transactions here is significantly less than in the strategies of the first type. The idea is to open an interesting position that will show enough profit to cover several losses. This could be trading using chart patterns, wave analysis, candlestick analysis. You can also add buyers of classic options here.
Stop-Loss is an order of magnitude greater than the expected profit
The third type includes arbitrage strategies, selling volatility. The idea behind such strategies is to generate a constant, close to fixed, income due to statistically stable patterns or extreme price differences. But there is also a downside to the coin - a significant Stop-Loss size. If the system breaks down, the resulting loss can cover all the earned profit at once. It's like a deposit in a dodgy bank - the interest rate is great, but there's also a risk of bankruptcy.
Reflecting on these three groups, I formulated the following postulate: “ In an efficient market, the most efficient strategies will show a zero financial result with a pre-determined profit to loss ratio ”.
Let's take this postulate apart piece by piece. What does efficient market mean? It is a stock market where most participants instantly receive information about the assets in question and immediately decide to place, cancel or modify their order. In other words, in such a market, there is no lag between the appearance of information and the reaction to it. It should be said that thanks to the development of telecommunications and information technologies, modern stock markets have significantly improved their efficiency and continue to do so.
What is an effective strategy ? This is a strategy that does not bring losses.
Profit to loss ratio is the result of profitable trades divided by the result of losing trades in the chosen strategy, considering commissions.
So, according to the postulate, one can know in advance what this ratio will be for the most effective strategy in an effective market. In this case, the financial result for any such strategy will be zero.
The formula for calculating the profit to loss ratio according to the postulate:
Profit : Loss ratio = %L / (100% - %L)
Where %L is the percentage of losing trades in the strategy.
Below is a graph of the different ratios of the most efficient strategy in an efficient market.
For example, if your strategy has 60% losing trades, then with a profit to loss ratio of 1.5:1, your financial result will be zero. In this example, to start making money, you need to either reduce the percentage of losing trades (<60%) with a ratio of 1.5:1, or increase the ratio (>1.5), while maintaining the percentage of losing trades (60%). With such improvements, your point will be below the orange line - this is the inefficient market space. In this zone, it is not about your strategy becoming more efficient, you have simply found inefficiencies in the market itself.
Any point above the efficient market line is an inefficient strategy . It is the opposite of an effective strategy, meaning it results in an overall loss. Moreover, an inefficient strategy in an efficient market makes the market itself inefficient , which creates profitable opportunities for efficient strategies in an inefficient market. It sounds complicated, but these words contain an important meaning - if someone loses, then someone will definitely find.
Thus, there is an efficient market line, a zone of efficient strategies in an inefficient market, and a zone of inefficient strategies. In reality, if we mark a point on this chart at a certain time interval, we will get rather a cloud of points, which can be located anywhere and, for example, cross the efficient market line and both zones at the same time. This is due to the constant changes that occur in the market. It is an entity that evolves together with all participants. What was effective suddenly becomes ineffective and vice versa.
For this reason, I formulated another postulate: “ Any market participant strives for the effectiveness of his strategy, and the market strives for its own effectiveness, and when this is achieved, the financial result of the strategy will become zero ”.
In other words, the efficient market line has a strong gravity that, like a magnet, attracts everything that is above and below it. However, I doubt that absolute efficiency will be achieved in the near future. This requires that all market participants have equally fast access to information and respond to it effectively. Moreover, many traders and investors, including myself, have a strong interest in the market being inefficient. Just like we want gravity to be strong enough that we don't fly off into space from our couches, but gentle enough that we can visit the refrigerator. This limits or delays the transfer of information to each other.
Returning to the topic of Stop-Loss, one should pay attention to another pattern that follows from the postulates of market efficiency. Below, on the graph (red line), you can see how much the loss to profit ratio changes depending on the percentage of losing trades in the strategy.
For me, the values located on the red line are the mathematical expectation associated with the size of the loss in an effective strategy in an effective market. In other words, those who have a small percentage of losing trades in their strategy should be on guard. The potential loss in such strategies can be several times higher than the accumulated profit. In the case of strategies with a high percentage of losing trades, most of the risk has already been realized, so the potential loss relative to the profit is small.
As for my attitude towards Stop-Loss, I do not use it in my stock market investing strategy. That is, I don’t know in advance at what price I will close the position. This is because I treat buying shares as participating in a business. I cannot accept that when crazy Mr. Market knocks on my door and offers a strange price, I will immediately sell him my shares. Rather, I would ask myself, “ How efficient is the market right now and should I buy more shares at this price? ” My decision to sell should be motivated not only by the price but also by the fundamental reasons for the decline.
For me, the main criterion for closing a position is the company's profitability - a metric that is the same for everyone who looks at it. If a business stops being profitable, that's a red flag. In this case, the time the company has been in a loss-making state and the size of the losses are considered. Even a great company can have a bad quarter for one reason or another.
In my opinion, the main work with risks should take place before the company gets into the portfolio, and not after the position is opened. Often it doesn't even involve fundamental business analysis. Here are four things I'm talking about:
- Diversification. Distribution of investments among many companies.
- Gradually gaining position. Buying stocks within a range of prices, rather than at one desired price.
- Prioritization of sectors. For me, sectors of stable consumer demand always have a higher priority than others.
- No leverage.
I propose to examine the last point separately. The thing is that the broker who lends you money is absolutely right to be afraid that you won’t pay it back. For this reason, each time he calculates how much his loan is secured by your money and the current value of the shares (that is, the value that is currently on the market). Once this collateral is not enough, you will receive a so-called margin call . This is a requirement to fund an account to secure a loan. If you fail to do this, part of your position will be forcibly closed. Unfortunately, no one will listen to the excuse that this company is making a profit and the market is insane. The broker will simply give you a Stop-Loss. Therefore, leverage, by its definition, cannot be used in my investment strategy.
In conclusion of this article, I would like to say that the market, as a social phenomenon, contains a great paradox. On the one hand, we have a natural desire for it to be ineffective, on the other hand, we are all working on its effectiveness. It turns out that the income we take from the market is payment for this work. At the same time, our loss can be represented as the salary that we personally pay to other market participants for their efficiency. I don't know about you, but this understanding seems beautiful to me.

Elon Musk vs TeslaElon Musk is a master at turning Tesla from a struggling startup into a company worth hundreds of billions of dollars. He has used an exceptionally smart stock price strategy to raise capital, scale up, and maintain control of the entire game.
From the perspective of an American-style investment advisor, Musk’s approach can be broken down into five core strategies:
1. Using Stock Price as Leverage for Cheap Capital
Musk doesn’t make money from profits but from Tesla’s market capitalization.
How it works:
Drive the stock price up → Raise cheaper capital → Keep reinvesting in expansion
No dividends—Tesla reinvests all profits to grow (similar to Amazon)
Borrowing against his own stock—Musk has used Tesla shares as collateral to borrow tens of billions of dollars
Examples:
In 2020–2021, as Tesla's stock surged, Musk raised over $10 billion by selling shares at high prices.
In November 2021, Musk sold over $16 billion worth of Tesla stock to fund SpaceX and Twitter.
⮕ A high stock price allows Tesla to issue new shares at almost no cost.
2. Selling a Vision Beyond Just Electric Cars
Tesla is not a car company—it is a technology, energy, AI, and robotics company.
Musk has convinced investors that:
✅ Tesla will become the world’s largest automaker
✅ Tesla cars will achieve full self-driving (FSD)—unlocking massive new revenue streams
✅ Tesla isn’t just selling cars but also software, robotaxis, AI, and energy storage
⮕ This makes investors value Tesla like a tech company rather than a traditional automaker (with a much higher P/E ratio than Ford or GM).
⮕ Investors are willing to pay a premium for Tesla stock because they believe in its explosive future growth.
3. Creating FOMO Through Media & Personal Branding
No CEO in the world leverages media better than Musk.
💥 Twitter/X is his ultimate weapon.
Every time Musk tweets, Tesla’s stock price can swing by billions of dollars.
He constantly teases breakthrough products (Cybertruck, FSD, AI) to excite investors.
No need for traditional advertising—every Musk statement is a free PR campaign.
⮕ This creates a cult-like following among retail investors, driving up Tesla's stock price through FOMO (Fear of Missing Out).
4. Hiring the Best Talent in the World
Musk isn’t just a strategist—he’s also a master at recruiting and retaining top talent.
🏆 World-class engineering team:
Tesla doesn’t hire traditional auto executives—it hires the best tech engineers from Google, Apple, and SpaceX.
Musk enforces a "100-hour workweek" culture focused on high performance.
🏆 Stock-based compensation to retain talent:
Tesla pays employees with stock, motivating them to grow the company and drive the stock price higher.
Musk rewards leadership with stock options, ensuring long-term commitment.
⮕ Result: Tesla has the strongest team in the industry, continuously innovating and improving products.
5. Positioning Tesla as the "Apple of EVs"
Tesla doesn’t sell cars like Toyota or Ford—it sells an experience and an ecosystem, like Apple.
📌 Tesla cars are “smartphones on wheels”:
Constant OTA (Over-the-Air) software updates (like iOS updates).
Tesla’s user experience feels more like a tech product than a traditional car.
Exclusive ecosystem (Supercharger network, FSD, Tesla Energy).
📌 Smart pricing strategy:
Initially, Tesla priced cars high to establish a premium brand.
Later, it cut prices to dominate the market once it had a competitive edge.
⮕ This makes Tesla buyers feel like they’re purchasing a futuristic tech product, not just a car.
Conclusion: Why Is Tesla “Unstoppable”?
Tesla is not just another car company. It is a tech empire with a brilliant strategy:
✅ Using a high stock price to raise cheap capital
✅ Selling a vision, not just cars
✅ Leveraging media to create FOMO
✅ Attracting top talent with Silicon Valley culture
✅ Building an ecosystem & positioning itself like Apple
⮕ Thanks to this, Tesla can keep growing rapidly despite not having huge profits yet, and Musk can control the financial game on his own terms.

Tesla technical analysis CMP 362Analyzing price chart using Fibonacci retracement levels and Elliott Wave Theory.
Key levels are as follows:
$ 352: Strong support due to the 20 EMA and 0.68 Fib retracement. If it holds, a bounce could occur. That makes 352 a critical level—if the price holds and bounces, it could confirm the start of Wave 5
$ 320: If 352 breaks, this is the next major support, aligning with the 0.5 Fib retracement and a past trendline.
If the price holds at either of these levels, you expect it to start Wave 5, aiming for new highs. However, if 320 fails, the entire wave structure might need a bearish recount.

Tesla New ATH - 24/09/24 idea - 100 % bulls eyeTesla Bullish New ATH 488
Chart itself Self Explanatory, analysis made by Multi time frame VWAP analysis

Tesla Bullish CMP 251Tesla Bullish CMP 251
Chart itself Self Explanatory, analysis made by Multi time frame VWAP analysis

Tesla will go to the moonIt’s so easy to see TSLA will go to the moon.
Now, we are in 3th wave
Just buy and waiting your money will be x3, x4

Where to Long $NASDAQ:TSLA NASDAQ:TSLA
Where to Long it. ??
for me its better to wait untill the Price come to its best support.
Observe near 380 or let the price show action after touching it.
NASDAQ:TSLA
Please Comment if have to Say on it.
i will not take it offensive :D
⚠️Disclaimer: We are not registered advisors. The views expressed here are merely personal opinions. Irrespective of the language used, Nothing mentioned here should be considered as advice or recommendation. Please consult with your financial advisors before making any investment decisions. Like everybody else, we too can be wrong at times ✌🏻

Hold long above 413Stay invested or can add above 413
Exit if breaks 385 - trend would turn negative on breaking 385

Possible Wave counts of TSLA Hourly & DailyDaily Time Frame Chart
I am not Sebi registered analyst.
My studies are for educational purpose only.
Please Consult your financial advisor before trading or investing.
I am not responsible for any kinds of your profits and your losses.
Most investors treat trading as a hobby because they have a full-time job doing something else.
However, If you treat trading like a business, it will pay you like a business.
If you treat like a hobby, hobbies don't pay, they cost you...!
Hope this post is helpful to community
Thanks
RK💕
Disclaimer and Risk Warning.
The analysis and discussion provided on in.tradingview.com/u/RK_Charts/ is intended for educational purposes only and should not be relied upon for trading decisions. RK_Charts is not an investment adviser and the information provided here should not be taken as professional investment advice. Before buying or selling any investments, securities, or precious metals, it is recommended that you conduct your own due diligence. RK_Charts does not share in your profits and will not take responsibility for any losses you may incur. So Please Consult your financial advisor before trading or investing.

TSLA - WKLY- CnH-Symmetrical Triangle This chart shows Tesla's price on a weekly timeframe with key technical features:
1. **Cup and Handle Pattern**:
- A bullish reversal pattern formed over the past months, with two rounded bottoms resembling a "cup" shape and a minor consolidation area.
- The breakout above the resistance level confirms the pattern.
2. **Measured Move Targets**:
- **First Target**: $406.69, reached with a 48.95% move.
- **Second Target**: $489.24 for symmetrical triangle reflecting a 72.66% rise from the breakout.
3. **Key Resistance and Support Levels**:
- **Breakout Zone**: Around **$271.73**, the neckline of the cup and handle.
- **Intermediate Resistance**: Around **$406.69**.
- **Current Price**: Trading near **$463.02**.
4. **Volume**: Strong upward volume during the breakout phase, reinforcing the bullish breakout.
If the momentum continues, Tesla's price may target the next resistance near **$489.24**. Let me know if you need further insights!

Tesla for 80 % Gain in 2-3 year. Recently we made 50% money on Tesla stock with previous Tesla idea published on 11 April 2024 . now Tesla is giving another opportunity which can give a potential gain of 80 % within 3 year time Frame.

Tesla Next Target is Top of the Channel +26% ROITesla, a Breakout occurred from the Triangle Pattern after reaching the 0.5 Fibonacci Retracement level, and it's also trading within a Channel Pattern. The Next Target is the Top of the Channel.


Tesla Inc. (TSLA) NASDAQ @ 321.22Tesla Inc. (TSLA) NASDAQ @ 321.22
Supports: 138/101
Resistance: 414.55
As long as 138 holds support, We can see big bull move.
As per my analysis, we are in the wave (3).
Immediate target for this up move is 357 and followed by 414, 455.
Ultimate target for this move is 512-612.
LONG TERM TARGETS: (512-612), 670, (764-830-921), 1034, (1155-1221-1334).
My view: BUY on DIPS for 500/700/1000+

ready for targets TESLAStock looks good to add at current levels , as Elon Musk is a pro Trump supporter, we can see targets till 753

Tesla Robot taxi theme play soon over ?
Strong downturn momentum signal in Elliot wave oscillators in last few session was strong
The next support see at 212.50, target for rebound resistance see at 230.00
If it might arrive this trendline support in next session, RSI shows oversold in 1 hour chart.
The next strong support 200.00-205.00

Tesla buy near 205-200 If Tump Win then 1000+ in next 4 years Disclaimer -
This information is only for educational purposes, this is not for any buy or sell recommendations .
On Our Harmonic pattern indicator
based trade setup take trade as explained below :-
ENTRY -
When price breaks 30% retracement Which is D points then take Entry on Buy or Sell Trade
SL -
SL is (-3%) Which is mentioned in Chart . our SL is just above or below of Recent high or Low .
TARGET -
Target 1- (T1 : 61.8 %)
Target 2- (T2 : 88.6 %)
Target 3- (T3 : 127.2 %)
Target 4- (T4 : 161.8 %)
Please note:-
It's working on news based and volitile market very well so exit if SL hit

TSLA: Ready for a Space Trip?As per chart action we all can see that TSLA is now heading upwards journey.
with TSLA now, umbrella company SPACEX is also doing good in its segment and TSLA is getting better opportunity to do manufacturing and enter in developing countries like india etc.
Also with Giga Factory expansion and making New Tesla cell technology
with that they can use that technology to take advantege in their new products also.
With current price(260) with target of new high (around 420-440) and with SL of 140.
It does not constitute and cannot replace investment advice. We therefore recommend that you contact your personal financial advisor before carrying out specific transactions and investments.
