WTI (Crude Oil) - Bullish SetupWTI has been trading under this trendline since March' 2022. Inflation adjusted oil is the cheapest commodity avaiable currently and the type of bull run we have seen in all other commodties since last year, i expect it is oils turn to shine now. Tracking this trendline closely, and once it is broke
Is crude headed north?Crude CMP $63.49
Elliott- this entire correction to me is the 2nd wave and now the 3rd wave should commence from here.
Directional signal- the double bottom is a directional signal. It needs to close above 69 on the monthly basis to confirm the same.
Fibonacci- it made a double bottom at the f
Crude Oil Analysis BearishCrude Oil Analysis (4H Chart)
- The primary trend in oil turned bullish.
- On the 4H chart, the prices have recently tested the upper trendline of the symmetrical triangle pattern and are showing signs of weakness.
- The prices have also recently tested the upper Bollinger band, with RSI turning
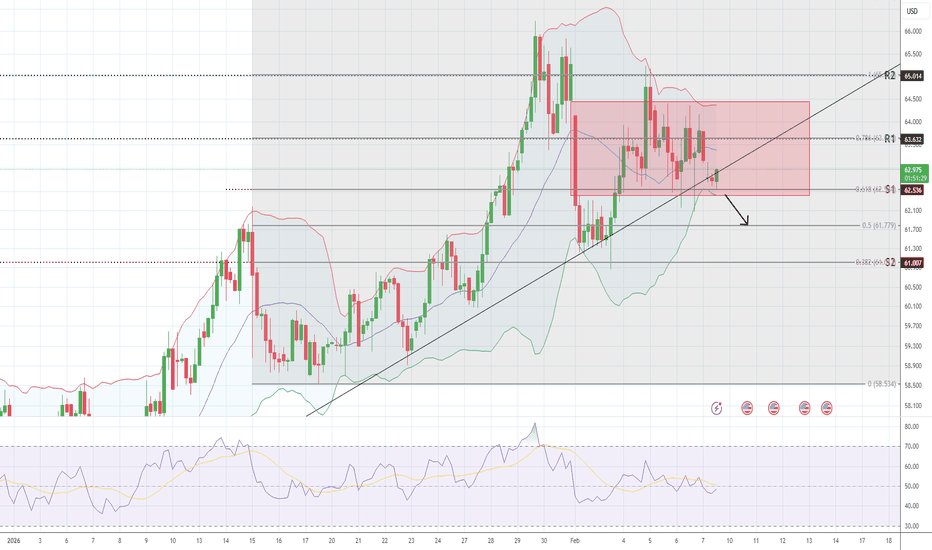
Intraday Crude Oil Analysis Feb 09, 26The primary oil trend turned bearish, and on the 4H chart, the prices have breached the ascending trend line with a gap-down opening for the week. Currently, the prices are resting at the strong immediate hurdle of fib level 0.618 (62.50), a breach of which drives the prices lower towards far suppor
Forex Trading (Currency Pairs)Introduction to Forex Trading
Forex trading, also known as foreign exchange trading or FX trading, is the global marketplace for buying, selling, and exchanging currencies. Unlike stock markets that operate from specific locations, the forex market is decentralized, operating electronically across
US Oil Has just broken out of Inverted H&S PatternTVC:USOIL has broken the neckline at $62 on a daily chart and, along with other commodities, is ready to climb to $70 levels in the coming weeks.
We keep $58 is the hard stop if the price recedes below the neckline.
Historically, rallies in Gold, Silver, and Crude Oil go hand in hand, though thi
Daily 1:30 PM IST Crude Oil Trend Setup StrategyPrice action traders on MCX WTI Crude Oil can capture reliable intraday trends by focusing on setups around 1:30 PM IST, using 15-minute - 1hr charts with support/resistance levels and a 10-20 EMA crossover confirmation. This timing aligns with active MCX sessions when momentum builds post-initial
See all ideas
Displays a symbol's price movements over previous years to identify recurring trends.


