Institution Option Trading🏢 Who Are These Institutions?
Institutions involved in option trading include:
🏦 Hedge Funds
🏢 Proprietary (Prop) Trading Firms
💼 Investment Banks
🌍 FIIs/DIIs
🧠 Pension Funds & Insurance Companies
They trade options across equities, indices (like Nifty/Bank Nifty), commodities, and currencies, often managing portfolios worth hundreds of crores.
🔍 Institutional Option Trading Strategies
1. Delta Neutral Strategy (Market-Neutral)
Example: Sell ATM straddle and hedge with futures.
Objective: Profit from time decay (theta) while keeping position neutral to price movement.
2. Volatility Arbitrage
Institutions bet on difference between implied and actual volatility.
Buy options when IV is low, sell when IV is high.
3. Calendar Spreads
Sell near expiry option, buy longer expiry of the same strike.
Used when institutions expect IV to rise but minimal short-term price movement.
4. Iron Condors and Butterflies
Multi-leg strategies for range-bound markets.
Used with large capital to generate steady income with limited risk.
5. Protective Puts / Covered Calls
Portfolio hedging: buy puts to protect against downturns, sell calls to earn extra income.
Very common among mutual funds and long-term portfolios.
📈 Option Chain Reading – Institutional Footprint
When institutions enter or adjust option positions, they leave footprints in the option chain. You can spot them by watching:
Sudden spike in OI (Open Interest) at specific strikes
Sharp rise in IV without much price movement
Heavy Put or Call writing near resistance/support zones
Unusual option activity (UOA) before key events
⚠️ How Retail Traders Can Learn From Institutional Option Trading
Track Option Chain + OI Changes Daily
Learn to Read Greeks Before Taking a Trade
Watch How IV Shifts Before & After Events
Backtest Simple Institutional Strategies (e.g. ATM Straddles)
Focus on Consistency and Capital Protection
🛑 Common Retail Mistakes in Options (Avoided by Institutions)
Buying deep OTM options blindly
Overtrading in low-volume strikes
Selling naked options without hedge
Ignoring IV or theta decay
Trading without stop-loss or adjustment plans
🧘 Conclusion: Why Mastering Institutional Option Trading Matters
Understanding how institutions trade options allows you to:
✅ Avoid emotional traps
✅ Trade with the flow of smart money
✅ Use real risk management
✅ Build income and protection strategies
✅ Improve win-rate and longevity in trading
U.S. Dollar / Japanese Yen
148.530JPYR
+0.744+0.50%
As of today at 18:06 GMT
JPY
No trades
USDJPY trade ideas
Learn Advanced Institutional Trading🎓 Learn Advanced Institutional Trading
Advanced Institutional Trading is the high-level skill of trading financial markets the way professional institutions do — using big data, smart tools, and strategic decision-making to consistently win in the market. 💼📊
Learning this means going beyond basic charts or trendlines. It’s about understanding how big money moves, and how to:
🧠 Read institutional order flow
📉 Trade with algorithms and dark pools
📈 Use volume, liquidity zones & smart money indicators
🛡️ Apply institutional-level risk management
⚙️ Trade options, futures, and other derivatives at scale
💬 Interpret economic data like banks and funds do
You’ll learn to:
Identify entry and exit points based on institutional footprints
Use macro and micro market analysis
Build a trading system with logic and consistency
React to live news, earnings, and global events the way hedge funds do
📌 In simple words:
Learning Advanced Institutional Trading gives you the mindset, tools, and strategies used by the top 1% of traders — so you can trade smart, calculated, and professional just like the big players.
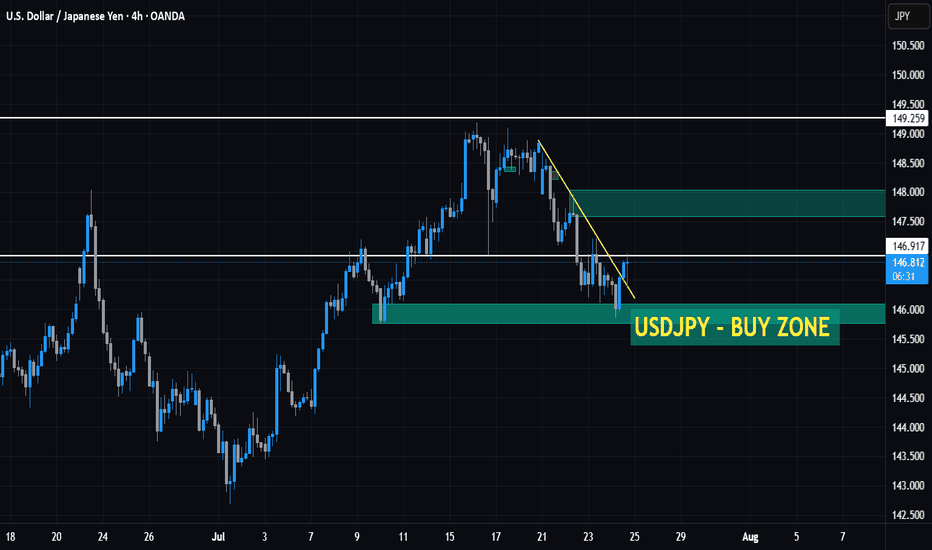
USDJPY - 4HR BUY SETUP🟡 USD/JPY – Smart Money Setup Around 4H Order Block
Pair: USD/JPY
Trade Bias: Long
Position Type: Small Quantity (Not A+ Setup)
Setup Basis: 4H OB + Liquidity Sweep + CISD Pattern
---
🔍 Market Breakdown:
Price is currently reacting inside a 4H Bullish Order Block.
A clear liquidity sweep has occurred just before the reaction, hinting at potential Smart Money activity.
A CISD (Complex Internal Structure Displacement) pattern is developing, often a precursor to market direction shifts.
---
✅ Trade Plan:
Long Entry only after SMC confirmation above: 147.250
Execution: Look to enter on the retest after the break of 147.250 (only if confirmation is strong).
Stop-Loss: Placed at 145.700 to stay below structure and liquidity traps.
Target Zone: To be updated based on price delivery post-confirmation.
⚠️ This is not a premium-grade setup, so position sizing remains reduced to manage risk properly.
---
📌 Important Notes:
This trade idea is shared for educational and analytical purposes.
Always trade based on your own plan, and follow strict risk management.
---
📣 Like clean breakdowns rooted in Smart Money Concepts?
✅ Follow for more:
Institutional-style entries
OB + Liquidity + Structure combos
High RR setups with precise SL logic
#USDJPY #SmartMoney #Forex #OrderBlock #LiquiditySweep #CISD #PriceAction #SMC #TradingView #FXSetups
Option Trading💼 Option Trading 📉📈
Leverage. Flexibility. Strategic Advantage.
Option Trading is a powerful segment of the financial markets where traders and investors use derivative contracts—known as options—to speculate, hedge, or generate income. Unlike traditional stock trading, options give you the right (but not the obligation) to buy or sell an asset at a predetermined price, within a specific time frame.
It’s a strategic tool used by everyone from retail traders to hedge funds to gain exposure with limited risk and amplified potential.
🔍 Key Concepts:
✅ Call Option – Gives the right to buy an asset at a fixed price (strike)
✅ Put Option – Gives the right to sell an asset at a fixed price
✅ Premium – The price paid to buy the option contract
✅ Strike Price – The level at which the option can be exercised
✅ Expiry Date – The date on which the contract expires
✅ In-the-Money / Out-of-the-Money – Describes the moneyness of a position relative to current price
⚙️ Why Trade Options?
🔹 Leverage – Control larger positions with smaller capital
🔹 Flexibility – Bullish, bearish, neutral—there’s a strategy for every view
🔹 Defined Risk – Max risk = premium paid (in buying options)
🔹 Income Generation – Sell options (covered calls, credit spreads) for passive income
🔹 Hedging – Protect existing stock positions from volatility or loss
Option trading isn’t gambling—it’s a game of precision, risk management, and market insight. To succeed, you need to master:
USDJPY – Buying momentum builds, uptrend in sightUSDJPY has just bounced strongly from the key support zone around 142.510 – a level that has acted as a “fortress” over the past two weeks. Price action is gradually regaining momentum, forming a potential double bottom and heading toward a retest of the long-term descending trendline.
Currently, the 144.800–145.000 area is the nearest resistance, aligning with both the EMA and the descending trendline. If buyers maintain control, a breakout above this zone could pave the way for the next leg up toward 145.750 and beyond.
In terms of news, the latest U.S. ISM Services data came in weaker than expected, reducing rate hike expectations. While this puts mild pressure on the USD, the reaction from USDJPY suggests the market is leaning toward a rebound rather than a breakdown.
Master Candle Sticks part-2🔥 What Are Candlesticks?
A candlestick is a visual representation of price movement within a specific time period (1 minute, 1 hour, 1 day, etc.). It consists of:
Body – The area between the open and close.
Wick (Shadow) – The high and low prices reached.
Color – Usually green (bullish) or red (bearish).
🧠 Why Learn Master Candlestick Patterns?
Mastering candlestick patterns helps traders:
Identify trend reversals or continuations.
Get early entry or exit signals.
Understand market psychology and price action.
Improve risk-reward ratios in trades.
🧭 Top Master Candlestick Patterns (Explained Simply)
Here are some of the most important candlestick patterns every trader should master:
1. Doji
🔍 Indecision in the market
Shape: Small body, long wicks
Meaning: Buyers and sellers are equal – could indicate a reversal if found after a trend.
Types: Standard Doji, Long-Legged Doji, Dragonfly, Gravestone
2. Hammer 🔨
📈 Bullish reversal pattern
Shape: Small body at top, long lower wick
Appears: After a downtrend
Signal: Buyers are stepping in strongly
3. Inverted Hammer
📈 Also bullish reversal
Shape: Small body at bottom, long upper wick
Appears: After a downtrend
Signal: Buyers testing resistance – may rise soon
4. Shooting Star 🌠
📉 Bearish reversal
Shape: Small body at bottom, long upper wick
Appears: After an uptrend
Signal: Sellers taking control
5. Engulfing Patterns
A. Bullish Engulfing
Two candles: First red (small), second green (larger, fully covers the red)
Appears: At the bottom of a downtrend
Signal: Strong reversal to upside
B. Bearish Engulfing
Two candles: First green (small), second red (large, covers the green)
Appears: At the top of an uptrend
Signal: Reversal to downside
6. Morning Star 🌅
📈 Three-candle bullish reversal
1st: Long red
2nd: Small (any color)
3rd: Strong green
Appears: After downtrend
7. Evening Star 🌇
📉 Three-candle bearish reversal
1st: Long green
2nd: Small (indecision)
3rd: Strong red
Appears: After uptrend
8. Marubozu
💡 Strong trend candle
No wicks (only body)
Green Marubozu: Full bullish power
Red Marubozu: Full bearish power
9. Spinning Top
🔄 Low momentum or indecision
Small body, equal upper and lower wicks
Shows uncertainty – market could reverse or consolidate
📘 Tips to Master Candlestick Reading
Don’t rely on just one candle. Always see the pattern in context of previous trend.
Use volume with candlesticks – A reversal candle with high volume is more powerful.
Combine with other tools – Support/Resistance, Moving Averages, RSI, etc.
Practice on charts daily – Backtest on historical data
✅ Final Thoughts
Master Candlestick Patterns are a foundation for price action trading. They don't work alone but when used wisely with technical indicators and proper risk management, they can give high-probability setups.
Define Option Chain✅ Definition of Option Chain (Explained Simply)
An Option Chain is a table or list that shows all available option contracts (Calls and Puts) for a particular stock or index — along with key data like strike prices, premiums, open interest, and more.
It helps option traders quickly analyze where the market expects the stock or index to move, reverse, or stay range-bound.
📘 In Simple Terms:
An option chain is like a scoreboard of what traders are betting on — whether prices will go up or down, and at what level.
🧩 What Does an Option Chain Show?
An option chain is divided into two parts:
Call Options (CE) 🔵Strike Price Put Options (PE) 🔴
Each row in the option chain represents:
A specific strike price
Its call and put premiums
Open interest (OI) — number of contracts open
Change in OI — fresh buying/selling activity
Volume — how many contracts traded
Implied Volatility (IV) — market’s expected volatility
🧠 Key Terms in Option Chain (Explained Simply)
Term Meaning in Easy Words
Strike Price The price at which you can buy/sell the underlying asset
Call Option (CE) Bets the price will go up
Put Option (PE) Bets the price will go down
Premium The price you pay for buying 1 option
Open Interest (OI) How many contracts are currently open
Change in OI How many contracts were added or closed today
Volume Number of contracts traded today
IV (Implied Volatility) Market’s prediction of future price fluctuation
📊 What You Can Learn From It:
Where traders expect support (high Put OI zones)
Where traders expect resistance (high Call OI zones)
Which strikes are seeing new buying/selling activity
Possible expiry range (Max Pain level)
📍 Example (Bank Nifty Option Chain Sample):
CE (Call Options) Strike PE (Put Options)
OI: 5.2 lakh 49,000 OI: 6.1 lakh
OI: 8.4 lakh 🟩 49,500 OI: 10.3 lakh 🟥
OI: 12.1 lakh ✅ 50,000 OI: 9.5 lakh
✅ Highest Call OI = 50,000 → Resistance
✅ Highest Put OI = 49,500 → Support
➡️ So, market may stay between 49,500 and 50,000 for now
🧠 Why Option Chain Matters for Traders:
Helps spot support/resistance without charts
Identifies where big institutions are writing options
Assists in building option strategies (like Iron Condor, Straddles)
Key for expiry day (Thursday) trades
✅ Summary:
Option Chain Is... Option Chain Helps You...
A table of all calls & puts Find support & resistance from OI levels
Loaded with strike-wise data See where traders are buying/selling most
Used in options trading Predict expiry range & big player activity
A Break Above 149 Could Trigger a Domino EffectOANDA:USDJPY continues to exhibit a robust bullish structure, with successive Fair Value Gaps (FVGs) signaling that smart money is layering into long positions. The Ichimoku cloud is expanding, underscoring a healthy uptrend with no immediate signs of exhaustion. Notably, trading volume has surged around the 148.6–148.9 zone, suggesting a high-liquidity cluster that could soon be swept.
Should USD/JPY break decisively above the psychological resistance at 149.00, the market may trigger a “liquidation chain” — a cascading stop-loss event that could catapult price toward the 150.50 region in the next bullish wave.
This move wouldn’t merely be a technical breakout — it could act as a bull-driven acceleration trap, aiming to force momentum into new highs. Trend-following traders should be on high alert for a potential “liquidity explosion” once the 149 barrier is breached.
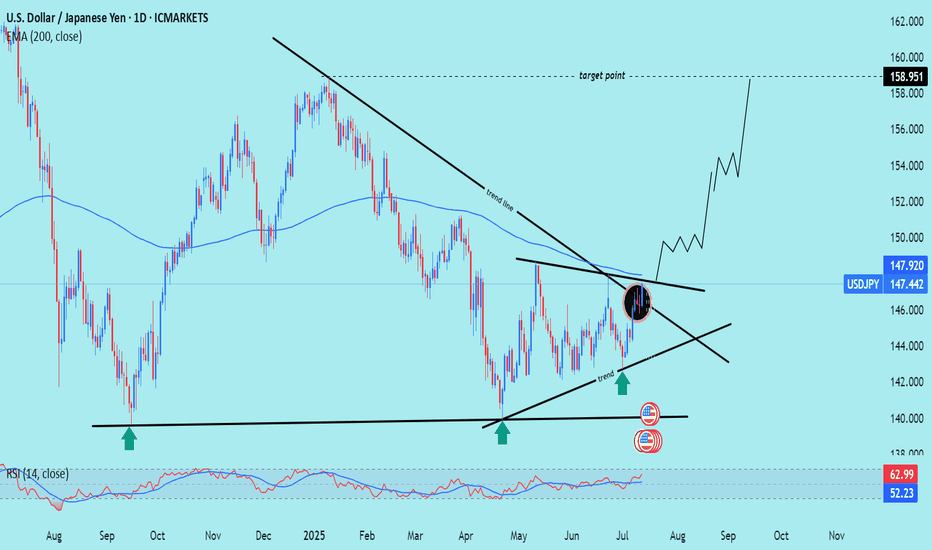
USD/JPY) LOGN TIME Analysis Read The captionSMC trading point update
Technical analysis of USD/JPY on the daily timeframe, highlighting a long-term downtrend reversal with potential for significant upside.
---
Analysis Summary
Pair: USD/JPY
Timeframe: Daily
Current Price: 147.442
Bias: Bullish breakout from a descending wedge structure.
---
Key Technical Insights
1. Descending Trendline Break:
Price has broken above the long-term downtrend line, signaling a reversal.
Breakout area is circled in yellow, confirming bullish intent.
2. Trendline & Structure Support:
Multiple rejections from the ascending support trendline (marked by green arrows) confirm accumulation and higher lows.
3. 200 EMA as Dynamic Resistance/Support:
Price is now above the 200 EMA (147.920) — a bullish signal, turning resistance into support.
4. RSI (14):
RSI at 62.99, approaching overbought territory, but still has room to push further.
---
Target Point
Target: 158.951
Based on measured move from wedge breakout and historical resistance level.
---
Trade Setup Idea
Direction Entry Stop-Loss Target
Buy 147.40–147.60 Below 145.80 158.95
Mr SMC Trading point
---
Summary
This chart signals a major bullish breakout on USD/JPY, with the break of a year-long downtrend structure, reclaiming the 200 EMA. If this breakout sustains, price could aim for 158.95 in the coming weeks.
Please support boost 🚀 this analysis)
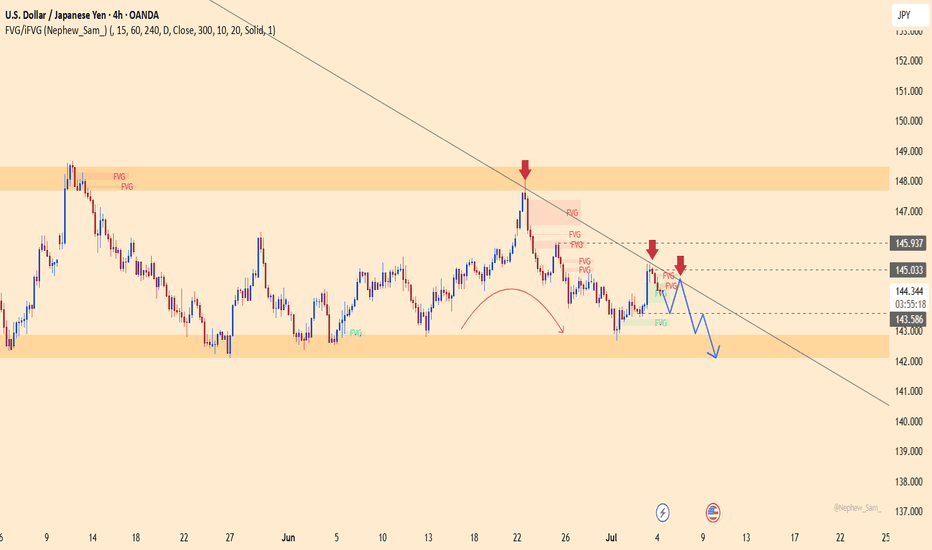
USDJPY – Is the Downtrend Taking Shape?On the H4 chart, USDJPY shows signs of weakening as it repeatedly fails to break above the long-term descending trendline. Despite a recent recovery toward the 147.000 level, buying momentum appears to be fading. The price structure suggests the possibility of a false breakout before a reversal toward the 144.300 support zone—an area with multiple unfilled FVGs.
From a news perspective, traders are awaiting today’s upcoming U.S. CPI report. If inflation data comes in hotter than expected, the USD may gain short-term strength. However, a weaker CPI reading could trigger a quick reversal in USDJPY, confirming the bearish setup. The 147.000 level remains the critical zone to watch for any potential rejection or breakout.
USDJPY: Weak Rebound, High Downside RiskUSDJPY remains under bearish pressure as price continues to be rejected at the descending trendline resistance. The 145.000–145.100 zone acts as a strong resistance area where price has repeatedly reversed.
The recent upward move appears to be a weak pullback, lacking the momentum to break the previous bearish structure. If price continues to be rejected at this zone, a likely correction towards the 142.100 support area is expected.
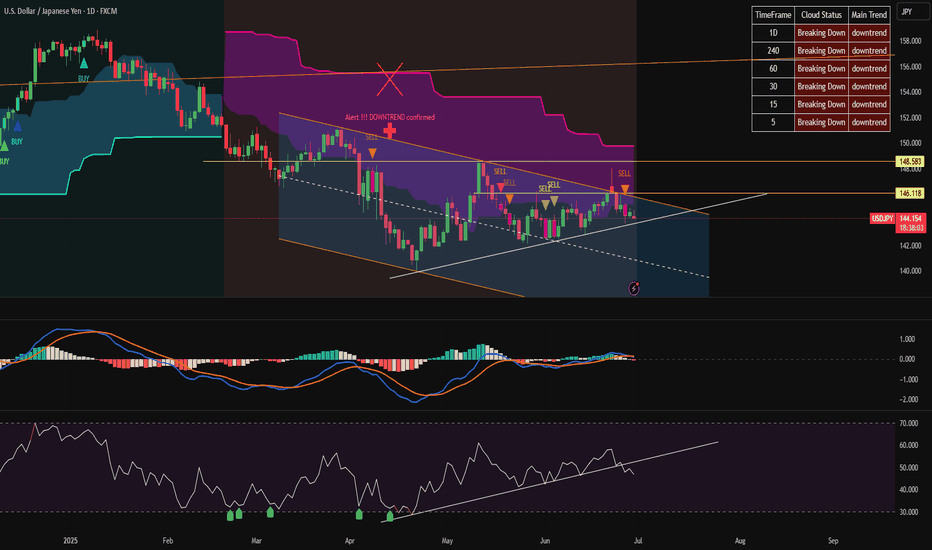
USD.JPY Strong sell all time frameas analyzed before.
USD.JPY has given strong sell signal on all time frames.
the indicator is in sync all time frame sell and now price has fallen through the trendline. signaling a strong downtrend of USD.JPY
we continue to look for sell signal when price recovers at time M15+h1
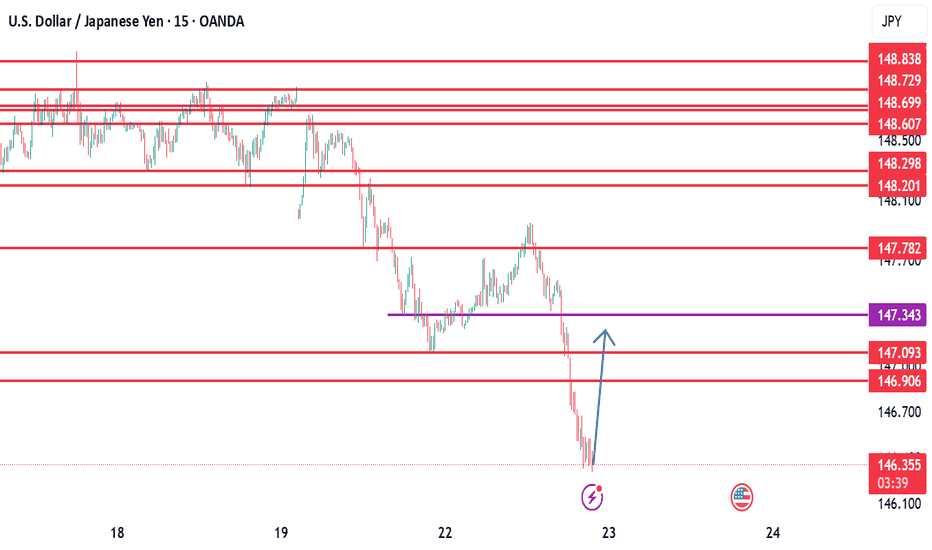
USDJPY Trade Recommendation – Second SELL Entry (15-Min Chart)🔻 Strategy: Continue selling with the short-term downtrend, entering on technical pullback
🎯 Trade Setup:
Sell Entry Zone: 143.94 – 144.00
Stop Loss (SL): 144.45 (just above SMA89 and minor resistance zone)
Take Profit (TP): 143.28 – 143.36
Risk:Reward Ratio: Approx. 1:2.5 to 1:3
📊 Technical Analysis:
1. Trend Direction:
The market is clearly in a short-term downtrend on the 15-minute timeframe.
Price has been forming lower highs and lower lows, indicating strong bearish pressure.
2. Dynamic Resistance – SMA89:
SMA89 (red line) is acting as dynamic resistance, consistently rejecting price.
The entry zone aligns with previous minor resistance and the down-sloping SMA, making it ideal for re-entry short positions.
3. Target Zone – Technical Support:
TP zone (143.28 – 143.36) is a recent swing low/support level, likely to be revisited if bearish momentum continues.
=> Fl and tradding with me!
USD/JPY pair gives full time sell signal.Looking at the D1 chart, we can see one thing, USD/JPY has given a strong bearish signal, a bet expecting the price to decrease by 1,000 pips with time D1.
On h1, there is a clear bearish signal, you can also find a suitable signal on M15 for this USD/JPY bet
USD JPY Weekly Free Analysis (28-06-25 to 05-07-25)USD JPY
USD/JPY is showing signs of a potential rebound from the 144.00–143.50 zone as the U.S. dollar remains strong heading into key economic data next week. The Federal Reserve’s hawkish stance, with no immediate signs of rate cuts, continues to support USD demand.
Meanwhile, the Bank of Japan remains ultra-dovish, keeping interest rates near zero or negative, and showing little urgency to tighten policy. This divergence in monetary policy keeps pressure on the yen, especially as Japanese inflation is still under control and economic growth is moderate.
Technically, the pair may dip slightly before bouncing back up toward 145.50+, as suggested by the V-shaped recovery pattern forming.
Key Points:
Fed staying hawkish, supports USD
BoJ remains dovish, weak JPY outlook
Technical support around 143.50–144.00
Upcoming US data (NFP & ISM) could boost USD
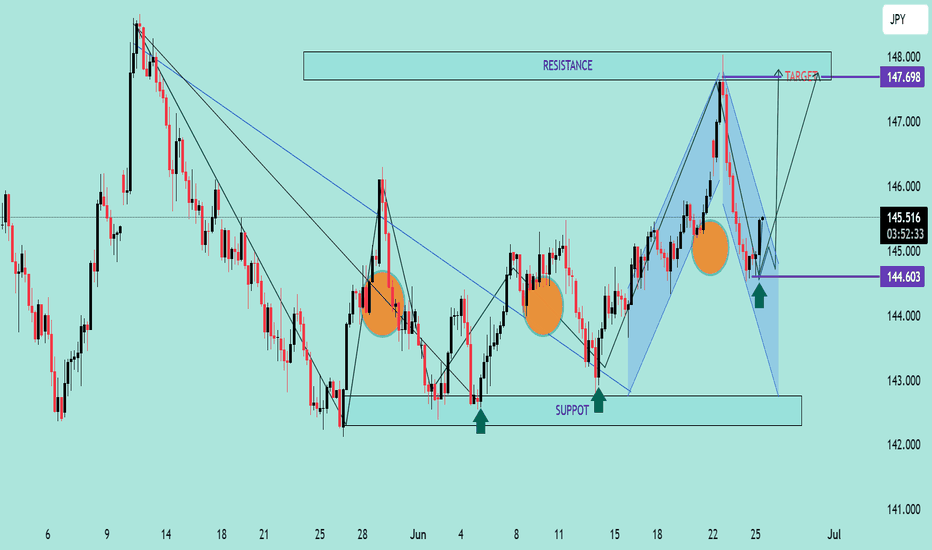
USD/JPY Bullish Reversal AnalysisUSD/JPY Bullish Reversal Analysis 📈💹
🔍 Technical Overview:
The chart illustrates a strong bullish reversal pattern forming on USD/JPY after price reacted from a key support zone at 144.600. This level has held firm multiple times, marked by green arrows, signaling strong buying interest.
📐 Chart Patterns & Structure:
✅ A bullish harmonic pattern (possibly a bullish Bat or Gartley) is completing near the 144.600 zone.
🔄 Multiple rejection wicks and bullish engulfing patterns indicate a potential upside reversal.
🔵 Descending trendlines have been broken, confirming momentum shift.
🔁 Previous resistance turned support (near 145.000) is acting as a possible launchpad for the next move.
🎯 Upside Target:
The projected move targets the resistance zone at 147.698, aligning with previous highs and a significant supply area.
If price breaks above 145.900 convincingly, continuation toward this resistance is expected.
🔻 Downside Risk:
A break below 144.600 would invalidate the bullish setup and expose price to the lower support range near 142.000–143.000.
📊 Conclusion:
USD/JPY is showing signs of bullish reversal from a strong demand zone. If price sustains above 145.000 and breaks the minor consolidation, the pair could rally toward 147.698 🎯.
Bias: Bullish ✅
Support: 144.600
Resistance: 147.698
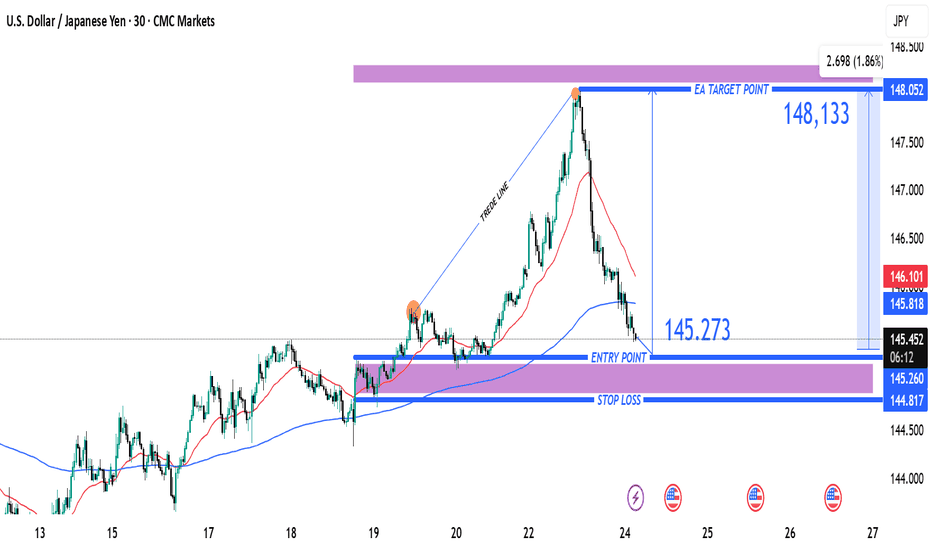
USD/JPY Bullish Reversal Trade Setup – Key Support Test at 145.2Entry Point: 145.273 (highlighted in blue)
Stop Loss: ~144.817–145.260 (purple zone)
Target Point (TP): 148.133 (upper resistance zone)
📉 Recent Price Action:
Price peaked near 148.05 before reversing sharply and breaking the trendline.
The market is currently testing the support zone (near the 145.273 entry level).
Moving averages (red = short-term, blue = long-term) show a crossover to the downside, suggesting short-term bearish momentum.
📈 Trade Setup:
Strategy Type: Long (Buy) Setup
Risk/Reward: Favorable, approximately 1:2+
Entry Zone: The current price is close to the entry level at 145.273, making this a timely area to watch for a bounce or confirmation.
⚠️ Risk Factors:
If price breaks below 144.817, the setup becomes invalid.
Short-term momentum is still bearish; confirmation (like a bullish engulfing candle or support hold) is important before entering.
✅ Confirmation Triggers for Entry:
Strong bullish candlestick pattern near entry zone.
RSI or MACD bullish divergence (not shown but useful to check).
Volume spike on bounce from support.
TRIPLE BOTTOM USD/JPY The Triple Bottom is a bullish reversal pattern that signals a potential shift from a downtrend to an uptrend. It’s like the market saying, “I’ve tested this support level three times, and I’m done going lower.”
Here’s how it plays out:
- Three Equal Lows: Price hits a support level three times, forming three distinct troughs at roughly the same level.
- Resistance Line (Neckline): The highs between the lows form a horizontal resistance. A breakout above this confirms the pattern.
- Volume Clue: Volume often decreases during the formation and spikes on the breakout—showing bulls are stepping in.
Trading Strategy:
- Entry: After a confirmed breakout above the neckline.
- Stop-Loss: Just below the third bottom.
- Target: Measure the distance from the bottoms to the neckline and project it upward from the breakout point.
USD/JPY 4H Chart Analysis – Bullish Breakout Ahead?📈 USD/JPY 4H Chart Analysis – Bullish Breakout Ahead? 🚀💹
The USD/JPY pair is currently approaching a critical resistance zone (145.800 - 146.000), which has acted as a strong supply area in the past. The price has shown bullish momentum as it builds higher lows and heads toward this resistance.
🔍 Key Observations:
🔵 Resistance Zone: Clearly marked and tested multiple times. A breakout above this level could trigger a bullish continuation.
📊 Bullish Structure: The pair is forming a strong uptrend with higher highs and higher lows on the 4H timeframe.
🔄 Retest Scenario: Chart suggests a potential breakout above the resistance, followed by a bullish retest before continuing toward the target zone at ~148.900.
🟢 Upside Target: 148.900 (Previous swing high) – a potential gain of over 300 pips from breakout point.
📌 Trading Outlook:
✅ A confirmed breakout and retest of the resistance zone could offer a high-probability long setup.
❌ A failure to break and hold above the resistance may result in short-term consolidation or reversal.
📅 Watch Levels:
Resistance: 145.800 – 146.000
Support (breakout retest): 145.200 – 145.500
Bullish Target: 148.900
📢 Conclusion: Bulls are in control as long as price sustains above the resistance zone. A clean breakout followed by a retest could offer an attractive buying opportunity with a well-defined risk-to-reward setup. 🔥📊
USDJPY – Momentum Fades Near 146 BarrierUSDJPY is approaching the significant resistance level at 146.020 following a parabolic rebound. This area previously triggered a sharp sell-off, and a minor double top pattern may be forming. If price gets rejected here, the support zone around 144.470 (EMA89 + demand zone) becomes a likely target for a pullback.
The recent upside was supported by hawkish comments from BoJ Governor Ueda, but the main market focus remains on the U.S.–China trade talks. If tensions ease, the USD could weaken, supporting the bearish scenario for USDJPY.


