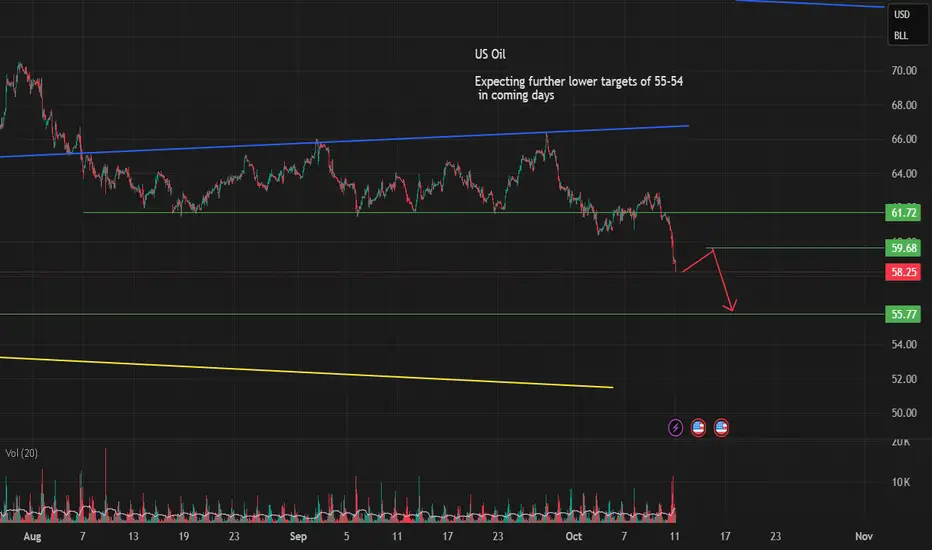
US Oil Expecting further lower targets of 55-54 in coming daysUS Oil
Expecting further lower targets of 55-54
in coming days
Trade ideas
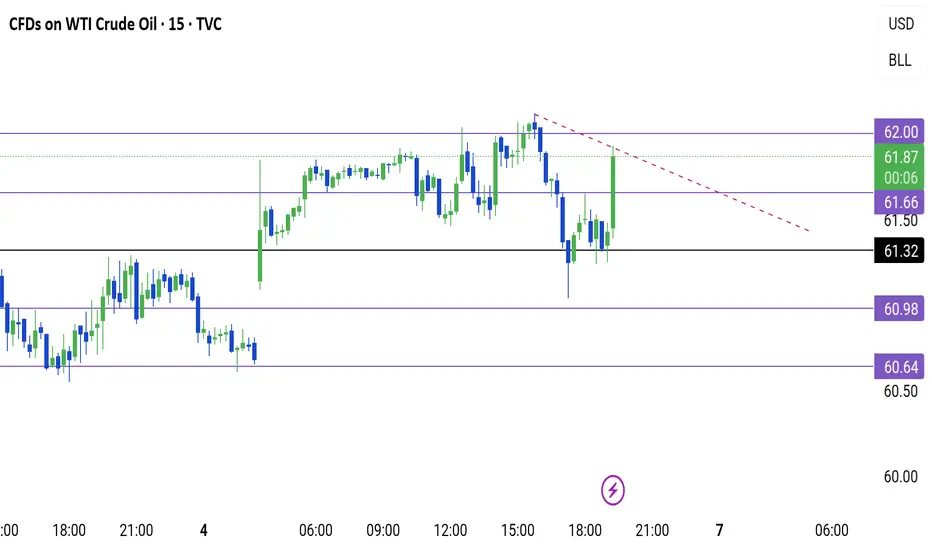
USOIL SUPPORT & RESISTANCE & TRENDLINEResistance at 61.66 and 62. If it breaks the said levels go for LONG.
For SHORT let it break 61.32 next at 60.98 and next at 60.64 if it breaks the last mentioned level it then a nice target downside.
If it breaks the trendline and sustains the plan for LONG.
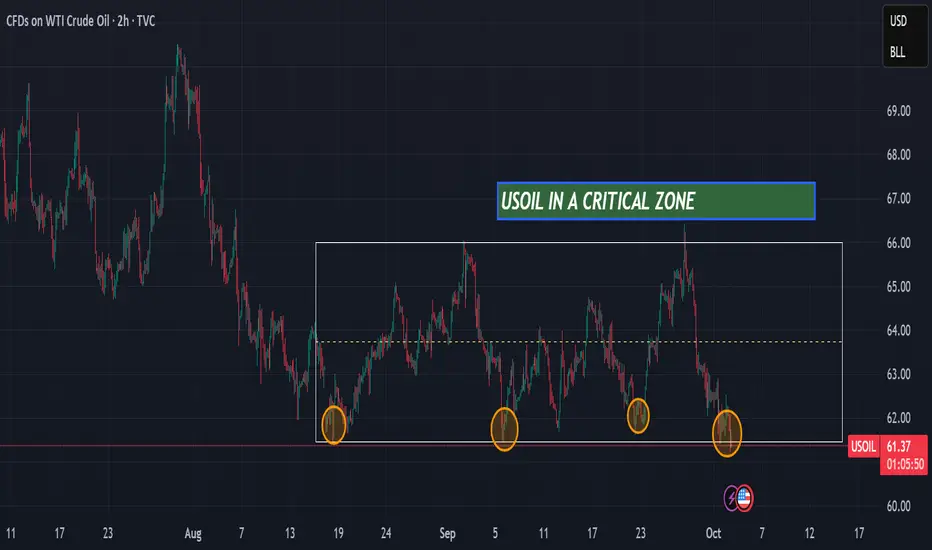
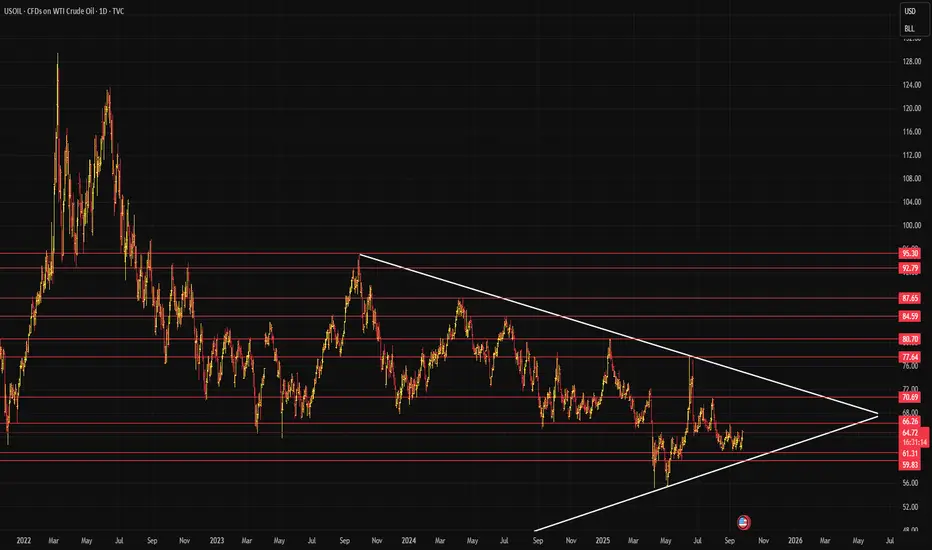
USOIL is in a critical zoneHello,
USOIL is currently at a major support level that has held for the past 2 months. There are two possible scenarios: either the support holds and USOIL bounces back toward the resistance at $66, or the support breaks and the price moves down to the next level at $60,
Ibrouri Abdessamad
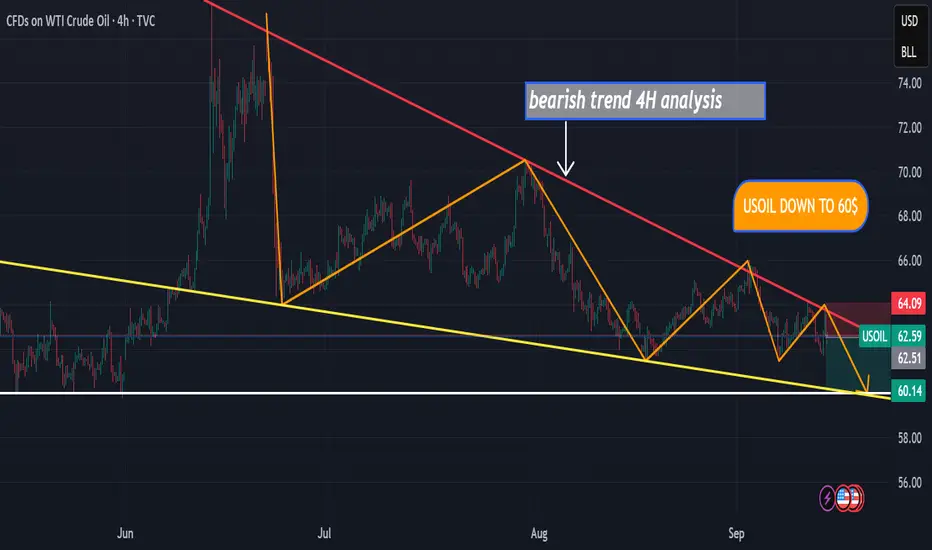
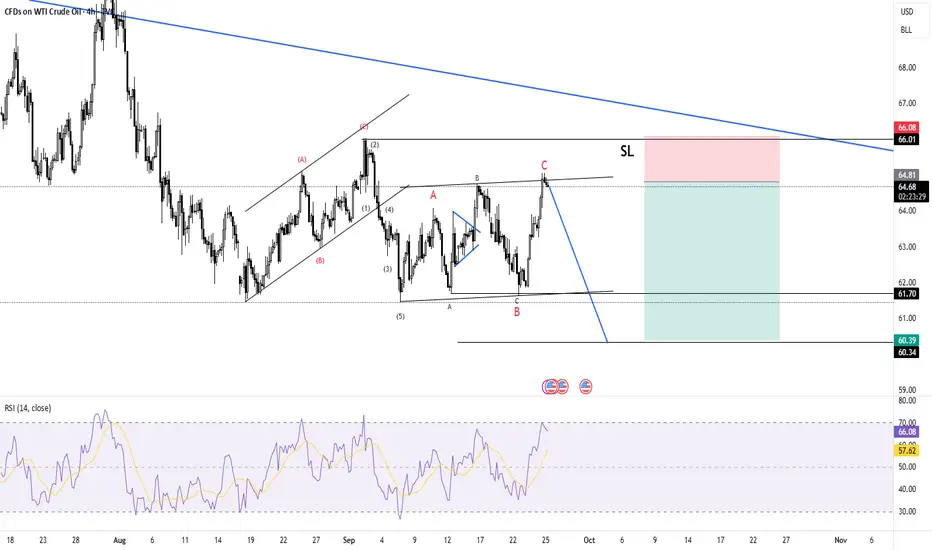
USOIL DOWN TO 60$hello,
I hope you’re doing well. I’ve identified a high-probability short setup on USOIL in the 4H timeframe. The chart is showing a clear downtrend, and based on the current momentum, I expect USOIL to reach the $60 level in the coming days
IBROURI Abdessamad
Buy UsOil Again as previously discussed my long position with low SL we will see this is a big trade and low risk trade

Looks like USOIL Crude has just started risingLooks like USOIL Crude has just started rising with SL near 60 / 62.
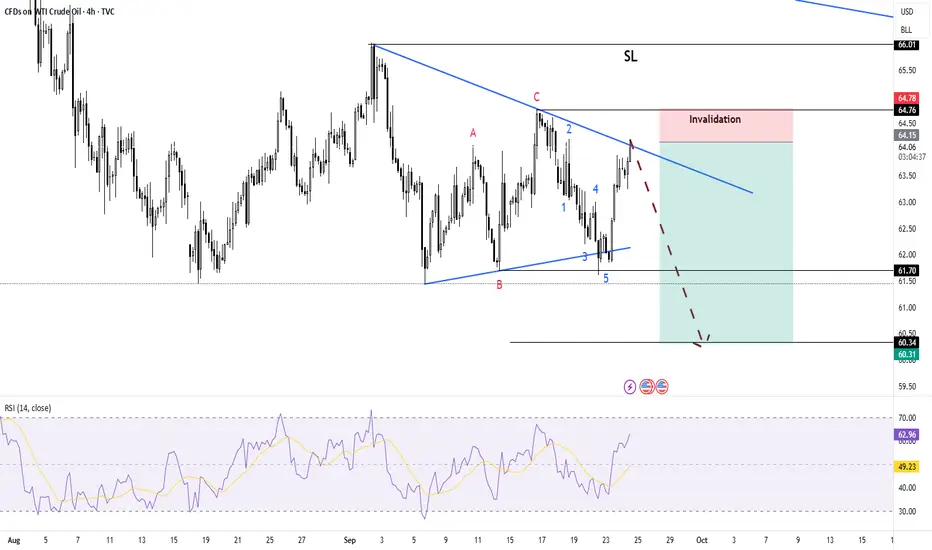
USOIL short setupI see the good risk/reward ratio sell setup in USoil as elliot wave analysis. elliot wave analysis is very complex analysis method and it aways have alternate count, how ever i shorting USOIl as it gives good risk/reward ratio.
US OIL ready to shortI sse USOil with good R/R setup. Impulse down at day TF and abc upward and again impulse downward.
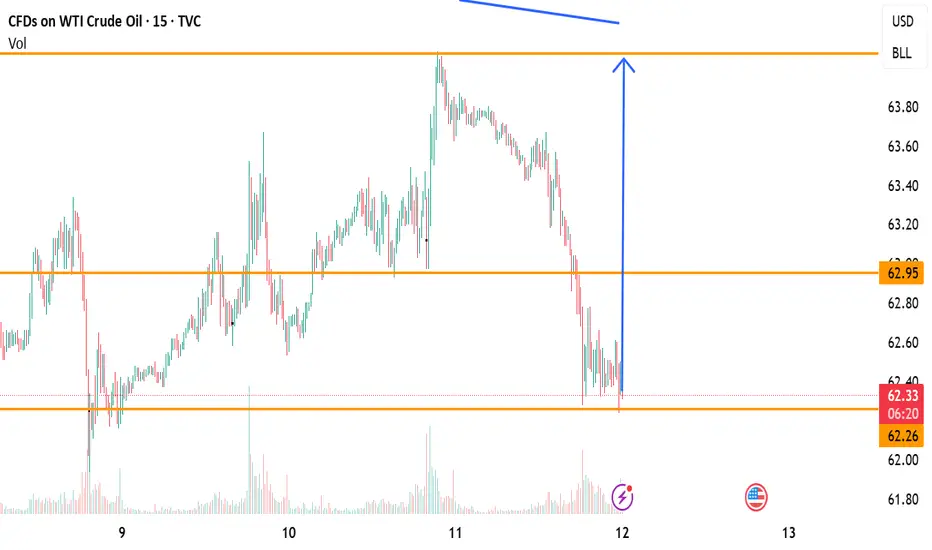
Buy Setup on 15-Min ChartCrude oil is currently holding above the key support near 62.26 and showing signs of reversal after a strong rejection from the lows.
📌 Entry Zone: 62.35 – 62.50
🎯 Target: 62.95
🛑 Stop Loss: 62.26
🔎 Analysis:
Price respected support and formed a bullish rejection wick, indicating buying pressure.
A move above 62.50 could open the way to test resistance around 62.95.
Good risk-to-reward opportunity as long as price stays above support.
📊 View: Bullish momentum expected towards 62.95 in the coming sessions
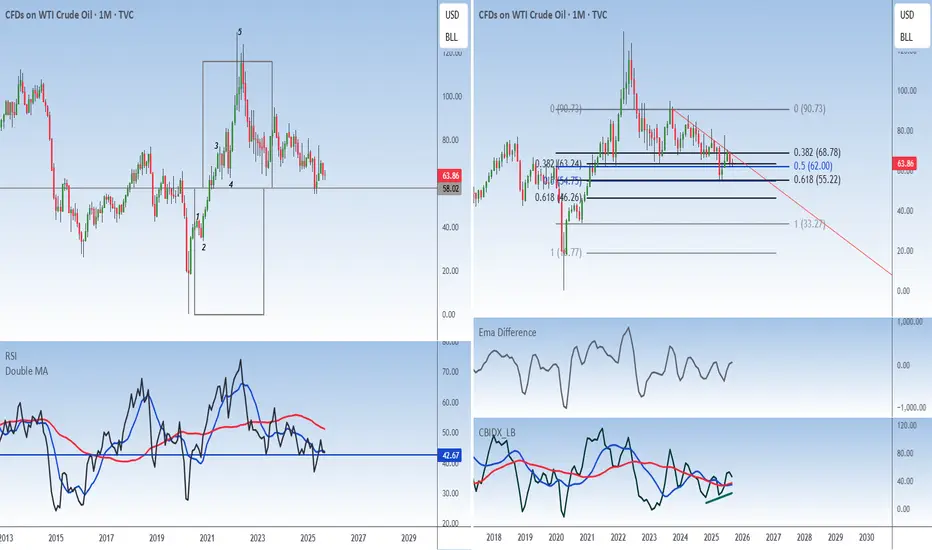
Bulls are quietly taking controlCrude Oil CMP 63.70
Elliott - crude oil has taken support at the ivth wave marked in grey at 58.
Fib - after taking support at the confluence at 55 it is now taking support above the higher confluence at 62. This is now indicating strength.
Oscillators - RSI at bull support is indicating trend is up. Divergence in composite is conforming reversal.
Conclusion - Without Elliott life is difficult.
USOIL BUYING SETUPREASON OF SELLING SETUP:-
1.taken support from previous level
2.price bending from this level
3.sellers trap

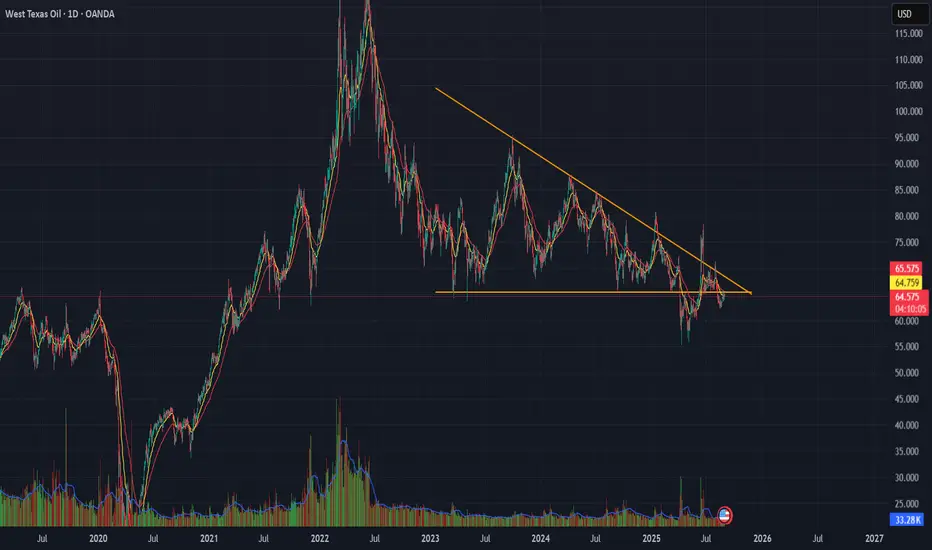
WTI Crude Oil Descending Triangle Pattern
WTI is forming a Descending Triangle pattern near recent support.
📊 Technicals : Flat base with lower highs compressing price action.
🔎 Key Levels: Breakdown below support 65 Leads To bearish continuation;
bounce above resistance 71 Leads To reversal setup.
⚠ Risk View: Energy fundamentals remain mixed — confirmation with volume is essential.
👉 Tactical takeaway: Wait for a breakout from the triangle before committing directionally.
Buy Opportunity in USOILAn upside opportunity is being developed. Scenario.
1. Choch has happened and price retracing towards FVG.
2. it is also taking support from trendlines.
3. If price rejects with volume in FVG zone, it may lead to good upside trade.
P.s. - It is just analysis not trading recommendation.

USOIL Bearish Reversal & Selling OpportunityUSOIL (WTI Crude Oil) – Bearish Setup Analysis
The chart shows a clear bearish structure with multiple confirmations:
Trendline Rejection & Break: Price rejected from the upper rejection line and later broke the rising trendline, confirming bearish momentum.
FVG (Fair Value Gap) Selling Zone: Price retested the imbalance zone (63.53–63.94), creating a strong selling opportunity.
EMA Confluence: Both the 70 EMA and 200 EMA are above the price, acting as dynamic resistance, supporting bearish bias.
Market Structure Shift (MSS): Breakdown of higher lows signals shift to bearish structure.
Target: Downside continuation expected towards 61.65, the next liquidity and support zone.
Stop Loss: Above 63.94 (selling zone invalidation).
📉 Strategy: Look for sell entries around 63.53–63.94 zone, with target at 61.65 and stop loss above 63.94.

crude oil can be soldcrude can be sold . crude is taking rejection from liquidity sweep sl above liquidity sweep . target lower liquidity level .

Buy trade in Crude .crude can be brought from the shared levels . Proper Entry sl and targets are market . this levels . Today as per liquidity sweeep levels plotted by our indicator we are expecting and uptrend in crude . These levels are as per XTI USD charts.

Crude oil view building and trading plan for next weekChart Observations
Trend Analysis:
The chart shows a series of uptrends and downtrends clearly marked with HH (Higher Highs), HL (Higher Lows), LH (Lower Highs), LL (Lower Lows).
Currently, price is in a downtrend, with a new Lower Low (LL) just printed around $64.30, breaking a strong horizontal support level.
Key Levels:
Support broken at ~$64.8 - $65, which was previously tested multiple times.
Next potential support near $63.00 - $62.50 zone (watch for wick rejections).
Resistance around $66.75 (EMA level and previous LH area).
Fibonacci Levels:
Recent retracements: 78.6%, 62%, 50% on various swings — price respecting Fibs before continuation.
262% extension on one of the previous rallies — now in retracement.
Volume:
Strong bearish volume spike on the most recent candle = institutional selling pressure.
🔮 Trading Bias
🔻 Short-term bias: Bearish
Price broke structure + volume confirms downside move. Lower highs and lower lows are forming.
📅 Trading Plan for Next Week (August 7–11)
✅ Scenario 1: Bearish Continuation (most probable)
Plan: Sell on retracement toward broken support
Entry: $65.00 – $65.40 (retest of previous support as resistance)
SL: Above $66.80 (previous LH + EMA)
TP1: $63.00 (psychological support)
TP2: $61.50 (next demand zone from historical data)
Confirmation: Rejection candle or bearish engulfing + low volume on retest preferred.
🔁 Scenario 2: Bullish Reversal (less likely)
Trigger: Price forms bullish divergence or double bottom near $63 zone with long lower wick candles
Entry: Above $65.50 with bullish engulfing and volume
SL: Below recent LL (~$62.80)
TP1: $66.75 (EMA)
TP2: $68.20 (previous minor high)
Wait for structure change — first HL and HH required to flip bias.
Avoid trading if:
Price is consolidating between $64.50 – $65.50 without clear volume or breakout.
Whipsaw/low volume candles appear around major levels.
⚙️ Additional Filters
Monitor US crude oil inventories data (EIA report – Wednesday).
Keep an eye on geopolitical news (Russia, OPEC+, etc.).
Dollar strength or weakness will also impact crude.

CRUDE OIL: SELL?SL and targets are identified in the chart.
Basically price crosses above 4 hour Bollinger band, and came inside.
Previous such cross is above current cross.
So, thinking Short

CRUDE - 2 possible trades for this week 1. After pull back to 67 zone (previous week candle body top). Price need show weakness at that previous week top.. to show it is facing resistance
2. Already price showed intent and broke previous week body low. So, if it happens to break it again, SL is current week High.
Both are short trades only.
For long trades, price must show strength by quickly crossing the last week body top. When that happens we will see..

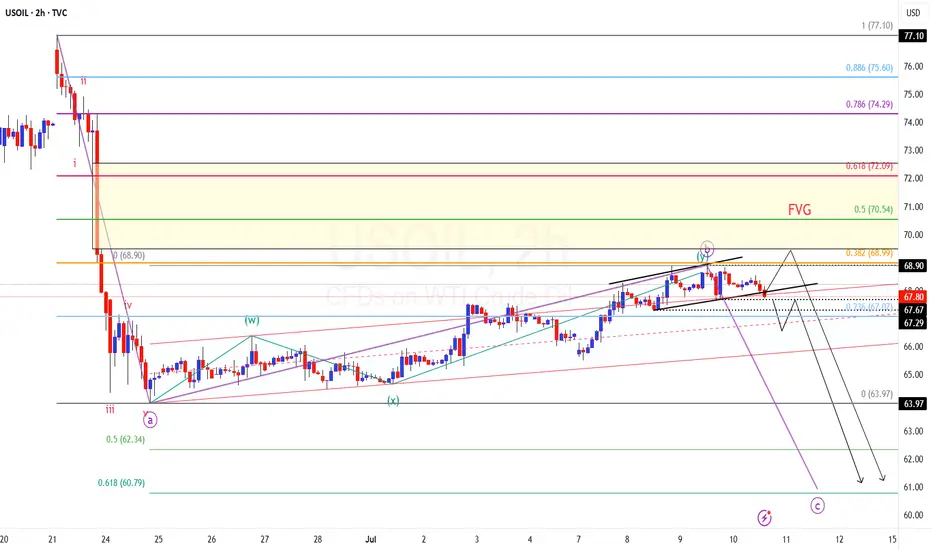
USOIL - CRUDE/CRUDOIL - Sharp Decline ahead?CMP: 67.90
TF: 120 Minutes
Price had a steep decline in an impulse nature from 77.10 to 63.97; This can be marked as corrective wave A.
Price has been moving up in zig zag price action in the B wave rise since then.
The B wave seems to have ended at 68.90 (38% retracement) OR could possibly gets terminated at around 69.5-70 (one more high)
If it has to fall right off from here at 67.90 , it needs to break 67.67 and 67.30 for final confirmation.. Else, there is a fair chance of the script making one more high at around 69.5-70 (Fair Value GAP should be tested) and resume the fall.
The FVG left at 69.5-70 is the reason for me to expect one more high.
The idea is marked in this chart along with the internal counts.
Disclaimer: I am not a SEBI registered Analyst and this is not a trading advise. Views are personal and for educational purpose only. Please consult your Financial Advisor for any investment decisions. Please consider my views only to get a different perspective (FOR or AGAINST your views). Please don't trade FNO based on my views. If you like my analysis and learnt something from it, please give a BOOST. Feel free to express your thoughts and questions in the comments section.
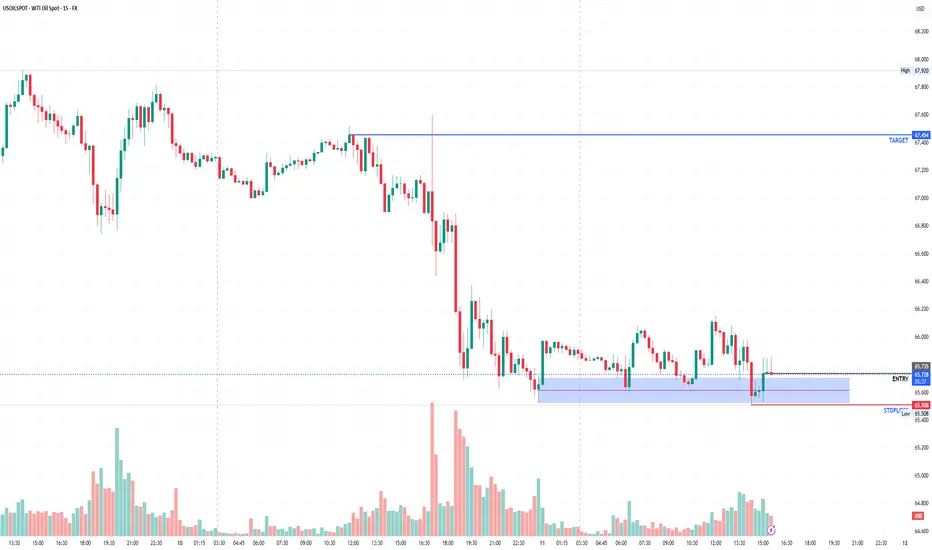
USOIL is taking support at lower levels and making higher highsThe trading signal for USOIL has been triggered. The asset has demonstrated consistent support near the 65.5 price level, exhibiting this pattern of support three times previously, each instance resulting in the formation of a higher high. Currently, USOIL is once again showing support at this crucial level. Therefore, I recommend initiating a bullish or long trade position, with a suggested entry point around the 65.75 mark.
Crude WTI updated levels buy near support sell near resistance How My Harmonic pattern projection Indicator work is explained below :
Recent High or Low :
D-0% is our recent low or high
Profit booking zone: D13% -D15% is
range if break them profit booking start on uptrend or downtrend but only profit booking, trend not changed
SL reversal zone : SL 23% and SL 25% is reversal zone if break then trend reverse and we can take reverse trade
Target : T1, T2, T3, T4 and .
Are our Target zone

