Usoil trade setup Very bullishUSOIL harmonic chart pattern
Head & Shoulder Pattern for few days.
Levels marked on the chart.
#bullish
#harmonic
#USOIL
USOILSPOT trade ideas

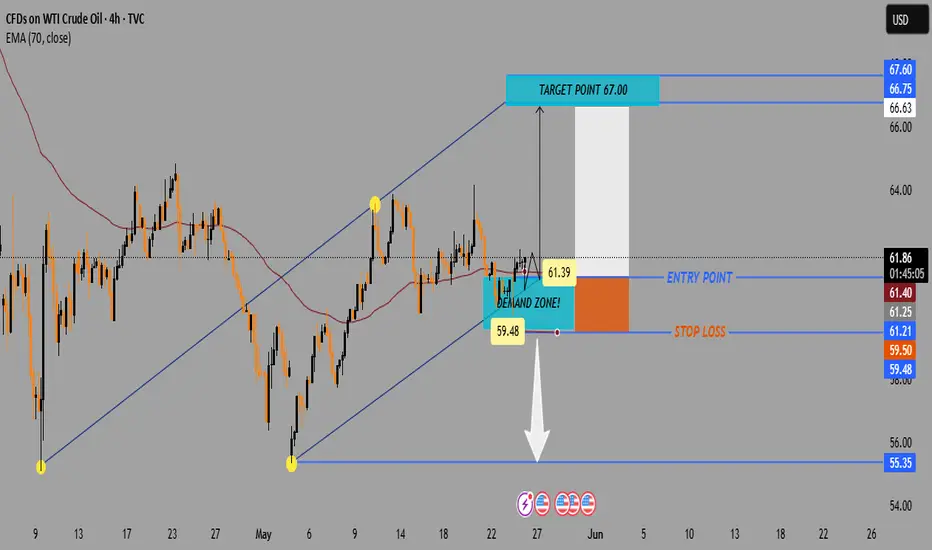
WTI Crude Oil 4H Chart – Bullish Setup from Demand Zone📈 Current Price: $61.74
🔵 Key Zones & Levels
🔹 Demand Zone (Buy Area):
🟦 $59.48 – $61.39
→ Price expected to bounce here
→ 🔄 Potential reversal zone
🔹 Entry Point:
🎯 $61.39
→ Ideal level to enter LONG
→ Just above demand zone
🔹 Stop Loss:
🛑 Below $59.48
→ Exit if price drops here
→ Protects capital
🔹 Target Point:
🚀 $67.00
→ Profit-taking zone
→ Strong resistance zone nearby:
* 66.63
* 66.75
* 67.60
📊 Indicators
📍 EMA (70): 🔴 61.40
→ Price trading above = bullish signal
→ EMA acting as support
📏 Trendline Channel:
🔼 Higher highs & higher lows
→ Supports uptrend continuation
📌 Trade Plan Summary
* Bias: 📈 Bullish
* Buy: At 61.39
* Stop: Below 59.48 🛑
* Target: 67.00 🎯
* Risk-Reward: ✔️ Favorable (~1:3)
🔍 What to Watch
* ✅ Bullish candles in demand zone
* 🔁 Retest of EMA or lower channel
* ❌ Avoid if it breaks below $59.48
Crude oil at bulish trendCrude oil nearby consolidation zone above the box crude oil is going to bullish.

Crude updated levels,fall from exactly resistance area How to take trades using Harmonic pattern projection Trade setup is explained below :-
Entry : 1st SL point : 0% is recent top or bottom.
Trailing D: 15.1% is work as trailing SL of buy or sell trade if hit then we have to book profit
.If price goes below 2nd D 22.5% to 24.5% range then early traders can make fresh reversals trade after breaking 1st D 15.1% safe traders can reversal trade after breaking Point D 22.5.4% to 24.5% range
Targets :
Target T1 : 36.1% to 38.3%
Target T3 : 49.1% to 52.5%
T3: 60.9% to 64.8% is our 3rd Target since this is reversal zone so must book profit if break then take fresh trade again
Target T4 : 76.4% to 79.7%
Next Targets are 100% , 127.2% ,141.4% and final Target 161.8%.
How to take reversal trade :
If price going upside/ downside then then buy or sell levels appear on Chart ( Automatically show when price reach any reversal zone of harmonic projection ).
Trailing SL:
After reach 1st Target trail SL to just above or below cost ( for example we are holding sell trade from 100 1st Target 110 hit then move trailing sl to 104-105 and move SL as price move upside or Downside)
Re- Entry :
For Re-entry in any pull back Point D ( 15.1% ) is used for re-entry then SL recent high or low Point SL ( 0% ) .
Blue Line is 1st support/ Resistance
Green line is 2nd support/ resistance
Red line is 3rd Support/ resistance

Crude oil update-4th June.Crude oil update
It has form a WXY as an irregular correction and now forming an Next impulse to the upside
which is forming from 59.80 lows to the upside 63.75 which looks like 5 wave and wave W corrected in 3 wave
and X wave have 3 wave pattern, which opens of other probabilities for larger correction.
Things to note that price gapped up after wave 1 and we dont have a Correct wave 2 correction, Wave Y correction expected towards downside as ABC 3 have simple zigzag pattern.
so if price breaks belows marked wave A, because it is a Irregular correction so it may break low of A or not it is not mandatory.
So we should look to buy around Fib support of 50-61.8% area with confirmation for next long.
Lets see how it plays out.

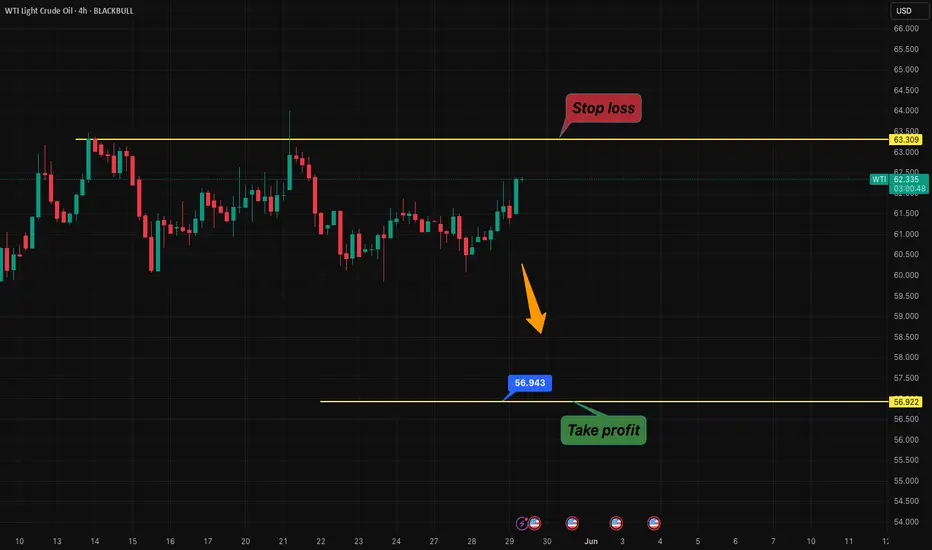
SELL WTI NOWThe price has been consistently forming strong, decisive green candles. Consider opening a sell position for this week
The support zone is quite weak and hard to identify
Stoploss and Take profit in this pictures
Good luck all
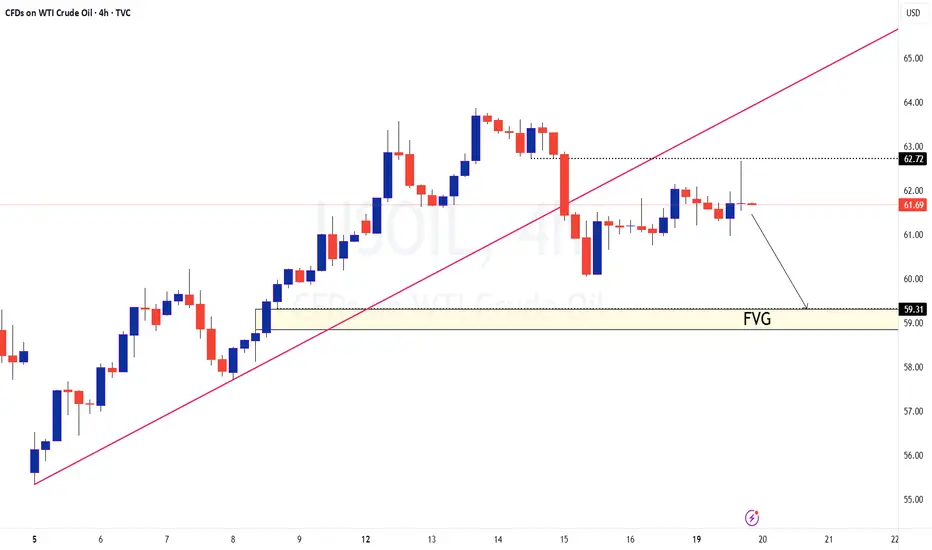
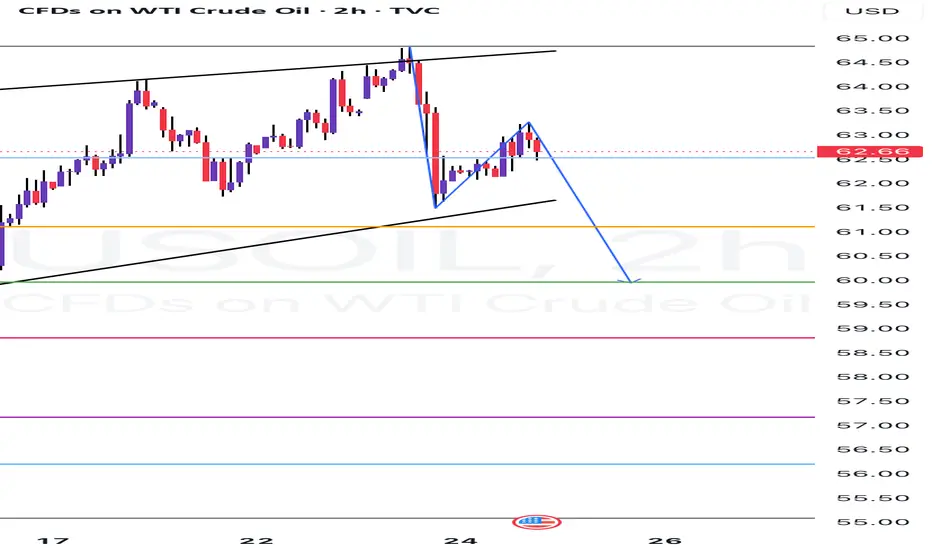
USOIL - to test $59.5 or lower?
TF: 240 minutes
The script has left a FVG (Fair Value GAP) at $59.3 and it is most likely to be tested first before making any move on the upside.
The supply between 62.7 and 63 is quite strong for now.
Trade with caution
Disclaimer: I am not a SEBI registered Analyst and this is not a trading advise. Views are personal and for educational purpose only. Please consult your Financial Advisor for any investment decisions. Please consider my views only to get a different perspective (FOR or AGAINST your views). Please don't trade FNO based on my views. If you like my analysis and learnt something from it, please give a BOOST. Feel free to express your thoughts and questions in the comments section.
WTI Crude Oil Bullish Breakout Setup – Targeting $65.80Chart Breakdown:
1. Trend Structure
📈 Uptrend Channel
Price is respecting a rising trendline.
Multiple touches (🟡 dots) confirm the trend is valid.
Higher highs and higher lows indicate bullish pressure.
2. Key Zones
🟦 Demand Zone: $62.19 – $62.36
Strong support area!
EMA 70 (📉 line) sits right in this zone – great confluence!
Likely bounce area.
🟥 Resistance Zone: (Broken!)
Price broke above the resistance – bullish signal!
Now acting as support (role reversal).
🎯 Target Point: $65.80
Located near key resistance area.
🎯 Take profit zone!
Trade Setup
🔹 Entry Point: $62.45
🔸 Stop Loss: $61.43 (below demand & EMA)
🎯 Target: $65.80
✅ Risk/Reward: ~3.3:1
Great reward potential compared to risk!
Indicators
📏 EMA 70: $62.19
Below price → supports bullish move.
Visual Summary:
🔵 Demand Zone
🔺 Entry Point
🟥 Stop Loss
🎯 Target Zone
🟡 Confirmed Trend Points
📈 Breakout Above Resistance

XTIUSD / CRUDE OIL / CL Analysis 21-May-2025: Bull or Bear?LTP 62.70
Supports: 55/54.55
Resistances: 64.89/71.21/79.55/83.93
As long as 64.89/71.21 resists, we can see more downside.
Targets on the downside: 55.77, 51.93, 48.64, 45.77, 41.21
On the upside, important resistances 79.55/83.93.
Break of these two levels, we can see big bull run towards 121/233 in the long run.
As of now, I expect down move towards 52-45 before big reversal.

Major trend view for USOILAre we looking at a similar but mirrored bar pattern from 2008 to 2014?
Similarities:-
1. Impulse and steep wave.
2. Consolidation in the format of a triangle.
On the breakout, we had another fall equivalent to 61.8% of the impulse wave. If we are witnessing the same pattern, then on the breakout of this triangle consolidation, we will have the USOIL prices at $135 in the coming years. It shall be by the end of 2028!
PS: This chart is just for analysis purposes. When we know the major trend, we can position our trades carefully.

Crude weekly levels buy on dip @support book profit resistance How to take trades using Harmonic pattern projection Trade setup is explained below :-
Entry : 1st SL point : 0% is recent top or bottom.
Trailing D: 15.1% is work as trailing SL of buy or sell trade if hit then we have to book profit
.If price goes below 2nd D 22.5% to 24.5% range then early traders can make fresh reversals trade after breaking 1st D 15.1% safe traders can reversal trade after breaking Point D 22.5.4% to 24.5% range
Targets :
Target T1 : 36.1% to 38.3%
Target T3 : 49.1% to 52.5%
T3: 60.9% to 64.8% is our 3rd Target since this is reversal zone so must book profit if break then take fresh trade again
Target T4 : 76.4% to 79.7%
Next Targets are 100% , 127.2% ,141.4% and final Target 161.8%.
How to take reversal trade :
If price going upside/ downside then then buy or sell levels appear on Chart ( Automatically show when price reach any reversal zone of harmonic projection ).
Trailing SL:
After reach 1st Target trail SL to just above or below cost ( for example we are holding sell trade from 100 1st Target 110 hit then move trailing sl to 104-105 and move SL as price move upside or Downside)
Re- Entry :
For Re-entry in any pull back Point D ( 15.1% ) is used for re-entry then SL recent high or low Point SL ( 0% ) .
Blue Line is 1st support/ Resistance
Green line is 2nd support/ resistance
Red line is 3rd Support/ resistance

Crude profit booking on Buy trade given at 64$ sell below 61.90$How to take trades using Harmonic pattern projection Trade setup is explained below :-
Entry : 1st SL point : 0% is recent top or bottom.
Trailing D: 15.1% is work as trailing SL of buy or sell trade if hit then we have to book profit
.If price goes below 2nd D 22.5% to 24.5% range then early traders can make fresh reversals trade after breaking 1st D 15.1% safe traders can reversal trade after breaking Point D 22.5.4% to 24.5% range
Targets :
Target T1 : 36.1% to 38.3%
Target T3 : 49.1% to 52.5%
T3: 60.9% to 64.8% is our 3rd Target since this is reversal zone so must book profit if break then take fresh trade again
Target T4 : 76.4% to 79.7%
Next Targets are 100% , 127.2% ,141.4% and final Target 161.8%.
How to take reversal trade :
If price going upside/ downside then then buy or sell levels appear on Chart ( Automatically show when price reach any reversal zone of harmonic projection ).
Trailing SL:
After reach 1st Target trail SL to just above or below cost ( for example we are holding sell trade from 100 1st Target 110 hit then move trailing sl to 104-105 and move SL as price move upside or Downside)
Re- Entry :
For Re-entry in any pull back Point D ( 15.1% ) is used for re-entry then SL recent high or low Point SL ( 0% ) .
Blue Line is 1st support/ Resistance
Green line is 2nd support/ resistance
Red line is 3rd Support/ resistance

WTI Crude Oil (USOIL) Bullish Pullback Setup – Targeting $66.70Entry Point: Around $62.30 - $62.26
Stop Loss: Set below the entry zone at $61.65, with a potential lower buffer at $60.90
Target Zone (EA TARGET POINT): Between $66.62 and $67.00
A projected gain of 4.22 points (~6.77%)
📈 Price Action & Indicators:
The price had a strong bullish run recently and is now consolidating or pulling back slightly.
The red and blue moving averages (likely short-term and medium-term MAs) show a bullish crossover and trend.
There's a potential bullish setup if the price pulls back to the entry zone and finds support.
The blue curved arrow indicates a projected bounce from the $62.30 support region back up toward the $66.70 target.
🛠️ Strategy Implied:
Wait for pullback to the entry zone (~$62.30).
Enter long at or around that level.
Set Stop Loss at $61.65 to limit downside risk.
Take Profit at $66.70 for a solid risk-reward ratio.
⚠️ Risks:
If support at $62.30 fails, price may head toward $61.65 or lower.
Market volatility (especially with crude oil) can invalidate setups quickly.
Economic events (e.g., U.S. inventory reports, OPEC news) can disrupt technical patterns.

Crude oil updateCrude oil update-price is in correction. making ABC in higher TF. internal also- ABC completed in wave B and next leg is bound to break the high of A .

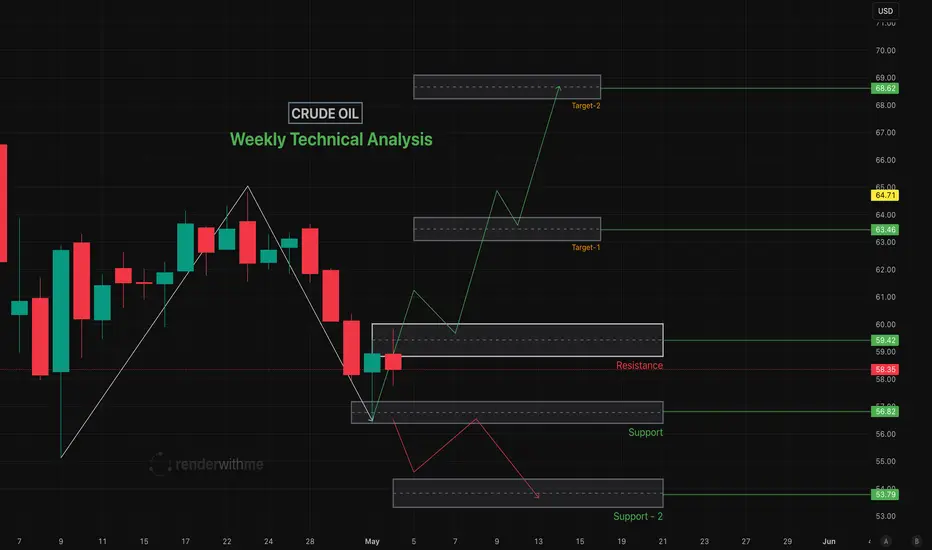
Crude Oil Technical Analysis for the Week of May 11–May 15, 2025nothing much to say Chart speaks itself
Chart for your reference
Crude wTI levels 2nd support or resistance important in pullbackHow to take trades using Harmonic pattern projection Trade setup is explained below :-
Entry : 1st SL point : 0% is recent top or bottom.
Trailing D: 15.1% is work as trailing SL of buy or sell trade if hit then we have to book profit
.If price goes below 2nd D 22.5% to 24.5% range then early traders can make fresh reversals trade after breaking 1st D 15.1% safe traders can reversal trade after breaking Point D 22.5.4% to 24.5% range
Targets :
Target T1 : 36.1% to 38.3%
Target T3 : 49.1% to 52.5%
T3: 60.9% to 64.8% is our 3rd Target since this is reversal zone so must book profit if break then take fresh trade again
Target T4 : 76.4% to 79.7%
Next Targets are 100% , 127.2% ,141.4% and final Target 161.8%.
How to take reversal trade :
If price going upside/ downside then then buy or sell levels appear on Chart ( Automatically show when price reach any reversal zone of harmonic projection ).
Trailing SL:
After reach 1st Target trail SL to just above or below cost ( for example we are holding sell trade from 100 1st Target 110 hit then move trailing sl to 104-105 and move SL as price move upside or Downside)
Re- Entry :
For Re-entry in any pull back Point D ( 15.1% ) is used for re-entry then SL recent high or low Point SL ( 0% ) .
Blue Line is 1st support/ Resistance
Green line is 2nd support/ resistance
Red line is 3rd Support/ resistance

USOIL at support range $56.56 to $56USOIL is at a major support level at $56.56 to $56, and the price is breaking this level. It will target downside levels of 50.53, 41.15, 31.90, and 36.08, respectively.
Price bouncing from this point will retest $62.99 and $73.88 as respective targets.
Prices may fall mostly for downside targets here.

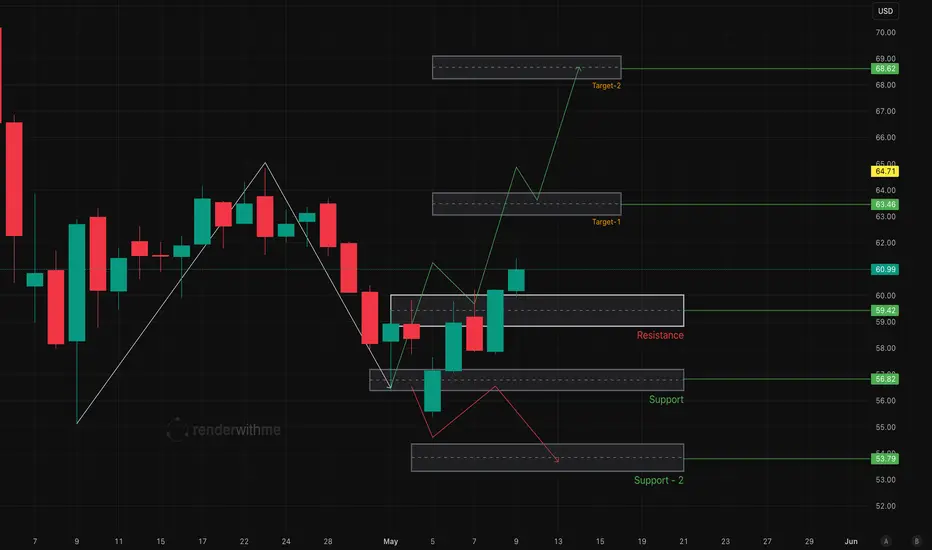
Crude Oil Technical Analysis for the Week of May 5–May 9, 2025Forecast for Next Week
Bearish Scenario (Higher Probability):
Trigger: Failure to reclaim $61.60 or a break below $56.
Targets: $55.05 (April 9 low), $52.53, or $49-$43 if the 4-year support at $64 breaks.
Rationale: Bearish MACD cross, descending channel, and OPEC+ production increase fears.
Bullish Scenario (Lower Probability):
Trigger: A hold above $57.08-$56.53 with a bullish reversal pattern (e.g., Bullish Engulfing) or OPEC+ signalling tighter supply.
Targets: $63.90, $65.81 or $68 (14-day forecast).
Rationale: Oversold RSI and potential demand zone support.
Range-Bound Scenario: If prices stay between $57.00-$60.60, expect choppy trading as the market awaits clarity from OPEC+ and economic data.
CRUDE Hello & welcome to this analysis
WTI OIL is at the PRZ of a bullish Harmonic Cypher pattern suggesting a bounce/reversal from current levels.
Crude (MCX) however does not have any bullish harmonic patterns at the moment, normally, we do see them in sync, however, this time maybe due to a strong INR the pattern is not seen.
One can take a trade tracking USOIL / WTI either above $57.85 (60m close) with swing low as stop loss or take a bullish trade here with $55.95 as stop loss.
The targets are 38-50-62 Fibonacci levels as marked in the chart
All the best

USOIL - One final push down to 60-58?Not the best time to go long on this counter yet.. expecting one push towards 60-58 levels.. if it breaks below the recent swing low, then it could head towards sub 50 levels too.. but for now, 60 looks imminent
WTI crude oil bullish Weekly gap on buy side,
Liq stacking on buy side,
Buy limit entry after a 71% retrace at 4hr ob opening.
Reaccumulation
Good RR can risk 1%

Crude WTI sell given below 63.60 $ , 62.44 $ Target hitHow to take trades using Harmonic pattern projection Trade setup is explained below :-
Entry : 1st SL point : 0% is recent top or bottom.
Trailing D: 11.4% is work as trailing SL of buy or sell trade if hit then we have to book profit
.If price goes below 2nd D 21.4% to 23.6% range then early traders can make fresh reversals trade after breaking 1st D 11.4% safe traders can reversal trade after breaking Point D 21.4% to 23.6% range
Targets :
Target T1 : 35.1% to 38.3%
Target T3 : 49.1% to 53.2%
T3: 60.9% to 64.8% is our 3rd Target since this is reversal zone so must book profit if break then take fresh trade again
Target T4 : 76.4% to 79.7%
Next Targets are 100% , 127.2% ,141.4% and final Target 161.8%.
How to take reversal trade :
If price going upside/ downside then then buy or sell levels appear on Chart ( Automatically show when price reach any reversal zone of harmonic projection pattern based .
After showing reversal levels wait for confirmation until 21.4% or 28.3 % level not break if break then exit from current buy / sell trade and take fresh reverse trade buy/ sell .
Trailing SL:
After reach 1st Target trail SL to just above or below cost ( for example we are holding sell trade from 100 1st Target 110 hit then move trailing sl to 104-105 and move SL as price move upside or Downside)
Re- Entry :
For Re-entry in any pull back Point D ( 11.4% ) is used for re-entry then SL recent high or low Point SL ( 0% ) .
Blue Line is 1st support/ Resistance
Green line is 2nd support/ resistance
Red line is 3rd Support/ resistance

long in Crude oil .crude oil has reached the demand zone . so buying crude oil from demand . sl below the demand zone and targetting supply zone . Crude taking rejection from demand zone on smaller time frame .
