CRUDE Hello & welcome to this analysis
WTI OIL is at the PRZ of a bullish Harmonic Cypher pattern suggesting a bounce/reversal from current levels.
Crude (MCX) however does not have any bullish harmonic patterns at the moment, normally, we do see them in sync, however, this time maybe due to a strong INR the pattern is not seen.
One can take a trade tracking USOIL / WTI either above $57.85 (60m close) with swing low as stop loss or take a bullish trade here with $55.95 as stop loss.
The targets are 38-50-62 Fibonacci levels as marked in the chart
All the best
Trade ideas

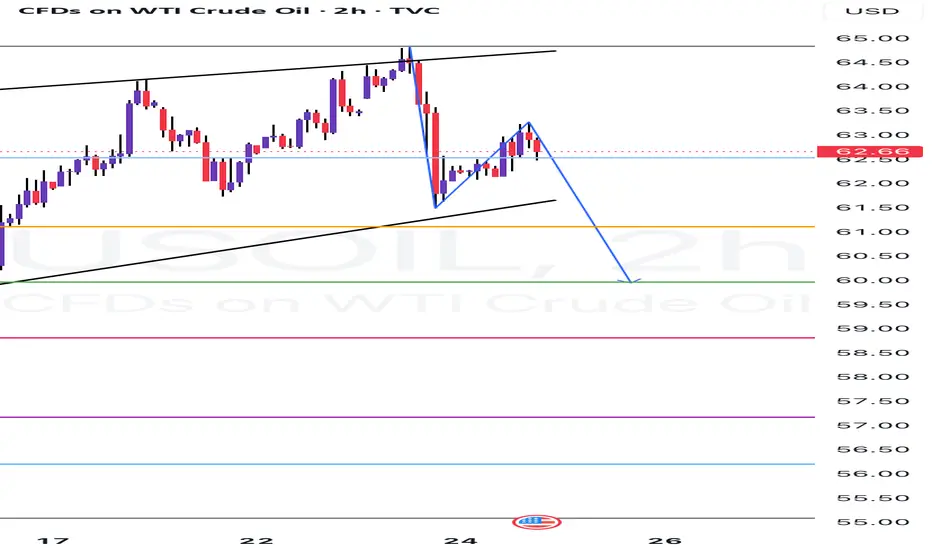
USOIL - One final push down to 60-58?Not the best time to go long on this counter yet.. expecting one push towards 60-58 levels.. if it breaks below the recent swing low, then it could head towards sub 50 levels too.. but for now, 60 looks imminent
WTI crude oil bullish Weekly gap on buy side,
Liq stacking on buy side,
Buy limit entry after a 71% retrace at 4hr ob opening.
Reaccumulation
Good RR can risk 1%

Crude WTI sell given below 63.60 $ , 62.44 $ Target hitHow to take trades using Harmonic pattern projection Trade setup is explained below :-
Entry : 1st SL point : 0% is recent top or bottom.
Trailing D: 11.4% is work as trailing SL of buy or sell trade if hit then we have to book profit
.If price goes below 2nd D 21.4% to 23.6% range then early traders can make fresh reversals trade after breaking 1st D 11.4% safe traders can reversal trade after breaking Point D 21.4% to 23.6% range
Targets :
Target T1 : 35.1% to 38.3%
Target T3 : 49.1% to 53.2%
T3: 60.9% to 64.8% is our 3rd Target since this is reversal zone so must book profit if break then take fresh trade again
Target T4 : 76.4% to 79.7%
Next Targets are 100% , 127.2% ,141.4% and final Target 161.8%.
How to take reversal trade :
If price going upside/ downside then then buy or sell levels appear on Chart ( Automatically show when price reach any reversal zone of harmonic projection pattern based .
After showing reversal levels wait for confirmation until 21.4% or 28.3 % level not break if break then exit from current buy / sell trade and take fresh reverse trade buy/ sell .
Trailing SL:
After reach 1st Target trail SL to just above or below cost ( for example we are holding sell trade from 100 1st Target 110 hit then move trailing sl to 104-105 and move SL as price move upside or Downside)
Re- Entry :
For Re-entry in any pull back Point D ( 11.4% ) is used for re-entry then SL recent high or low Point SL ( 0% ) .
Blue Line is 1st support/ Resistance
Green line is 2nd support/ resistance
Red line is 3rd Support/ resistance

long in Crude oil .crude oil has reached the demand zone . so buying crude oil from demand . sl below the demand zone and targetting supply zone . Crude taking rejection from demand zone on smaller time frame .

Crude WTI if break 63.60 $ then sell avoid buy trade aHow to take trades using Harmonic pattern projection Trade setup is explained below :-
Entry : 1st SL point : 0% is recent top or bottom.
Trailing D: 11.4% is work as trailing SL of buy or sell trade if hit then we have to book profit
.If price goes below 2nd D 21.4% to 23.6% range then early traders can make fresh reversals trade after breaking 1st D 11.4% safe traders can reversal trade after breaking Point D 21.4% to 23.6% range
Targets :
Target T1 : 35.1% to 38.3%
Target T3 : 49.1% to 53.2%
T3: 60.9% to 64.8% is our 3rd Target since this is reversal zone so must book profit if break then take fresh trade again
Target T4 : 76.4% to 79.7%
Next Targets are 100% , 127.2% ,141.4% and final Target 161.8%.
How to take reversal trade :
If price going upside/ downside then then buy or sell levels appear on Chart ( Automatically show when price reach any reversal zone of harmonic projection pattern based .
After showing reversal levels wait for confirmation until 21.4% or 28.3 % level not break if break then exit from current buy / sell trade and take fresh reverse trade buy/ sell .
Trailing SL:
After reach 1st Target trail SL to just above or below cost ( for example we are holding sell trade from 100 1st Target 110 hit then move trailing sl to 104-105 and move SL as price move upside or Downside)
Re- Entry :
For Re-entry in any pull back Point D ( 11.4% ) is used for re-entry then SL recent high or low Point SL ( 0% ) .
Blue Line is 1st support/ Resistance
Green line is 2nd support/ resistance
Red line is 3rd Support/ resistance we

WTI Crude Oil TradeSetup:Demand Zone Reversal & Trendline Brkout📉 Trendline Resistance
🔴🔴🔴 (Multiple rejection points along the descending trendline)
📊 Demand Zone (Support Area)
🟦 Blue Zone (59.08 - 57.90) → Potential Reversal Area
✅ Entry Point: 59.08
🟡 (Marked in yellow) – Ideal buy zone
🎯 Target Point: 63.90
🔵 (Top Resistance Level) – Profit-taking zone
⛔ Stop Loss: 57.90
🟥 (Risk Management Zone) – To prevent big losses
📈 Possible Scenario:
1️⃣ Price drops into 🟦 demand zone
2️⃣ Bounces ⬆️ off support (bullish move 🚀)
3️⃣ Hits 🎯 target (63.90) ✅
⚠️ Alternative Scenario:
If price 📉 breaks below 🟥 stop loss, downtrend may continue.
This trade setup looks good with a 4:1 risk-reward ratio! 🏆

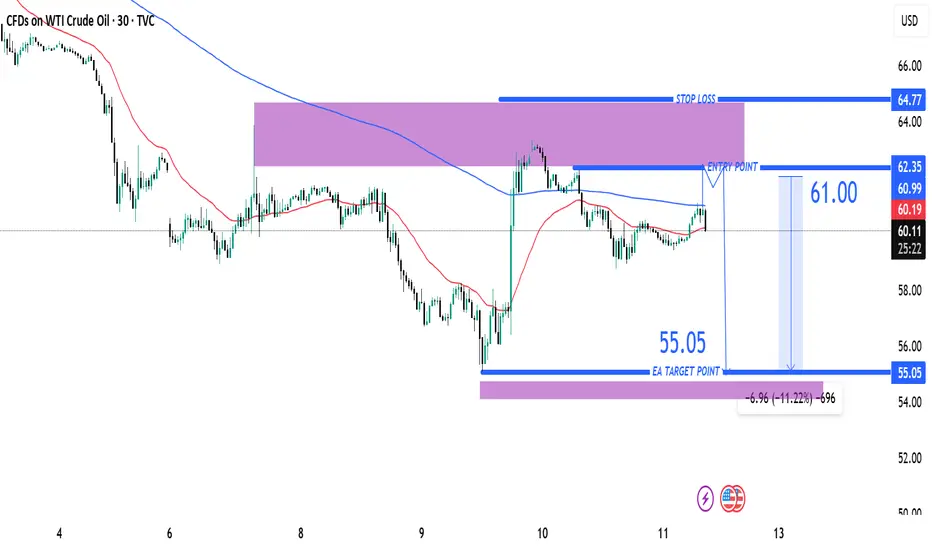
USOIL Short Trade Idea – Targeting $55.05 from $61.00Entry Point: ~61.00 USD
Stop Loss (SL): 64.77 USD
Target (TP): 55.05 USD
Risk/Reward Ratio: Favorable
Risk: ~3.77 USD
Reward: ~5.95 USD
Approximate R/R ratio: 1:1.58
🧠 Strategy Insight
Trend Context:
Prior to the entry zone, price shows a strong downtrend.
The price retraced upward into a resistance zone (highlighted in purple).
The setup suggests a short position anticipating rejection from this zone.
Indicators:
Moving Averages (red & blue):
Likely 50 EMA and 200 EMA showing bearish alignment (price mostly under both).
Resistance Zone:
The purple shaded region represents a supply zone, where price previously reversed.
Entry Zone Analysis:
Entry just below a recent rejection candle.
It's a conservative spot to catch a move back in the direction of the dominant trend.
Target Zone (55.05):
Likely based on a recent support level or demand zone from earlier price action.
Matches previous lows.
🔁 Possible Scenarios
✅ Bearish Scenario (Ideal Outcome):
Price gets rejected from the resistance zone and continues the downtrend toward the target at 55.05.
❌ Bullish Scenario (Risk):
Price breaks above 61.00 and continues toward 64.77, invalidating the short setup.
"WTI Crude Oil – Bullish Bounce from Demand Zone? "🔵 . Demand Zone:
⬇️ 60.53 – 59.71
This is the buy zone where bulls are likely to step in!
Price is currently testing this area. Watch closely!
🛑 . Stop Loss (Risk Zone):
📉 Below 59.66
If price falls below here, exit the trade – demand has failed.
🎯 . Target Point:
🚀 63.85
This is the take profit zone. A successful bounce could reach this level!
🟠 . EMA (9-period DEMA):
📉 Currently around 60.86
Price is slightly below EMA, showing short-term bearish pressure.
🟢 . Trade Idea Summary:
• Enter near the blue demand zone
• SL below 🔴 59.66
• TP at 🎯 63.85
• R:R ratio looks favorable (low risk, high reward)
Outlook:
As long as price holds above the demand zone, this setup remains bullish 📈
Let’s see if the bulls can push it to that 63.85 target! 🚀💰

Crudeoil Pump Coming!Crude oil, 5 wave up and ABC correction is over, a upside to 90$ in short term can be expected.

us oil buy 1:4must buy us oil bro it boom
As crude oil has taken rejection from Demand Zone . Buying crude oil for a target of Supply zone . Sl below demand Zone . Zone to Zone trading .

Buy Crude OilAs crude oil has taken rejection from Demand Zone . Buying crude oil for a target of Supply zone . Sl below demand Zone . Zone to Zone trading .

Crude oil sold from Supply rejection Crude oil sold from supply rejection 110 points captured till demand Zone .
Crude brought from Demand Zone trade active on buy side 80 points done
Both sl were of 25 points .

WTI CRUDE OIL TRADE SETUP : BREAKOUT OR BREAKDOWN ?📊 Key Observations:
🔹 Trend:
🚀 Strong bullish move followed by a correction 📉
🔻 Price is testing a support zone
🔹 Pattern Formation:
📏 Descending channel or flag-like structure
📍 Price is near a breakout point
🔹 Trade Setup:
✅ Entry Zone: Around 70.77
🛑 Stop Loss: 70.44 - 70.49 (Risk limit ❌)
🎯 Target Point: 71.80 (Profit zone ✅)
🔹 Indicators & Confirmation:
📊 DEMA (9) at 70.92 → Price is slightly below short-term momentum
🔥 A breakout above resistance could confirm a bullish move 🚀
📌 Conclusion:
✅ If price breaks the trendline upwards → Buy 📈 aiming for 71.80 🎯
❌ If support at 70.44-70.49 fails → More downside possible ⚠️
🚀 Watch for volume & candlestick confirmation before entering!

Bearish crude is bad news!!WTI Crude CMP 71.15
Elliott- the B wave of the three wave correction is a descending triangle. And in my view it is complete. The C wave will be deep.
Fibs- the only time the fibs dont work is when there is a triangle in the correction. The start of the fib in a triangle is different.
RSI - the oscillator is in the bear zone and is under the averages. this is called failing below the averages. This is very negative.
Conclusion - I know the thrust out of a triangle is very forceful. My fist tgt will be a at $47.80 . Mind u this is not where this correction ends, it will go deeper.

USOIL / WTIOIL / CRUDE OIL Analysis 1-Apr-2025LTP 71.93
Bull trend started?
Support: 65.30
Resistance: 80.73
As per this chart, Crude bottom might be truncated. So, I expect a trend reversal for more bullish action for the targets above 120 USD.
Long term target for this bull move can be 190$+
Upside small targets: 77, 82, 85, 93, 112, 121+
NOTE: Bull View will be invalidated below 65.30.
Below that, we can see 60.5, 57, 55, 54, 49.
PRIMARY: BULL.
ALT: BEAR.

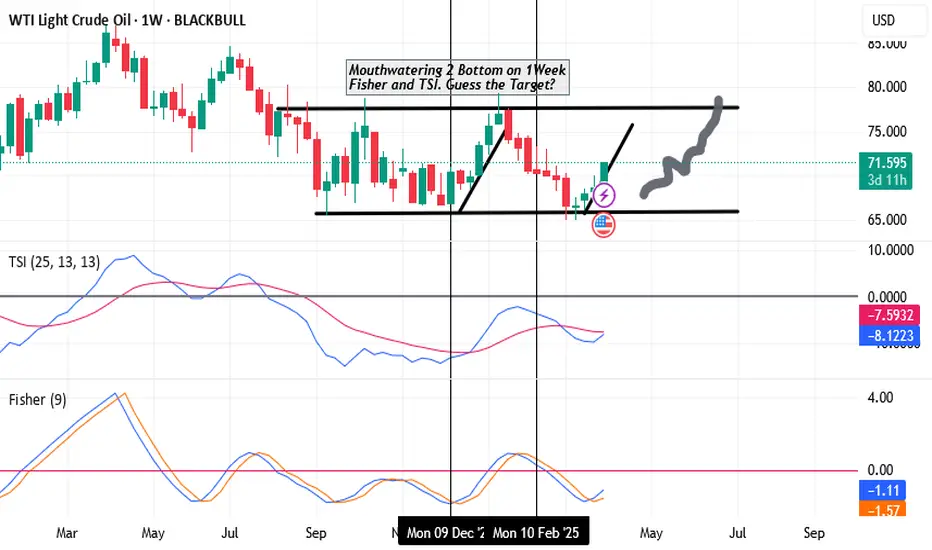
Crude Oil Bullish on 1Week timeframe (2Bottom)It is Mouthwatering 2 Bottom on 1Week Fisher and TSI.
Here, 1Month zigzag pattern at the Bottom makes it indecisive of a Direction, but extreme Bottom in 1Week makes a good point for BUY.
Guess the Target?
Well, it shall be a 1Day Top in Fisher and TSI. News shall be anything. But whatever news, it will turn out to be smartly marching ahead with confidence.
BTW, 1M Fisher has turn positive at Bottom zigzag pattern to catapult 4H 1D higher
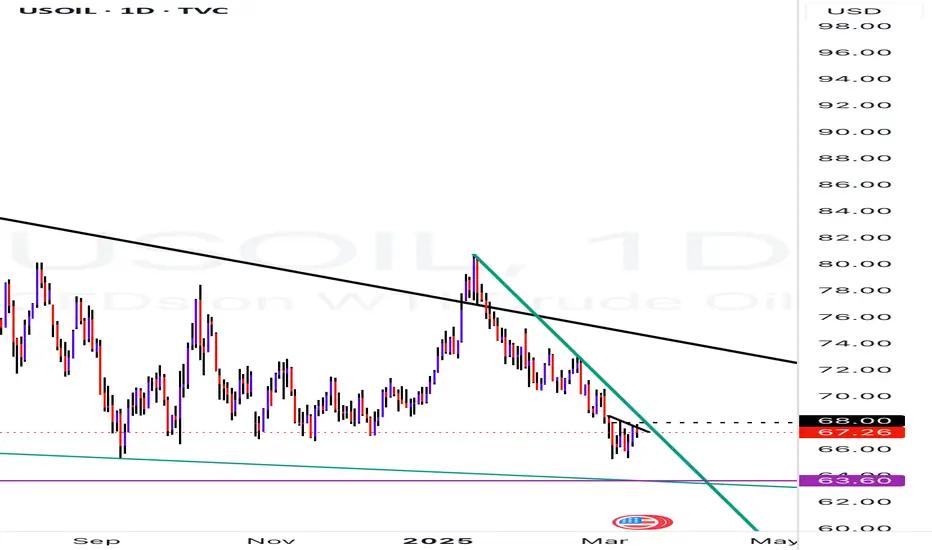
XTIUSD (US WTI Crude (Spot)) @ 68.28 Analysis on 21-Mar-2025
Crude is trading at an important level 68-68.60
As long as this level resists, we can see 66.73/64.95 again.
Further, downside can be 63.59, 60/55

US OIL ALERTSo, I've been checking out the oil market, and it seems like US oil seems to have good support right now, with solid support below $66 and resistance around $75. It could be a good time to buy if you trade with a minimal stop loss. Check out the chart and see if it fits your risk appetite!
Crude oil update
Oil has bounced from 65 level and provided a clear ABC pattern to upside and also provided clear
ABC pattern to the downside.
As per this there are 2 possiblities.
1- Either this pattern in WXY, in which WX is completed and we are due for Y move, which has to
complete above 68.19
2- 2nd ABC can be part of ED,and wave 1 of ED is complete and 2 is ongoing.
Lets see how it playout.

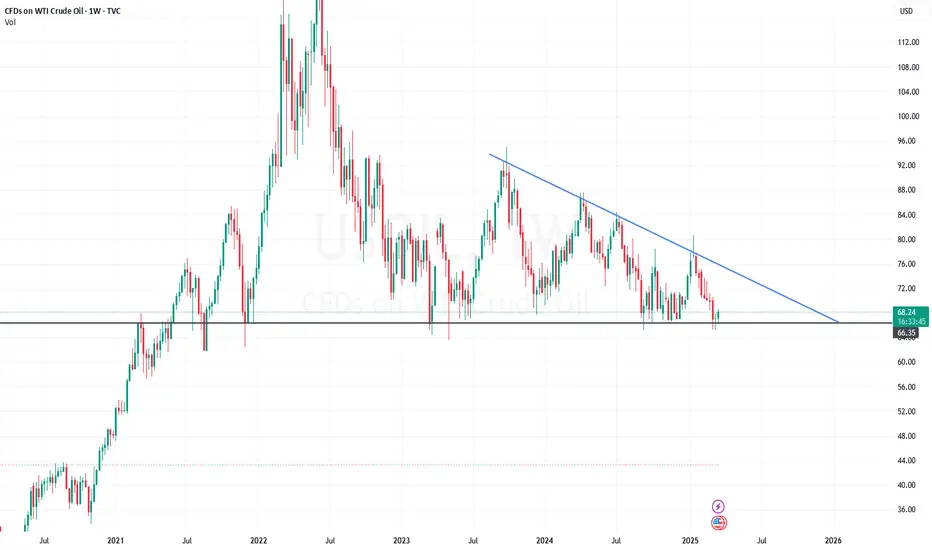
USOIL / CRUDEOIL - One last push down towards 63.5?The wedge will look complete with the final touchdown to the green trendline connecting the lows..
Getting rejected at the $68 mark, happens to be strong resistance (trendline and supply zone).
Let’s see how the price unfolds in the coming sessions
USOIL - TRADING NEAR IMPORTANT DEMAND ZONE - TREND REVERSAL?Symbol - USOIL
CMP - 66.58
The USOIL has recently experienced a decent correction over the past few weeks, which has provided an opportunity for price consolidation near an important support zone before the potential upward price growth. This correction has allowed the market to stabilize, and the recent price action suggests that the price may show a reversal from the major support zone which has held since March 2023
Geopolitical tensions and OPEC production cuts continue to play a significant role in influencing oil prices, while global economic recovery, particularly in major consuming nations, provides further optimism for sustained demand. These factors are likely to continue supporting oil prices as market participants remain cautious about future supply disruptions. With the recent correction now completed, USOIL appears poised for further upward momentum, especially if these bullish fundamentals continue to hold.
Technically, the key support level to watch is $66.50 - $65.20 If this level is defended by the bulls, the price is likely to push towards the $69.00 - $70.20 range, which represents the next major resistance zone.
Resistance levels: $69.15, $70.20
Support level: $66.00, $65.20
The price has recently tested the $65.20 support zone. A potential false breakdown could occur here, aimed at capturing liquidity before prices resume their upward trajectory. With the correction phase likely behind us, renewed buying interest in USOIL could drive prices higher as the uptrend continues to unfold.

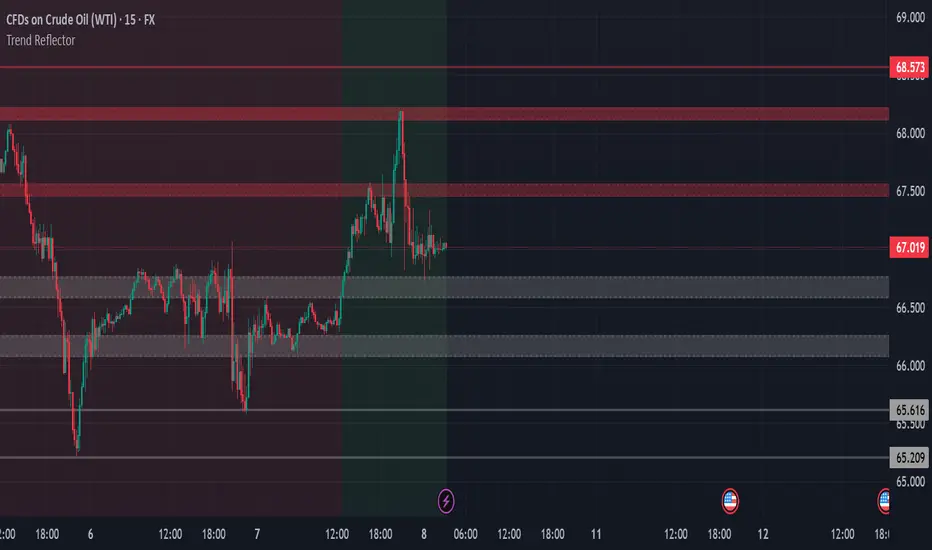
USOIL Trade IDEA for upcoming session of Monday 15M TFOn looking at the chart of USOIL in higher TF's i've figured out some imp and key levels and zones to focus on last session it closed at 67.019 and if we look on price movement then our next resistance zone is 67.465 - 67.560 after that we get the next zone which is 68.100 - 68.215 which is the last session approx high and after this we can get new resistance zone of 68.550 - 68.600 if we talk about support then nearest support is 66.757 - 66.589 and after that we can get new support at 68.250 - 68.085 then next support is 65.616 , while looking at the chart in every TF's i think crude may head for higher price for some session's because it get rejection on weekly and daily TF and it also showed bullish scenario in my self made indicator , i've given all the imp level's wait for resistance breakout and place SL below resistance low ( alternative and safe method is to wait for retesting then enter) if price goes downward's then wait for reversal pattern's then enter and place SL below support low , wait for price to show some reversal or continuation pattern before entering.
in.tradingview.com