This is deflationaryCrude CMP $65.80
These inverted V shaped falls are just the first leg of the fall. In Elliott they are wave A. The rally was very small indicating weakness, which is wave B. Below $63.80 we will see minimum $47. This is very deflationary. In my view the Fed will start to reduce interest rates very soon.
Trade ideas

USOIL Trade IDEA for upcoming session of Wednesday 15M TFOn looking at the chart of crudeoil on all timeframe i've figured out some levels to watch for today
S1 Zone - 69.680-69.700 ( represented as white line in chart ).
S2 Zone - 69.420-69.470
one of these zones should work as reversal zone of the instrument from there price should take rejection and should move to upside breaking of these zone's we should watch for the price reaction on 66.740-66.950 if this zone also breaks then we can see the levels of 65.500 til this level there is no support for now until new one create's.
and the Resistance Zone's are -68.480-68.620 if this level is breaked then look for 69.000-69.100 level and also on this level breaking price should reach 70.000.
Look for price reaction on every level and zone watch how it reacts to zone's and levels if rejection occurs then place trade according to that if continuation occurs then place trade according to that ( on breakout or breakdown it's good to place trade on retesting for better and safe trade's ,let's see how price react's.

USOIL or CRUDEOIL Downtrend Movement upto 49SYMBOL USOIL or CRUDEOIL
Timeframe Day chart
Analysis: Breakout from the triangle pattern and we can expect a downtrend movement upto 49
We hope our analysis is adding value to your trading journey.
Please note: Published ideas are for educational purposes only. Trade at your own risk.
Also, please respect the risk - stop loss (SL) should not be more than 2% of the capital.
DISCLAIMER: We are not SEBI registered. All the videos uploaded in this channel are solely for educational purposes."

USOIL Trade IDEA for upcoming session of Monday While looking at the candlestick pattern's and price movement of USOIL looks like there is no change in Support and Resistance zone's as shown in my last session idea but i'll mention levels again and also show them in chart 70.106 - 70.634 is no trade zone but a zone displayed by orange color 70.500-70.600 is resistance zone this zone is the good resistance zone price fall from this zone in the previous session and surprisingly for the upcoming session of monday it formed tweezer top ( Equal High ) in 15min TF highlighted by circle in chart so price should fall from this level and SL should be above Orange zone and we will follow the target levels as shown in chart as support levels alternative scenario is if our SL is triggered then we will wait for the price to go above 70.634 and closely watch it's price movement if it sustain above it then we will go for upside trade and target should be 71.676-71.976 zone highlighted in the chart .

Crude buy on dip near support levels on chart How to take trades using Harmonic pattern projection Trade setup is explained below :-
Entry : 1st SL point : 0% is recent top or bottom.
Trailing D: 11.4% is work as trailing SL of buy or sell trade if hit then we have to book profit
.If price goes below 2nd D 21.4% then early traders can make fresh reversals trade after breaking 1st D 11.4% safe traders can reversal trade after breaking 2nd D 21.4%
Targets :
Target T1 : 28.3% ( early trade if entry at 11.4% )
Target T1 : 35.1% to 38.2%
Target T3 : 49.1% to 53.2%
T3: 61.8% to 65.1% is our 3rd Target since this is reversal zone so must book profit if break then take fresh trade again
Target T4 : 76.4% to 79.7%
Next Targets are 100% , 127.2% ,141.4% and final Target 161.8%.
How to take reversal trade :
If price going upside/ downside then then buy or sell levels appear on Chart ( Automatically show when price reach any reversal zone of harmonic projection pattern based .
After showing reversal levels wait for confirmation until 21.4% or 28.3 % level not break if break then exit from current buy / sell trade and take fresh reverse trade buy/ sell .
Trailing SL:
After reach 1st Target trail SL to just above or below cost ( for example we are holding sell trade from 100 1st Target 110 hit then move trailing sl to 104-105 and move SL as price move upside or Downside)
Re- Entry :
For Re-entry in any pull back Point D ( 11.4% ) is used for re-entry then SL recent high or low Point D ( 0% ) .
Target is same as early 21.4% , 28.3 , 35.1 and so on
Blue Line is 1st support/ Resistance
Green line is 2nd support/ resistance
Red line is 3rd Support/ resistance

USOIL Trade Idea (Zones) for Friday session 28-02-25After studying USOIL at higher TF and watching it's closing price i think 70.106 - 70.634 is No-trade zone for USOIL due to it's complexity at higher timeframe , i've also drawn a zone which can push price to downward direction which is represesnted by orange color in the chart if price sustained above this level then it can go to it's next resistance zone of 76.500 - 76.600 but here SL should be below the zone which is 70.106 and the zone itself is mutual in multiple timeframe so be cautious to trade in this zone and use manage Quantity , and for alternative scenario if price goes below 70.106 and sustained then we can see then 69.150 level because it was the last swing created and below it other levels are also mentioned in the chart , look for reversal and continuation pattern to enter in trade .

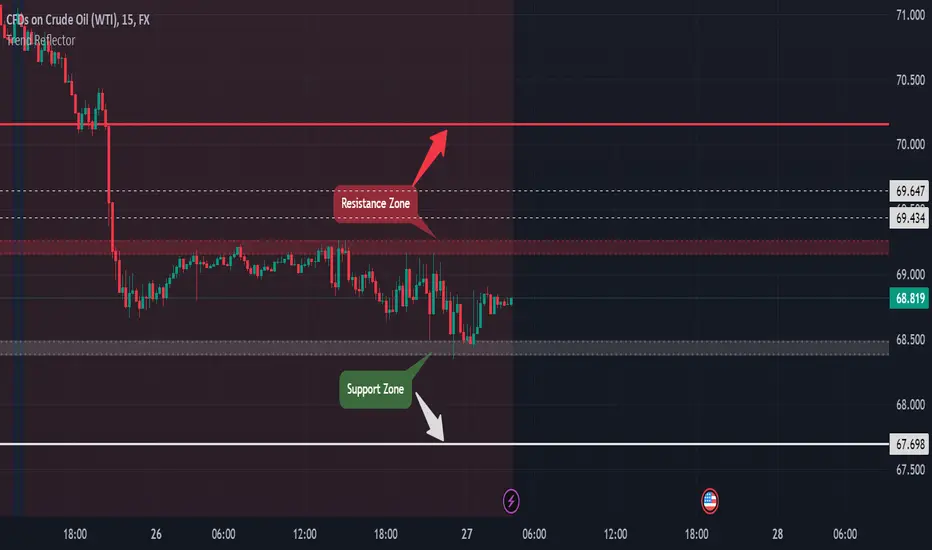
USOIL Trade IDEA for upcoming session's of Thu & FridayClosing of the last session of USOIL occurs at 68.819 and after looking at every timeframe and the price action concludes the support and resistance zone's for the upcoming session's as we look in chart next support zone 68.380 - 68.486 if price goes below this level then wait for minor retesting and short for 67.700 level which is next support this is because in higher TF picture show's downtrend ( but in lower TF retesting occurs ) for alternative scenario's if price goes upward then 69.155-69.270 is the next and strong resistance zone at this place look for reversal pattern this would be the zone from where price drop ( but 69.430-69.630 is minor reversal range shown as dotted lines in the chart which can cause reversal if price surpases the first resistance zone ) if price breaks these zones then take a buy for next resistance zone of 70.000 - 70.100 but it seems price drop of the USOIL for these session's let's see what will happen .
USOIL CHART ANALYSIS FOR 24 FEB 15M TFIn the Last session USOIL falls heavily and in daily TF it made a huge Bearish candle and gave us a daily support and resistance zone and for now for 70.112 - 70.158 is the support zone which is very near to closing of the last session price may take a pullback from this level to 70.950 - 70.170 which is the cruicial zone ( Highlighted as yellow zone in the chart ) from there price may fall again and next support is the 69.100 - 69.160 , if price break the cruicial zone then it may retrace to 71.630 - 71.800 which is the nearest resistance , i'll place my trade according to my indicator setup so look for continuation or reversal pattern to enter in trade .

CRUDE LONGRules:
First decide on SL. Don't place SL order. Put an alert.
Then Identify possible target, check if Risk reward greater than 1.
Make entry.

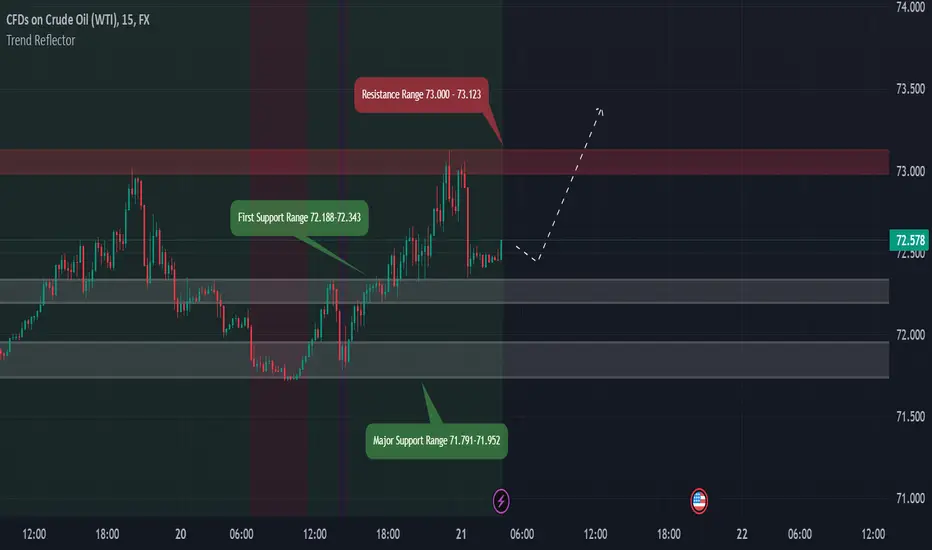
USOIL Chart analysis for Friday 21 Feb 25 Session 15M TFUSOIL last session closing was at 72.578 and made a high of 73.123 after studying it in higher TF i think if price comes downward then it's First Support Range is 72.188-72.343 if this range works as good support then we can see price upward movement from this range of support if it'll not sustain then Major Support Range is 71.791-71.952 it is good support it should sustain the price if it comes towards it in case it breaks then we can see bearish movement for the day , these support levels should work if we take a look in higher TF and our Trend Reflector also indicates bullish sentiment look for reversal price action if price comes to these levels , in case it breaks resistance zone of 73.000- 73.123 then we may get the level of 73.750 which is the next resistance , it's very clear look for bullish entry until major support breaks, it seems bullish for the day.
Crude Oil suggests Trump fear on Perfect SetupFear is clearly visible on the Perfect Setup.
Despite a 4H 2 Top (Extended TSI and Fisher up move given in this Chart), 1D TSI could not be triggered. A visible weakness sign.
One thing for sure, Crude Oil suggests Trump fear on Perfect Setup.
4H Bottom will be the target downside. A Sell till then.

XTIUSD / USOIL / CRUDEOILUS WTI Crude (Spot) (XTIUSD) on a daily timeframe from the FXOPEN platform. Here are some key points to consider for a potential buying opportunity:
1. **Price Levels**:
- **High**: 82.50 USD
- **Low**: 64.74 USD
- **Current Price**: 71.98 USD
- **Bid**: 71.97 USD
- **Ask**: 72.01 USD
2. **Technical Indicators**:
- **Stochastic Oscillator**: The current values are approximately 63.79 (blue) and 54.08 (orange), indicating that the market is not in the overbought zone, which suggests there may be room for upward movement.
- **Trend Lines**: Two purple dashed trend lines form a rising wedge pattern, indicating potential future price movements.
3. **Price Action**:
- The chart shows a general upward trend with some volatility, as indicated by the candlestick patterns.
- The price is currently near the lower boundary of the rising wedge pattern, suggesting a potential buying opportunity if the price bounces off this support level.
4. **Volume**:
- The volume bars at the bottom of the chart show the trading volume for each day, with varying heights indicating different levels of trading activity.
In summary, the current price is near a support level within a rising wedge pattern, and the stochastic oscillator is not in the overbought zone, suggesting that there may be room for upward movement. Traders might consider buying if the price shows signs of bouncing off the support level and if the stochastic oscillator confirms a bullish signal.

USOIL Chart Pattern for upcoming session's 15M TFWith accordance to 4H TF USOIL should fall to 71.500 to 71.200 with ease in this session but if we take a look to Daily TF we may see a price upper side when it touches 71.65-71.750 ,i've analysed it bit more it looks like if it goes to 71.500 then we should wait for 71.350 level to break and close below it and then short till 70.600 but in case it takes rejection at level of 71.350 - 71.500 then we can see 73.000 as our next target .

Crudeoil expected uptrend movement upto 74/75.5Symbol CRUDEOIL
Timeframe 1 hour
Analysis Uptrend Movement upto 74/75.5 expected.
Breakout from Triangle pattern, so we can expect a uptrend movement upto 74/75.5
We hope our analysis is adding value to your trading journey.
Please note: Published ideas are for educational purposes only. Trade at your own risk.
Also, please respect the risk - stop loss (SL) should not be more than 2% of the capital.
DISCLAIMER: We are not SEBI registered. All the ideas posted in this channel are solely for educational purposes."

USDWTI Technical Analysis.When the USDWTI weekly chart is examined; It is observed that the price movements continue in a triangle formation. It is evaluated that the USDWTI price can target the 107.00 level in price movements above the 75.95 level, but it is evaluated that it can retreat to the 34.57 level in price movements below the 65.47 level.

WTI Crude Oil Trading Recommendation - SELL StrategyInstrument: USOIL (WTI Crude Oil)
Timeframe: 1H, 4h
Strategy: Pending Sell Order (Sell Limit)
Technical Analysis:
WTI crude oil is approaching a key resistance zone at 72.5 - 72.9 USD/barrel, where strong selling pressure is expected.
The overall trend remains bearish as the price stays below the EMA 33 levels.
If the price reacts strongly at this level, a pullback towards lower support zones is highly likely.
Trade Setup:
✅ Entry (Sell Limit): 72.5 - 72.9 USD/barrel.
✅ Stop Loss (SL): 73.00 - 73.80 USD/barrel.
✅ Take Profit (TP):
Target 1: 69.88 USD/barrel.
Target 2: 68.36 - 67.40 USD/barrel.
✅ Holding Time: Expected until early next week.
Market Outlook:
The 72.5 - 72.9 USD zone is an ideal area for short-selling due to strong supply levels.
If the price shows a bearish reaction here, selling pressure could push it down to 69.88 USD, and possibly lower to 68.36 - 67.40 USD.
This strategy aims to take advantage of a pullback before continuing the downtrend, offering a favorable risk-reward ratio.

WTI Crude Oil Buy Recommendation – Short-Term Rebound OpportunitMarket Overview
WTI Crude Oil (USOIL) has experienced a strong correction from the $79 peak, dropping to a key support area around $70.75 – $70.87. This level aligns with the 0.0% Fibonacci retracement of the previous rally and a significant demand zone that has been tested before.
Technical Analysis
Strong Support at $70.75 – $70.87
Price is reacting positively at this key support zone, with increasing buying pressure.
A wick rejection candle and rising volume indicate potential bullish interest.
Short-Term Rebound Targets
The first target is $71.76, a nearby resistance level.
The next potential upside range is $73 – $75.63, aligning with the 0.236 and 0.382 Fibonacci retracement levels, along with the moving averages.
Confirmation Signals
A reversal candlestick pattern has emerged at the support zone.
The RSI indicator shows a bullish divergence, suggesting a potential price recovery.
Trading Strategy
Entry (Long Position): Buy around $70.80 – $71.00.
Take Profit (TP):
Target 1: $71.76
Target 2: $73.50 – $75.63 (expected early next week)
Stop Loss (SL): $69.80
Good luck Everybody!

USOIL - BULLISH TREND WILL CONTNUE ?Symbol - USOIL
The USOIL has recently experienced a decent correction within its uptrend, which has provided an opportunity for price consolidation before the potential continuation of the bullish trend. This correction has allowed the market to stabilize, and the recent price action suggests that the uptrend is likely to resume, supported by a combination of supply constraints and growing demand expectations.
Geopolitical tensions and OPEC production cuts continue to play a significant role in influencing oil prices, while global economic recovery, particularly in major consuming nations, provides further optimism for sustained demand. These factors are likely to continue supporting oil prices as market participants remain cautious about future supply disruptions. With the recent correction now completed, USOIL appears poised for further upward momentum, especially if these bullish fundamentals continue to hold.
Technically, the key support level to watch is $72.50 - $73.00 If this level is defended by the bulls, the price is likely to push towards the $78.00 - $80.00 range, which represents the next major resistance zone.
Resistance levels: $78.00, $80.00
Support level: $73.00
The price has recently tested the $73.50 support zone. A potential false breakdown could occur here, aimed at capturing liquidity before prices resume their upward trajectory. With the correction phase likely behind us, renewed buying interest in USOIL could drive prices higher as the uptrend continues to unfold.


By oilThe H1 trend is declining.
Price resistance breaks, continuing the downtrend.
The crowd is selling along with the trend.
Those losing money will continue to lose; the resistance above provides a reason for sellers to enter and sell further.

USOIL Elliot wave predictionOIL is under the correction and look like it is double zigzag and posible becoming triple zigzag and the if it break out to upside than it may go to upside in very less time.

Crude Oil taking rejection Crude Oil taking rejection from weekly demand zone, if sustains we can see an upmove till swing supply zone . Sl will be below the demand zone .

Crude OilLet's break down the trend and reversal analysis of this chart:
### 1. Trend Analysis:
- **Uptrend:** As seen in the chart, prices form higher lows (HL), indicating an upward movement over time. Higher lows suggest that buyers are gaining strength at each dip.
- **Downtrend:** Conversely, the presence of lower highs (LH) points to a downward trend where sellers dominate, causing prices to decline with each rally.
### 2. Reversal Signals:
- **Stochastic Oscillator:** This tool helps identify overbought (82.60) and oversold (73.03) conditions. When the oscillator crosses above or below these levels, it can signal possible price reversals.
- **Candlestick Patterns:** Notice the formations around higher lows and lower highs. These patterns can provide clues to potential reversals. For example, long wicks indicate price rejection at certain levels, hinting at a change in direction.
### 3. Key Levels:
- **Resistance Levels:** Prices often struggle to break above certain points, known as resistance. In this chart, the high around 79.44 USD could act as a resistance level.
- **Support Levels:** Similarly, prices tend to find support at lower levels like 64.74 USD, where buyers step in to prevent further decline.
To sum it up, this chart indicates that the WTI Crude market experiences alternating trends, with periods of upward (higher lows) and downward (lower highs) movements, while key indicators (stochastic oscillator and candlestick patterns) provide insight into potential reversals.
Feel free to ask if you'd like to dive deeper into any specific aspect!
