AdbeBearish Wyckoff Distribution Schematic #2 (unorthodox)
I would be happy to go wrong however I do see this to test 260 in 2 yrs
it has to cross 590 to nullify this setup
ADBE trade ideas


Adobe Continuing sidewaysPositive Signs:
Bounced back from the Upward trendline running from October to May.
Bounced back from the upper part of the flag pattern formed in the last quarter of 2022
Spent just a week below 50DMA & 200DMA and bounced back
Negative Signs:
Volumes are average
Resistance around 385-400 price
Recommendation:
Sell near 385-400 resistance zone OR wait for an upward breakout with good volume.

Adobe is near resistance, with +ve bias. Wait & Watch mode.There are three +ve indicators (suggesting buy)
1. Price moved above 50DMA with good volume on 16th March
2. Price moved above 200DMA with good volume on 17th March.
3. Golden-Crossover (50DMA above 200DMA) on 21st March.
However, the volumes are still lower than average and the price is stuck between 385-400 range, suggesting profit booking in this range.
Short-Term view - book profit in the 385-400 range.
Mid-Term view - wait for a breakout from 400 for a ~10% upside.


Adobe at SupportAdobe has been hammered recently after the forecast of lower growth in the stock's earnings. However, it looks like the correction has been very sharp. There are chances that it might take support at current levels of $500 and this can be a good accumulation zone. I have also marked another lower level if this level is broken which will be held as per me.

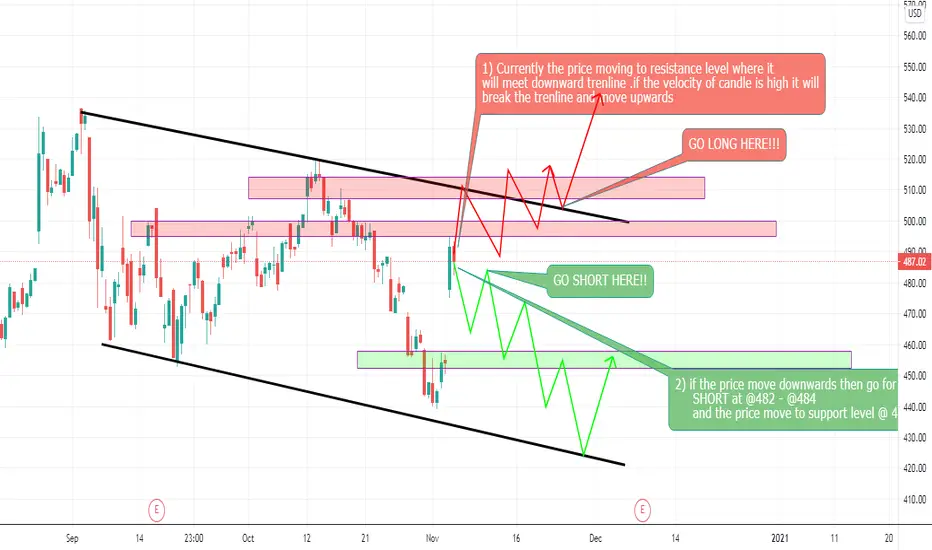
Adobe Consolidating in 450-500, can break out to 600, 740Adobe has been consolidating from 450-500 range since August-2020. In a way it's been generating a flag formation since the lows of March-2020.
It's currently at a very crucial level of 450 and it's important that the stock doesn't fall below 450.
On the positive side, if the price breakout can happen above 514 the immediate levels would be 600 & 740. These can be calculated using the Fibonacci levels as well as flag-pole height.
Fingers crossed to 740 levels in coming months...


Adobe stock price at crucial level of consolidationAdobe Spent over 7 months between ~450-500.
Stock price & moving averages are at a very crucial level and near the lower edge of the consolidation window.
The possibilities are:
1. Adobe doesn't come back to 475+ levels by end of week (5-mar). Shows some weakness for coming weeks.
2. Adobe closes below 450, then the fall could be till 380-390. This aligns well with the Fibonacci level as well as last prominent top.

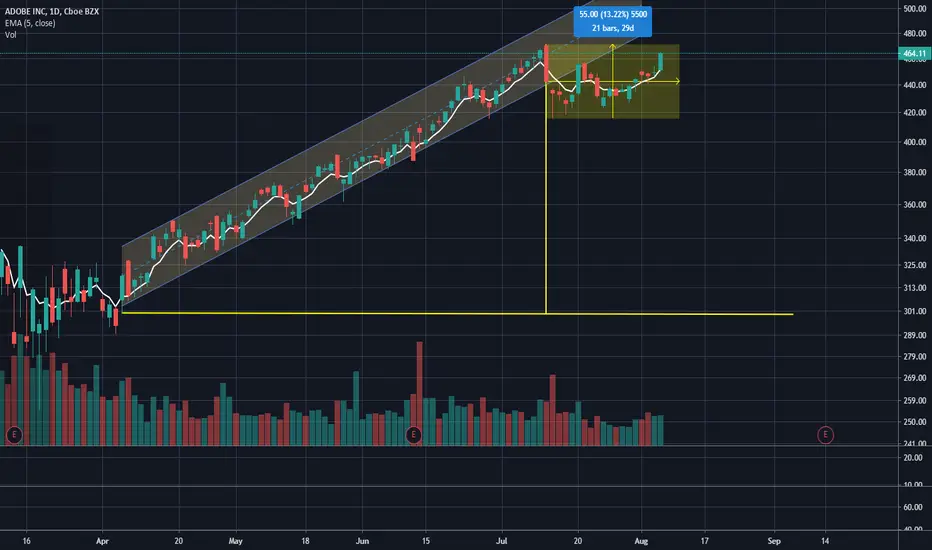
Adobe Stock Up-Flag formation is in ProgressIf Adobe goes above 470 with a spike (in a day or within a week) Then it has a high probability to increase by 25-30% in 2-3 months. i.e. target of 600+
If Adobe goes below 420 then the fall can be down to 370-380.
I'm bullish on this share because it's in in uptrend on the monthly charts.