GOLD - BULLISH STRUCTURE INTACTSymbol - XAUUSD
CMP - 3018
Gold is currently undergoing a corrective phase, having broken through channel resistance and is now consolidating above the downtrend line. Market participants are awaiting key economic data and potential developments in the ongoing tariff dispute.
President Trump has
Key data points
About Gold Spot / U.S. Dollar
Gold price is widely followed in financial markets around the world. Gold was the basis of economic capitalism for hundreds of years until the repeal of the Gold standard, which led to the expansion of a flat currency system in which paper money doesn't have an implied backing with any physical form of monetization. AU is the code for Gold on the Periodic table of elements, and the price above is Gold quoted in US Dollars, which is the common yardstick for measuring the value of Gold across the world.
No news here
Looks like there's nothing to report right now


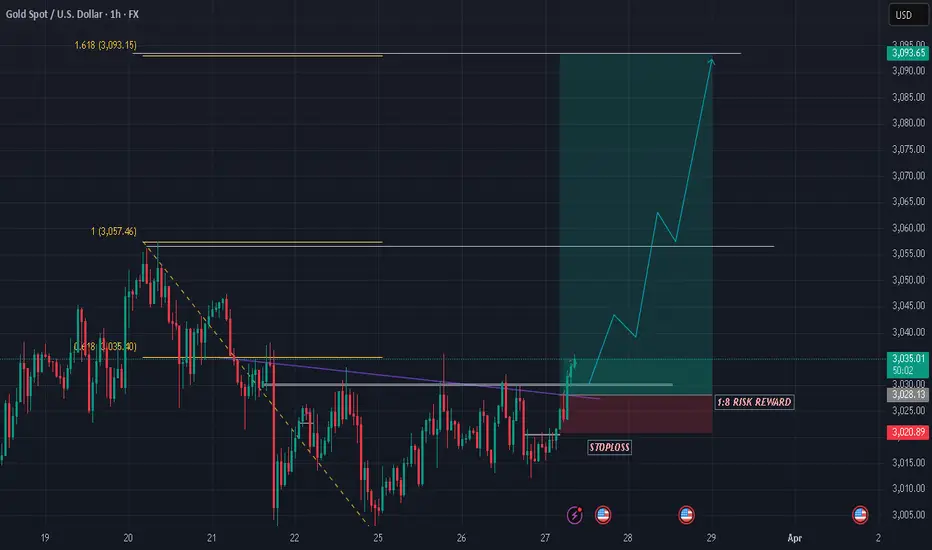
GOLD SHOWING A GOOD UP MOVE WITH 1:8 RISK REWARD GOLD SHOWING A GOOD UP MOVE WITH 1:8 RISK REWARD
DUE TO THESE REASON
A. its following a rectangle pattern that stocked the market
which preventing the market to move any one direction now it trying to break the strong resistant lable
B. after the break of this rectangle it will boost the market p
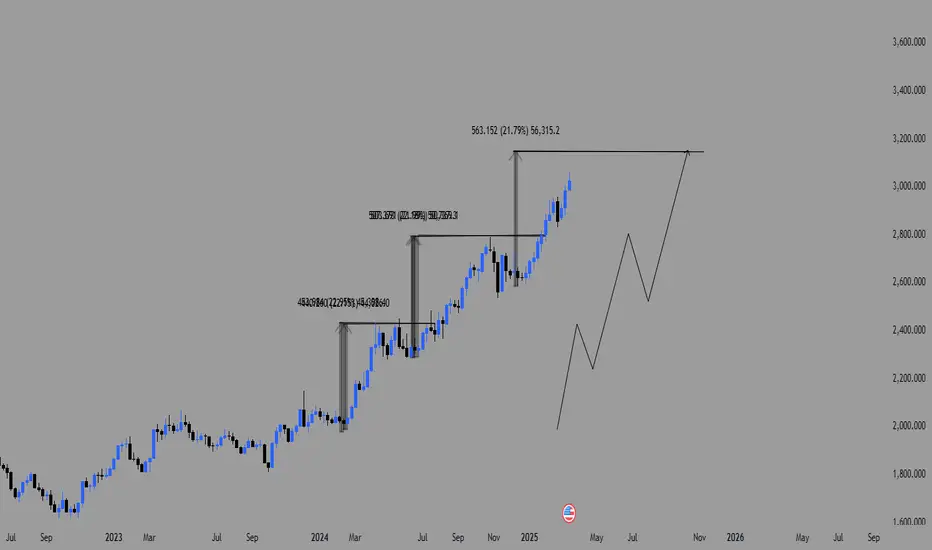
When Will Gold Fall ?Structure of Gold Clearly shows Wev can expand more , But How Much . Sp the answer is Wave Theory . We have a Impulse Waves of almost 22% . So its come Around 3150$ - 3160$ in the 3rd Wave . At these Price we can Expect Some corrrection or fall in Gold . Till Then You can use Dips To long And Can C
XAUUSD SHOWING A GOOD DOWN MOVE WITH 1:5 RISK REWARD XAUUSD SHOWING A GOOD DOWN MOVE WITH 1:5 RISK REWARD
DUE TO THESE REASON
A. its following a rectangle pattern that stocked the market
which preventing the market to move any one direction now it trying to break the strong resistant lable
B. after the break of this rectangle it will boost the mark


My trading idea on the Gold (XAU/USD) 30-minute chart Trend & Structure
-I have identified a descending trendline, indicating a bearish market structure.
- The price has formed lower highs and lower lows, supporting the sell bias.
Entry Zone (Red Zone - Supply Area)
- The price is moving toward a key resistance zone (highlighted in red).
- I

Gold Facing Market Storm: Will The Uptrend Continue?The gold market is witnessing strong fluctuations as money flows continuously between safe-haven assets. Gold prices briefly jumped above $3,030/ounce in overnight trading, but profit-taking pressure quickly appeared, pushing prices down to $3,018 this morning. However, the overall trend is still le

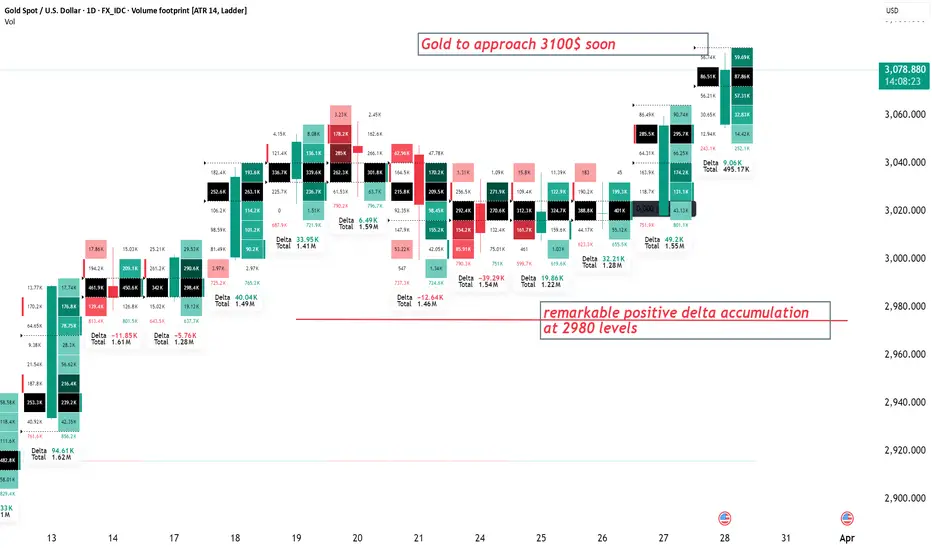
As quoted on 30th Jan 2025 3100 $ has finally being approched.As quoted on 30th Jan 2025 3100 $ has finally being approached.
The daily chart shows that Gold price has almost tested the ascending triangle target, measured at $3,080.
Therefore, a minor pullback cannot be ruled out in the near term. Additionally, the 14-day Relative Strength Index (RSI) has en
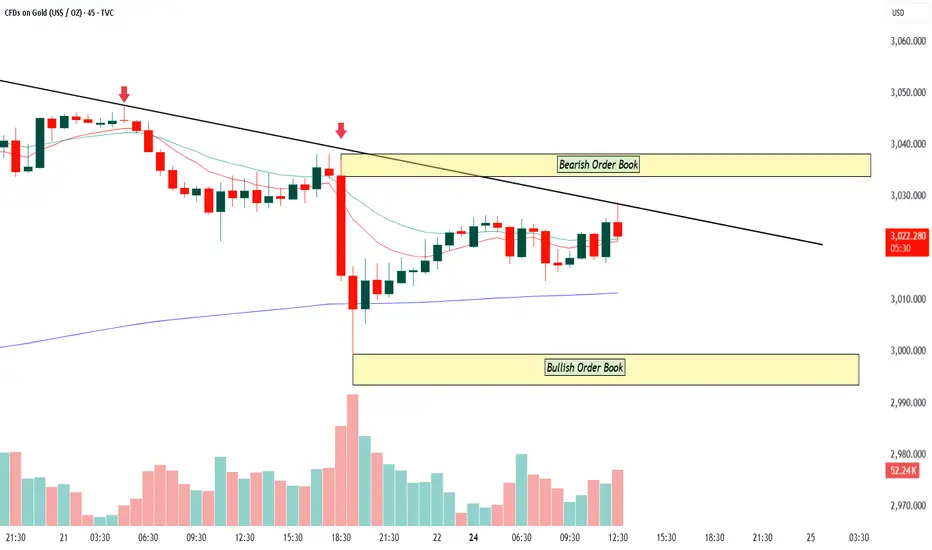
Gold- 45 min Time Frame Gold Trade Setup (Based on Trendline, EMA & Order Block Analysis)
1. Trendline Analysis
The chart shows a descending trendline connecting multiple lower highs (highlighted with red arrows). The price is respecting this trendline, indicating a downtrend. The most recent price action shows a rejection
See all ideas
Summarizing what the indicators are suggesting.
Oscillators
Neutral
SellBuy
Strong sellStrong buy
Strong sellSellNeutralBuyStrong buy
Oscillators
Neutral
SellBuy
Strong sellStrong buy
Strong sellSellNeutralBuyStrong buy
Summary
Neutral
SellBuy
Strong sellStrong buy
Strong sellSellNeutralBuyStrong buy
Summary
Neutral
SellBuy
Strong sellStrong buy
Strong sellSellNeutralBuyStrong buy
Summary
Neutral
SellBuy
Strong sellStrong buy
Strong sellSellNeutralBuyStrong buy
Moving Averages
Neutral
SellBuy
Strong sellStrong buy
Strong sellSellNeutralBuyStrong buy
Moving Averages
Neutral
SellBuy
Strong sellStrong buy
Strong sellSellNeutralBuyStrong buy
Displays a symbol's price movements over previous years to identify recurring trends.