Gold drops from 2942: Below 2910, can drops to 2880-2860Selling pressure below 2910
Possibility of retracement to
2880-2860
XAUUSD_LMAX trade ideas

XAU SELLLast week, the price opened higher and increased on Monday morning.
The crowd kept buying, and on Tuesday morning, they continued to buy.
Wait for the price to return and close a candle below Tuesday’s opening level, then sell.

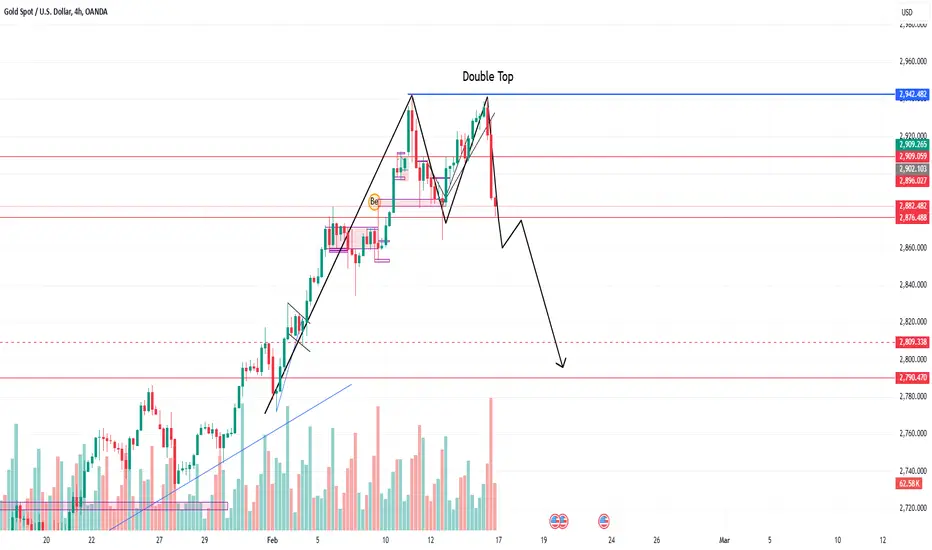
XAUUSD Double Top PatternOANDA:XAUUSD
Hi All, here you can see that XAUUSD has created Double top pattern in 4HR Time frame. so if it breakes down the drawn level we can short and capture some pips.
Gold’s Strong Reversal at ATH Zone – What’s Next?📉 Sharp Drop from ATH – Key Market Reaction
🔥 Gold saw a strong rejection at the previous ATH zone, which we had highlighted earlier.
📌 The price dropped nearly 70 points, falling back below 2880 – marking the biggest drop in a month.
🛑 A double-top pattern has formed on the H4 timeframe, with strong bearish confirmation.
🏛 Fundamental Insights: PCE Data in Focus
📊 Recent economic reports like CPI & PPI suggest that the upcoming PCE inflation data (collected by the U.S. government) remains crucial.
📈 If the data supports a stronger USD, a correction in gold is highly expected, especially after its strong bullish momentum.
📅 What to Expect on Monday?
⚠️ There is a high probability of a price gap at the market open due to:
🔸 Weekend liquidity shortages 📉
🔸 Profit-taking from previous highs 💰
🔸 Buyers waiting for better re-entry levels 📍
➡️ We could see an initial bullish gap followed by a retracement during the Asian session.
📊 Trading Plan: Short-Term Bearish Bias
✅ Sell setups are favorable in the short term.
📌 Key support & resistance levels for next week will be posted in tomorrow’s update.
🔔 Follow for real-time market insights & top-tier analysis!
💬 What’s your view on gold? Comment below! 👇

Gold in correction modeIn reference with my previous post, gold has made a 3-3 corrective move and didn't break above the high, so price is expected to break the low of 2864 .
Lets see how it unfolds in coming days.

XAU/USDPrice action is a trading technique where traders make decisions based on the price movements of a financial asset, rather than relying on technical indicators. It involves analyzing historical price data to identify patterns and trends that can indicate future price movements.

Gold XAUUSD sell on rise 2840,2830,2808 downside Target How to take trades using Harmonic pattern projection Trade setup is explained below :-
Entry : 1st D point : 0% is recent top or bottom.
Trailing SL: 17.5% is work as trailing SL of buy or sell trade if hit then we have to book profit
.If price goes below 17.5% then early or risky traders can reversal trade ,
Targets :
Target T1 : 28.3%
Target T1 : 37.8 %
Target T3 : 48.1%
T3: 60.2% to 66.9 % is our 3rd Target since this is reversal zone so must book profit if break then take fresh trade again
Next Targets are 77.5 % , 88.1 % 100% , 113.5 % , 127.3% , 141.2% and 160.2 , 177.5. final Target 200%
160.2 to 177.5% if profit booking area so book full profit and wait for reversal.
How to take reversal trade :
If price going upside/ downside then then buy or sell levels appear on Chart ( Automatically show when price reach any reversal zone of harmonic projection pattern based .
After showing reversal levels wait for confirmation until 17.5 % or 28.3 % level not break if break then exit from current buy / sell trade and take fresh reverse trade buy/ sell .
Trailing SL:
After reach 1st Target trail SL to just above or below cost ( for example we are holding sell trade from 100 1st Target 110 hit then move trailing sl to 104-105 and move SL as price move upside or Downside)
Re- Entry :
For Re-entry in any pull back Point D ( 9.3% ) is used for re-entry then SL recent high or low Point D ( 0% ) .
Target is same as early 17.5 % , 28.3 , 37.8 and so on
Blue Line is 1st support/ Resistance
Green line is 2nd support/ resistance
Red line is 3rd Support/ resistance

30-Minute Gold Analysis: Watching for a Potential Breakout!There is nothing here, everything has been explained above!
CAPITALCOM:GOLD

🇮🇳 INDIA’S GOLD RUSH – WILL PRICES BREAK NEW RECORDS?📢 Key Market Drivers
Gold is holding strong bullish momentum, supported by India’s festive demand and macroeconomic factors.
🔹 💍 India’s Festival & Wedding Demand
Massive gold buying for Diwali & weddings is fueling demand.
Increased gold imports are adding further market support.
🔹 📈 Inflation & Economic Trends
US PPI inflation came in hotter than expected but wasn’t as aggressive underneath.
CPI inflation remains high, making next week’s PCE data crucial (Fed’s key inflation gauge).
🔹 🌎 Trade & Policy Impact
US tariff delays ease trade tensions but inflation fears keep gold bullish.
💡 With strong seasonal demand from India and shifting global dynamics, gold could see new all-time highs (ATH) ahead.
📊 Crucial Price Levels
🔹 🚀 Resistance Zones:
🟥 2933 – Initial price barrier
🟥 2942 – Strong supply level
🟥 2960 - 2990 – High volatility area
🔹 📉 Support Zones:
🟩 2925 - 2920 – Key breakout retest zone
🟩 2914 - 2908 – Strong demand level
🟩 2895 - 2882 – Deeper buying zone
📌 A hold above 2922 - 2920 keeps the uptrend strong. A break below could trigger short-term pullbacks.
📑 Trading Strategy for Today
🟢 BUY SCALP SETUP
📍 Entry: 2908 - 2906
📉 SL: 2903
🎯 TP: 2912 - 2915 - 2920 - 2924 - 2928
🟢 BUY OPPORTUNITY (For Long-Term Positions)
📍 Entry: 2884 - 2882
📉 SL: 2879
🎯 TP: 2884 - 2892 - 2896 - 2900 - 2905 - 2910
🔴 SELL SCALP SETUP
📍 Entry: 2940 - 2942
📉 SL: 2945
🎯 TP: 2936 - 2932 - 2928 - 2924 - 2920
🔴 SELL OPPORTUNITY (High-Risk Reversal Zone)
📍 Entry: 2959 - 2961
📉 SL: 2965
🎯 TP: 2954 - 2950 - 2946 - 2942 - 2936
📌 ⚠️ Friday Caution: Volatility may spike with liquidity sweeps—stick to TP/SL to protect capital!
📌 Risk & Trade Considerations
🛑 Strict TP/SL adherence – Avoid unexpected losses.
📉 Watch bond yields & DXY – Key indicators for gold’s movement.
📅 Upcoming Economic Data – Keep an eye on next week’s PCE inflation release.
📢 Will India’s festival & wedding demand push gold past new highs? Drop your insights in the comments! 🚀🔥

good morning traders, fresh gold entry range calculaterhello guys good morning fresh entry in gold by the king of trading powerfull analysis gold,btc,ect. com to join me now ,,,,,

Gold drops to 2873: Buying to resume from 2858?Gold has broken yesterday's low of 2883 and dropped to 2864.
4 hourly 50 EMA 2858 is likely to be tested where some buying can be witnessed and recovery rally can reach 2888

View XAU 12/02/2025If the price drops and forms 3 consecutive red candles, you need to find an opportunity to sell gold to the bottom.

GOLD Trading Plan for 11th February 2025Buy Signal:
Entry Point: Buy above the high of the one-hour candle that closes above 2924.
Targets: 2930, 2939, 2947
Sell Signal:
Entry Point: Sell below the low of the one-hour candle that closes below 2892.
Targets: 2976, 2862, 2854
Explanation:
Buy Signal:
Entry Point: When the one-hour candle closes above 2924, observe the high of that candle. Place a buy order above this high to capitalize on the bullish trend.
Targets: The first target is 2930, followed by 2939 and 2947. These levels represent potential profit-taking points as the price continues to rise.
Sell Signal:
Entry Point: When the one-hour candle closes below 2892, observe the low of that candle. Place a sell order below this low to capitalize on the bearish trend.
Targets: The first target is 2976, followed by 2862 and 2854. These levels represent potential profit-taking points as the price continues to fall.
Strategy Summary:
Buy: If the high of the one-hour candle that closes above 2924 is breached, consider buying with targets at 2930, 2939, and 2947.
Sell: If the low of the one-hour candle that closes below 2892 is breached, consider selling with targets at 2976, 2862, and 2854.

GOLD - TRADING AT CHANNEL RESISTANCE - TIME TO SELL?Symbol - XAUUSD
CMP - 2858
Gold has reached a new all-time high (ATH) of $2861 & trading at rising channel resistance, amidst heightened risks of tariff conflicts and persistent inflation, encountering resistance at the channel trend. However, due to potential political manipulation, the possibility of a market correction exists.
Currently, gold is consolidating above $2840 following its ATH, as it awaits key data such as US employment figures and speeches from Federal Reserve officials. Increased volatility has been observed, driven by conflicting statements regarding former President Trump's tariff policies: tariffs were initially imposed, only to be rescinded a few hours later, highlighting the influence of political decisions. Following a false breakout at the resistance of the ascending channel, gold is now undergoing a correction, partly prompted by news of the temporary suspension of tariff hikes by the United States. Despite these fluctuations, gold remains resilient, supported by the Fed’s cautious stance on rate cuts.
Key Resistance levels: $2860 and $2872
Key Support levels: $2845, $2840, $2818
Should the price fall below the $2840 mark and consolidate beneath this level, a short-term correction towards $2824 - $2815 may occur. However, no significant trend reversal is indicated, and growth may resume from these key support areas.

Gold Trading Plan for 10th Feb 2025Buy: Above the high of the 15-minute candle that closes above 2880.
Targets: 2887, 2895, 2908
Sell: Below the low of the 15-minute candle that closes below 2850.
Targets: 2841, 2833, 2825
Disclaimer: Trading in financial markets involves substantial risk and is not suitable for every investor. The high degree of leverage can work against you as well as for you. Before deciding to trade any asset, you should carefully consider your investment objectives, level of experience, and risk appetite. You should be aware of all the risks associated with trading, and seek advice from an independent financial advisor if you have any doubts. Past performance is not indicative of future results.

GOLD TRADING POINT UPDATE > READ THE CHAPTIAN Buddy'S dear friend 👋
SMC Trading Signals Update 🗾🗺️ Gold traders SMC trading poi nt update you on New technical analysis setup list time post signals 🚀 Hit sucksfully My target 🎯 point 2877 Now ✅ update you on New technical analysis update on gold 🪙 Gold still going to bullish trend 📈 🚀 today us session. More bullish on Gold take a New ATH 2904 I'm long Now 2869 + 2904 Good luck 💯🤞
Key Resistance level 2880 + 2904
Key Support level 2866 - 2854 - 2845
Mr SMC Trading point
Plaes support boost 🚀 analysis follow)

XAU/USD Bearish Harmonic Pattern - Short Setup at Key ResistancePattern Formation:
A Bearish Harmonic Pattern (likely a Gartley or Butterfly) has formed on the XAU/USD 4-hour timeframe. This pattern indicates a potential trend reversal at the D point, aligning with a key resistance zone.
Key Levels:
🔹 Entry (Sell Zone): Around $2,879 - $2,880
🔹 Stop Loss: Above $2,885 (to avoid stop hunts)
🔹 Take Profit Targets:
TP1: $2,800 (First major support)
TP2: $2,740 (Extended move)
TP3: $2,726 (Final support level)
Technical Confluences:
✅ The pattern has completed at D, which aligns with a strong historical resistance level.
✅ Fibonacci ratios confirm harmonic structure, with XA, AB, BC, and CD waves respecting key retracement and extension levels.
✅ Bearish divergence on RSI/MACD (if applicable), suggesting weakening momentum.
✅ Price action near D shows potential rejection wicks, hinting at selling pressure.
Trade Execution Strategy:
🔸 Entry Method: Wait for a rejection candle or bearish confirmation (e.g., engulfing or pin bar).
🔸 Risk-Reward Ratio: Approx. 1:3, making this a high-probability setup.
🔸 Trailing Stop: Move stop loss to breakeven once price reaches TP1.
🚨 Disclaimer: This is not financial advice. Always manage risk and trade responsibly! 🚨

Short Scalp trade Short scalp trade for gold for 5 min time frame So you can take A scalp trade for 1-2 hour And Don't hold this trade for long time because gold is bullish and this is profit booking

Gold : Need a reset ?Gold price is testing the daily resistance (R1) and price did not breakout this pivot resistance on daily ,we have seen a massive bull run on gold so we can consider following case for short to mid term from here :
Short-Term : there's a likelihood of a short-term pullback or consolidation (Don't take this as a sell call from me , I am still holding all my buy trades and will add on pullback). This would be a healthy (Yes and this will be a normal correction if it happen) move after a strong uptrend, allowing the market to digest gains . Watch for support at the green trendline and at the previous ATH.
Mid-Term: The strong volume during this uptrend suggests that there's still significant interest in buying gold ,so overall market structure and trend is bullish and we can re-buy from lower levels after a good confirmation.

Gold at $2906: What Next?Gold has made a new All Time High at $2906
and the market is likely to pause uptrend and
initiate a retracement towards support zone
2888 followed by 2875-2870
Next support may come at 2855-2850
Break above 2906 may extend bullish advance towards 2920

XAUUSD/GOLD WEEKLY SELL PROJECTION 09.02.25When central banks announce a rise in interest rates, the price of gold generally falls. There are two reasons for this: When interest rates rise, government bonds pick up again, attracting investors looking for a safe, long-term investment.

Gold price rises as trade war tensions remain elevatedGold continued its upward trend on Friday as the trade war between the U.S. and China escalated and the U.S. jobs report presented mixed signals. XAU/USD is currently trading at $2,862, up 0.24%.
U.S. President Donald Trump's statement regarding the plan to impose retaliatory tariffs on several countries next week provided a positive boost to the gold market. Specifically, this escalation in tensions pushed gold prices higher as the precious metal remains seen as a safe-haven asset. With solid support at 2,841, the bullish momentum for gold has been reinforced. If gold surpasses the resistance at 2,880 and conquers the 2,900-dollar mark, the next key resistance will be the psychological level of 2,950, followed by 3,000 dollars.
With this positive outlook, investors are expecting gold to maintain its upward trend in the short term. However, if gold fails to hold above the 2,841 support and reverses lower, the next support level will be at 2,800 dollars, where a slight pullback may occur before determining the next direction.

2025 FEB GOLD WEEKLY2025 FEB GOLD WEEKLY
this is my long term perspective about gold bas on NDS trading strategy. HOpe it help
Commodity analysts who make long-term forecasts believe that the price of gold will generally keep rising in the next few decades as the demand for the precious metal increases.
