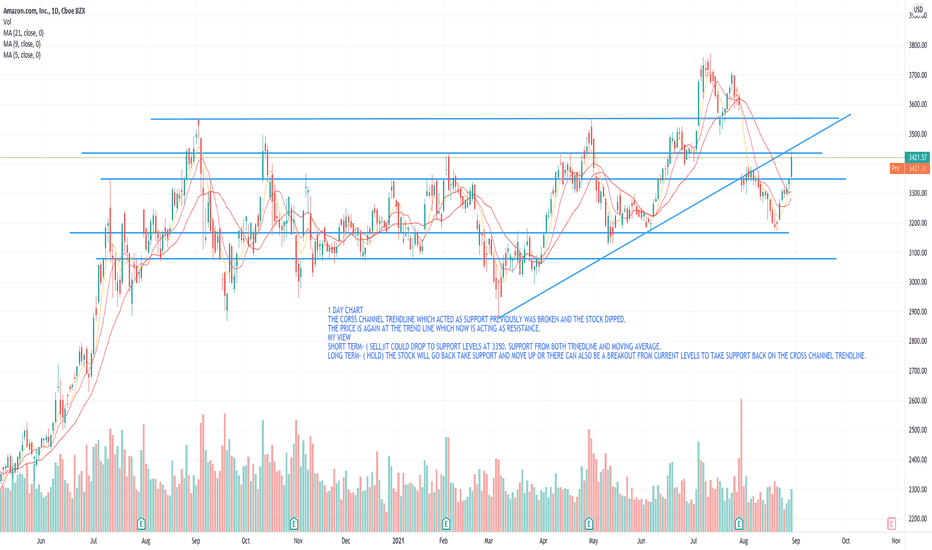
1 DAY CHART The cross channel trendline which acted as support previously was broken and the stock dipped. The price has reached the cross channel again which can now act as resistance for a few days. My view Short term- (Sell) it can drop down to support levels back at 3350. Support from both moving averages and trendlines. Long-term= (hold) as it is a Jan ce. It...
the airline's industry will definitely boom! especially low cost airlines like SW. technicals stock is consolidating and is in a good entry phase with a good RRR. good buy for long term and short term trade. mentioned the entry, exit and SL levels on the chart.
ideally to go long if 9 MA is above 21 day MA & 200MA.
This is a good indication of where the stock is taking support and respecting the resistance points. One can go long or short at these signal.


