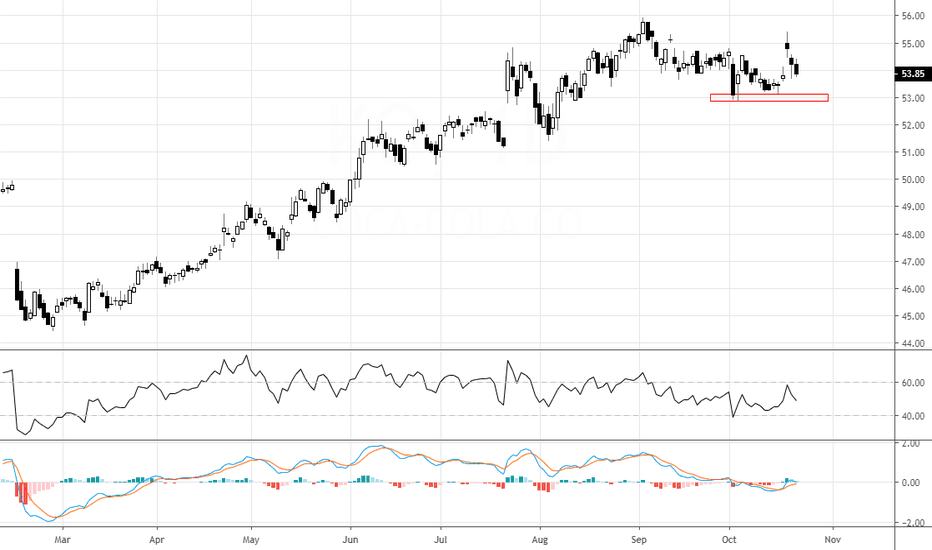
The stock seems to be into a corrective pullback. The RSI is halted near 60 levels and curled down. The correction may take the shape of ABC pattern. Breaking of the upward sloping channel will confirm the pattern.
The stock is in a dominant trend up. Recently a lower high and lower low price pattern has been noticed on the daily charts. The RSI also seems to have shifted the range from bullish 80-40 zones to neutral 60-40 zones in the past few weeks. Important support levels are marked on the charts. Breaking them may result into corrections. The degree of the corrections...
The stock is trading at a very crucial juncture. The RSI is indicating a sideways trend, important support pivot level is 8.75, below this point the stock may falter and selling may set in as the stock may start to move down in A-B-C pattern. On the flip side a good close above 9.30 may change the course of the trend GE may start trending up. For greater insight...
American Express may face hard time here. The RSI is not displaying any bullish zeal, the bear engulfing candle at RSI FLARE levels further confirms bears have a upper hand here. The MACD isn’t able to pull into the bullish area. In short the stock is set for a further dip. 111 & 109 seems prominent as of now. For more information on how to use RSI professionally...
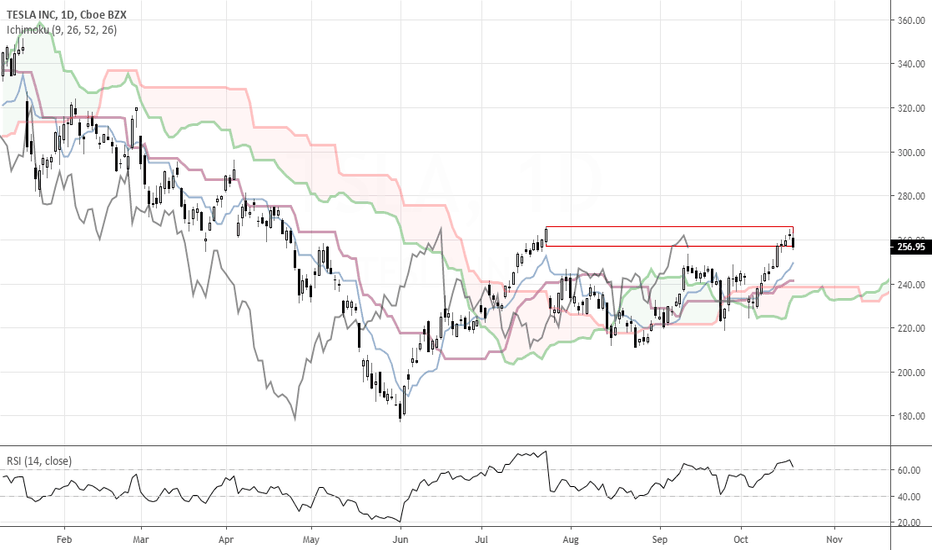
The trend seems to be up now. The prices are making higher highs, prices are trading well above the kumo, the chikou is free. The prices are expected to retrace back to kijun at 241 - 242 levels. The RSI will be into buy mode. Looking at the price action, if the stock holds the levels, entries can be planned. The expected target are 301 - 317. While a close below...


