DinyarNavroze
The present trend seems to be bearish according to Elliot waves and the Target of wave 5 downwords is calculated according to fibonacci levels
On daily chart, it has had a 5 Elliot Waves. If the present prices move above 600 then it's likely to pick up from there as wave 3.
Gujarat Gas Fibonacci Levels Buying confluence of .382 and .618
Buy sell and Stop-loss according to Trough & High Rules
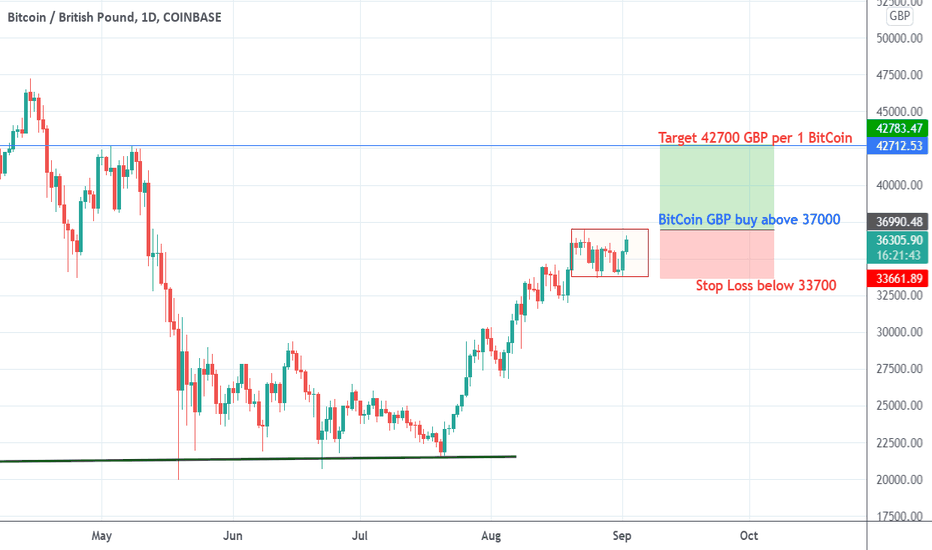
Any script chart based on mass psychology responds to technical analysis. Here we see Fibonacci Concluence Area (Retracement & Expansion) for BitCoin / USD
Nifty on Steroids... In such gloomy days why is the market going up? What is in store for the small retail traders? For investment one has to do fundamental analysis. But, for making a living out of trading one has to follow the trend blindly. Whatever be the cause of the markets going up just now, whether it be an act of manipulators or anyone, we need to ride on...
Nifty is at a crucial 0.618 retracement Let us see if it respects this level or it breaks this level.
If Nifty breaks the 12th June low of 9544 then it'll be either an ABC wave pattern or wave 3 beginning. In such gloomy times how the market is going up cannot have a simple reason. Therefore I don't want to say whether bears would be in control or Bulls. Rather wait and watch. To give a reason behind market movements is not the job of technical analysis traders....
Markets trending upwards
If wave 4 high is breached it'll be a wave 5 failure. Then we can look forward to a good upawards rally in Nifty provided it crosses 10500 levels.
Please read the chart analysis on the chart itself.
Fibonacci Agreement Point between 58 to 60. This will be a good resistance level.
Please see the text on the chart.
The Fibonacci weekly retracement levels are at 0.5 On the daily chart the 1.2 fibonacci expansion is in confluence with the 0.5 retracement. In my opinion the present rally might be over and the prices might retrace from thereon i.e. 500
Is the V shaped recovery on charts a 'FAKE' Rally? Markets can stay irrational longer than you can stay solvent. As we see record unemployment numbers in the world, with economies all around the world locked down, with all signs pointing towards a long period of economic uncertainty for businesses due to the COV19 situation... Some indices and scripts continued...
Titan has crossed DiNapoli MACD and has probably began its 5th wave downward with a DiNapoli Agreement point at 710 +- levels.
Reliance is at a good resistance levels with the previous high and 1.0 expansion levels. Resistance is not a prediction but an indicator as to the prices would either revert down from these levels or would thrust upside. MOB = Make or Break


