On the hourly scale, BTSUSDT just decided to go all-in with the bullishness: -Volatility Contraction -Ascending Triangle -Head and Shoulder -Symmetrical Triangle
Breakout from Ascending triangle pattern with higher volume. The volume has been contracting throughout the pattern formation and the breakout from the pattern has been confirmed by higher volume. Can be a good, high probability positional trade.
Breakout of Bullish rectangle might give a long opportunity in CIPLA.
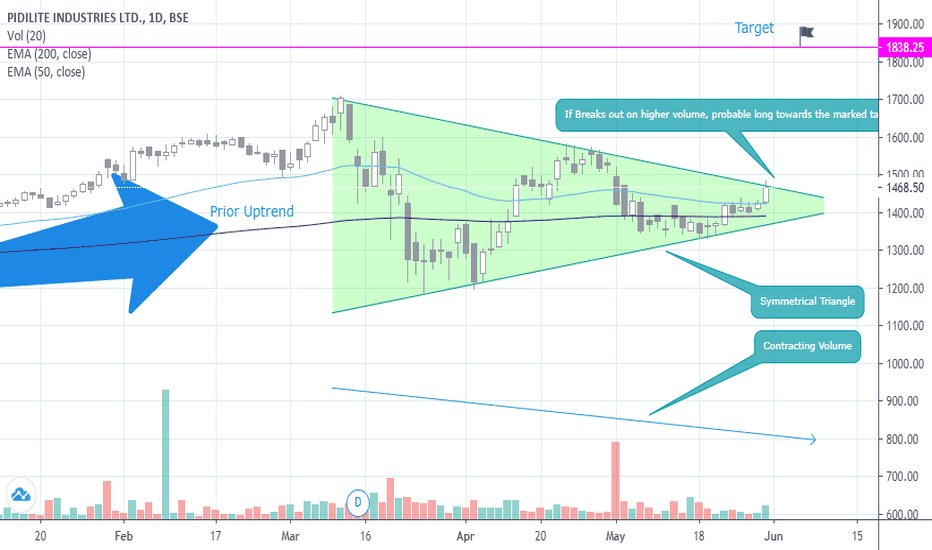
Cab be a good long opportunity considering the prior uptrend, contracting volume during the formation and the price respecting the symmetrical triangle boundaries religiously. One of the apprehensions with this chart is that the price seems to have gone too deep into the apex of the triangle, which negates the view. Further, If it so happens, that the breakout is...
Short Entry possible after the chart breaks the short term trend line. Note that the chart is at the resistance zone after breakout from the neckline of the Head and Shoulder pattern.


