RSI divergence observed in the chart. It's purely RSI trade. So if it fits into your trade plan take your trade. Sell near to 1480-1483 Target 1440 Stoploss 1488. And also note that double top observed.
Buy above 1189 Target 1217 Stoploss 1172 Sell Below 1150 Target 1125 Stoploss 1167 Upside breakout targets are big till 1325
Buy Above 912 Target 1000+ Stoploss 880 After buy 920 will be an another hurdle.
It has been observed that BHARATFIN have broken the uptrending Channel, Short Below 767.5 Stoploss 777.5 Target 747
RSI Divergence Have been observed in INDUSINDBANK, and also Fin Resistance at 1.272. Short @ CMP 1574. Target 1539 Stoploss 1588.5 Below 1563 will have free fall,
Levels are in chart. Follow Levels accordingly
Long: Buy above 1090 Buy Target 1128 Stop 1073 Short: Short Below 1060 Sell Target 1032 Stop 1075
Description on Chart. Buy at CMP AND Follow levels
Initiate Long Position above 2360. Stoploss - 2333 (Hourly Candle Close) or 2318 Spot Target 1 - 2386 Target 2 - 2410 Target 3 - 2446 Always keep booking the profit in appropriate and trail your stops. Already Daily close is broken above the trendline so I'm Not afraid of Long, but however I dont want to ignore this also, If trendline broken in downside then...
Falling wedge is observed in Tatamotors, All details are in chart
Above 1800 Looking for 1840, 1880. Downside safe at 1785
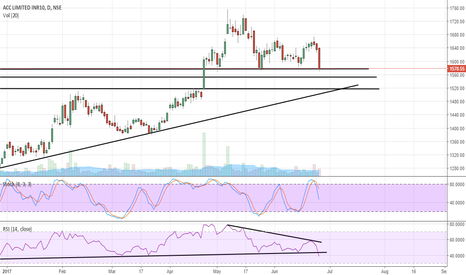
ACC had the multiple support at 1570, Breaking 1570 will take the price towards 1530 1500. Stoploss can be maintained at 1590.
There were two possible trades, Daily chart and hourly chart are showing two different game plans, yes Daily close is above the trendline but hourly close is below the trend line with a possible divergence. Eicher motor have taken support on trendline (on daily chart) and also Recent Low will act as support. If the previous low of 27021 taken down then can have a...
Its been observed that Below 777 SUNTV will break the trend line. Enter Below 777 Stoploss 785 Target 769, 764, 753, 741
Watch out for the blue line after breaking downward trendline if resistance at 288 broken then will fly stright to 300 In case of failing to break resistance line at 288 will fall back to triangle and will reach the supportline. In this case short will be activated below 279 for the target of 270-272
It was observed that Asianpaint Breaking Trendline and price may fall to 1045 then towards 1039. Maintain Red line as stop.
Plan 1: TCS is leaking from the Channel.. Sell below 2465 for the target of 2400 Stoploss 2480. Plan 2: Buy above 2482 with the stoploss 2465 for the target of 2539 & 2577
Sell Below 384.25 Stoploss 387.25 Target 379


