PIYUSHCHAVDA
PlusUgro Capital cmp 180.50 by the Weekly Chart view since listed - Support Zone 161 to 172 Price Band - Resistance Zone 194 to 205 Price Band - Bullish Rounding Bottom 1st done and 2nd in completion stage - Resistance Zone neckline will be a decent hurdle to cross for fresh breakout - Volumes surging heavily by demand based buying and well above avg traded...
Bansal Wire Inds cmp 405.65 by Daily Chart since listed - Support Zone 380 to 388 Price Band - Resistance Zone 418 to 426 Price Band - Very considerate VCP Pattern formed on the chart - VCP pattern is within Bullish Rising Parallel Price Channel - Support Zone tested, retested and Breakout seems well sustained - Falling Resistance Trendline Breakout too yet...
Krystal Integrated cmp 655.50 by Daily Chart view since listed - Support Zone 600 to 630 Price Band - Resistance Zone 685 to 715 Price Band - Support Zone tested, retested and broken out, was resistance earlier - Volumes are flat, need to increase for the Resistance Zone neckline crossover - Most common Technical Indicators are seen to be turning out with...
Amber Enterprises cmp 7466.50 by Daily Chart view - Resistance Zone 7825 to 7925 Price Band - Support Zone 7250 to 7400 Price Band maybe tested again - Falling Resistance Trendline might be tested prior to upside reversal - Volumes are synced with avg traded quantity but faced selling pressure on Friday - Breakout was done by supportive Bullish Rounding Bottoms...
Mankind Pharma cmp 2578.30 by a Weekly Chart view since listed - Support Zone 2400 to 2500 Price Band - Resistance Zone 2675 to 2785 Price Band - Symmetrical Triangle Breakout well sustained - Back to back Bullish Rounding Bottom with Resistance Zone neckline - Most common Technical Indicators BB, EMA, SAR, MACD, RSI turning positive - Good Volumes increase,...
Bank Nifty spot 56754.70 by Daily Chart view - Weekly update - Resistance only at Bank Nifty ATH Level 57628.40 - Support Zone 59550 to 56285 of Bank Nifty Index - *Rising Support Channel seems well respected, just as yet* - Next Support Zone 55050 to 55450 of Bank Nifty Index Levels - Support Zone might be tested retested, if not for a breakdown for Bank Nifty Index
Nifty 50 spot 25149.85 by the Daily Chart view - Weekly update - Support Zone 24900 to 25100 Price Band, yet sustained - Next Support Zone seen at 24325 to 24500 of the Nifty Index - Resistance Zone 25860 to 26035 then ATH 26277.35 of Nifty Index levels - Rising Price Channel Breakdown indicates probable weakness to see following - Falling Resistance Trendline...
Acutaas Chemicals cmp 1146.40 by Daily Chart view - Support Zone 1020 to 1080 Price Band - Resistance Zone 1180 to 1250 Price Band - Technical Indicators BB, EMA, MACD, RSI trending bit positively - Probable Symmetrical Triangle Pattern Breakout or Breakdown ???? - Volumes seem to be going in close sync with the average traded quantity
Mufin Green Finance cmp 93.85 by Daily Chart View - Support Zone 84.50 to 89.50 Price Band - Resistance Zone seen at 96 to 102 Price Band - Back to Back Bullish Rounding Bottoms around Support Zone - Price Breakout above Support Zone with good Volumes by demand based buying
Indo Rama Synthetics cmp 51.89 by Weekly Chart view - Support Zone 44 to 48 Price Band - Resistance Zone 57 to 61 Price Band - Bullish Rounding Bottoms formed around Resistance Zone - Volumes increase needed for upside Price movement continuity - *Falling Parallel Price Channel Breakout to Rising Parallel Price Channel*
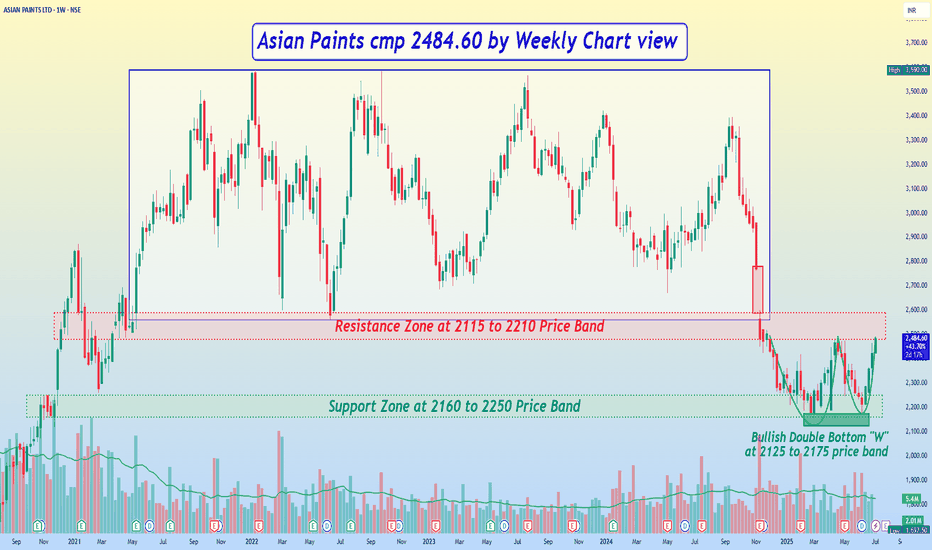
*Asian Paints cmp 2484.60 by Weekly Chart view* - Support Zone at 2160 to 2250 Price Band - Resistance Zone at 2115 to 2210 Price Band - Bullish Double Bottom "W" near Support Zone around the 2125 to 2175 price band - Gap Down Opening of 11-Nov-2024 to act as a hurdle and will get closure only during next upside - Stock had been trading within...
*Schaeffler India cmp 4201.90 by Daily Chart view* - Support Zone 3725 to 3895 Price Band - Resistance Zone 4275 to 4450 Price Band - Volume surge today by demand based buying - Bullish Head and Shoulders by a Resistance Zone neckline followed by the Bullish Rounding Bottom completion stage - *Subject to Price crosses Resistance Zone and sustains closure for few...
KRN Heat Exchange cmp 933.40 by the Daily Chart view since listed - Support Zone 860 to 895 Price Band - Resistance Zone 955 to ATH 1012 Price Band - Very Strong Support Base has formed at 680 to 700 Price Level - Heavy Volumes surge yesterday by demand based buying on the stock counter - Bullish Rounding Bottom in completion stage with Triple Bottom at Strong...
BASF India cmp 5157 by Daily Chart view - Support Zone 4915 to 5100 Price Band - Resistance Zone 5400 to 5585 Price Band - Stock Price is in the process of Support Zone testing retesting - Falling Resistance Trendline Breakout yet seems to be tested out - Rising Support Trendline seems well respected and price well above it - Bullish Head & Shoulder followed by...
Northern Arc Capital cmp 257.05 by Daily Chart view since listed - Support Zone 230 to 242 Price Band - Resistance Zone 260 to 272 Price Band - Bullish Head & Shoulders with Support Zone Neckline - Bullish Rounding Bottoms made after H&S around Support Zone Neckline - Volumes have surged heavily over past few days and above avg traded quantity
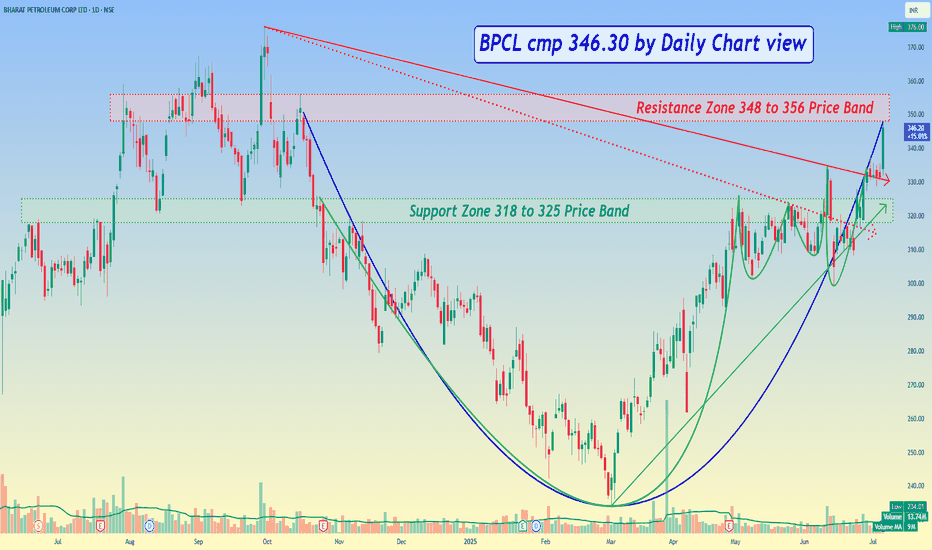
BPCL cmp 346.30 by Daily Chart view - Support Zone 318 to 325 Price Band - Resistance Zone 348 to 356 Price Band - Strong Bullish Technical Chart Setup indicative of good upside once price crossover and sustains closure above Resistance Zone
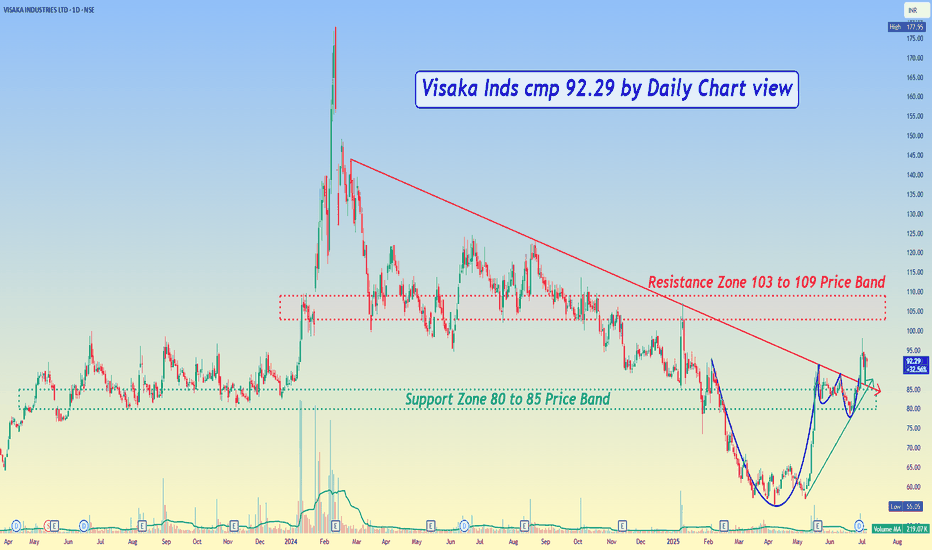
Visaka Inds cmp 92.29 by Daily Chart view - Support Zone 80 to 85 Price Band - Resistance Zone 103 to 109 Price Band - Falling Resistance Trendline Breakout well sustained - Volumes are gradually rising with intermittently huge spikes - Bullish Cup & Handle followed up by a tiny Rounding Bottom pattern - Support Zone was tested and retested and price closure is...
Bafna Pharma cmp 89.21 by Weekly Chart view - Support Zone 69 to 77 Price Band - Resistance Zone 97 to 106 Price Band - Falling Resistance Trendline Breakout by Volumes surge last week - Darvas Box Breakout seems done from ATL 69 to 88 Trading Price Range - Most used Technical Indicators of BB, EMA, MACD, RSI, SAR turning positive


