PIYUSHCHAVDA
PlusNifty 50 spot 25461 by Daily Chart view - Weekly update - Support Zone 24900 to 25100 of Nifty Index - Next Support Zone 24325 to 24500 of Nifty Index - Resistance Zone 25860 to 26035 then ATH 26277.35 of Nifty Index levels - Nifty Index retraced by unwarranted events and to a good extent by profit booking - Nifty Index is shying away to sustain any upside...
Bank Nifty spot 57031.90 by Daily Chart view - Weekly Update - Resistance only at Bank Nifty ATH Level 57628.40 - Support Zone 559550 to 56285 of Bank Nifty Index - Next Support Zone 55050 to 55450 of Bank Nifty Index Levels - Bank Nifty Index retraced from New ATH by unwarranted events and usual profit booking
MRPL cmp 150.87 by Daily Chart view- Updated review - Support Zone at 126 to 133 Price Band respected - Resistance Zone at 151 to 158 Price Band remains sustained - Bullish Head and Shoulders pattern completed along with the VCP pattern too is done - Stock seems getting ready for Resistance Zone Breakout and create a fresh upside momentum - Earlier review for...
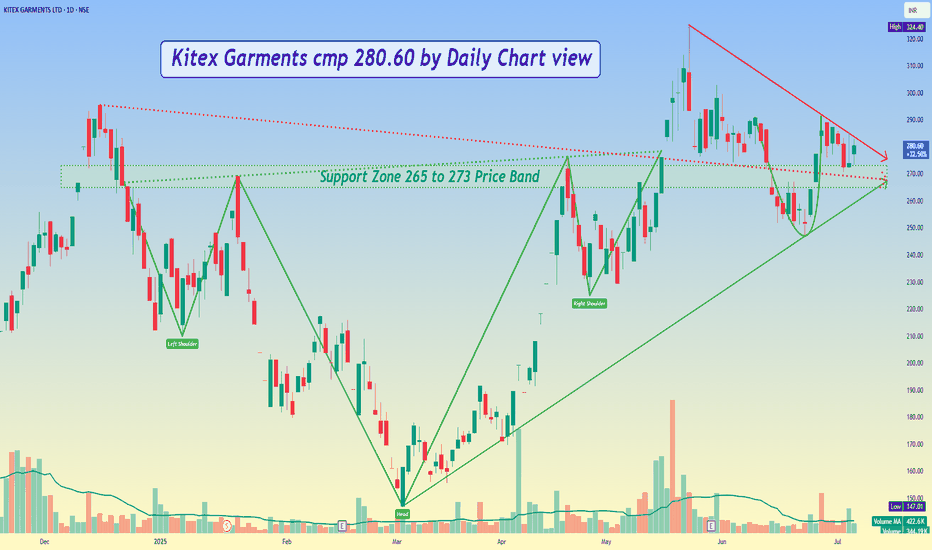
Kitex Garments cmp 280.60 by Daily Chart view - Support Zone 265 to 273 Price Band - Resistance Zone 287 to 294 Price Band - Bullish Head & Shoulders formed with Support Zone neckline - Volumes seen spiking up at regular intervals above avg traded quantity - Support Zone been tested retested over past few days, anticipating upside breakout - Rising Support...
Vaswani Inds cmp 51 by Daily Chart view - Support Zone 42 to 44 Price Band - Resistance Zone 54.75 to 56.75 Price Band - *Falling Parallel Price Channel Breakout done today* - Bullish Rounding Bottoms with considerate VCP pattern too - Heavy Volumes surge today way above average traded quantity - *Gap Up Opening would need to be filled in and closed sooner or...
Apex Frozen Foods cmp 248 by Weekly Chart view since listed - Support Zone 185 to 210 Price Band - Resistance Zone 185 to 210 Price Band - Volumes increase needed to breakout above Resistance Zone - 2nd Falling Resistance Trendline Breakout attempts expected soon - 1st Falling Resistance Trendline from ATH, Breakout attempts work in progress - Rising Support...
Ceigall India cmp 268 by Daily Chart view - Support Zone ATL 235.95 to 243 Price Band - Resistance Zone seen at 284 to 294 Price Band - Darvas Box : Trading Price Range Breakout Attempted - Multiple Bullish Rounding Bottoms formed inside Darvas Box - Volumes spiked heavily in past few days and above avg traded quantity but retraced from Resistance Zone - *A...
GMDC cmp 420.35 by Daily Chart view - Support Zone 385 to 398 Price Band - Resistance Zone 433 to 448 Price Band - Falling Price Channel to Rising Price Channel transition - Volumes are in good sync with average traded quantity - Double Head and Shoulders inclusive of Bullish Rounding Bottom - Support Zone was tested retested and now attempts to crossover Resistance Zone
*PI Inds cmp 4154.30 by Weekly Chart view* - Support Zone 3925 to 4050 Price Band - Resistance Zone 4475 to 4575 Price Band - Bullish Rounding Bottom done above Support Zone - Falling Resistance Trendline Breakout awaited to happen - Support Zone been tested and retested for upside reversal - Technical Indicators EMA, MACD, RSI, BB seem turning positive
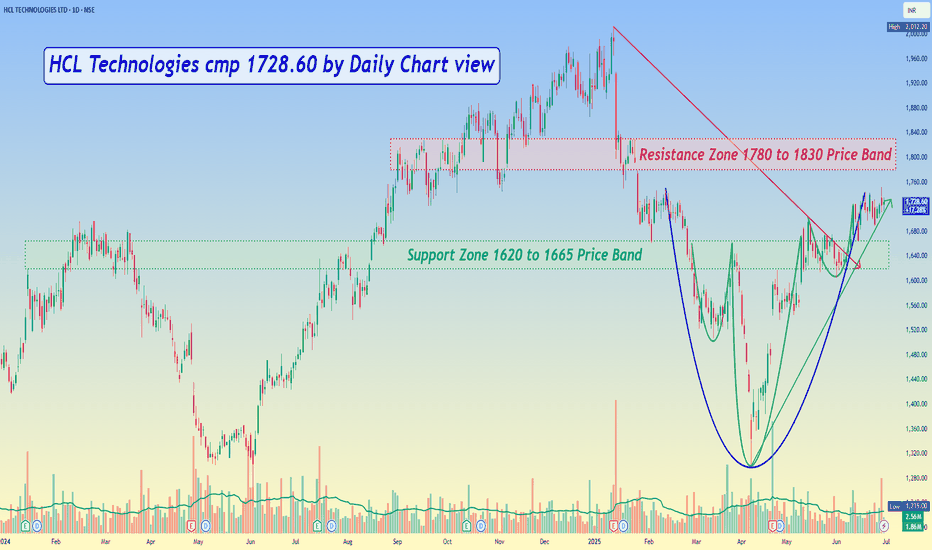
HCL Technologies cmp 1728.60 by Daily Chart view - Support Zone 1620 to 1665 Price Band - Resistance Zone 1780 to 1830 Price Band - Bullish Rounding Bottom and faintly considerate Head & Shoulder too - Volumes have been spiking regularly well above the average traded quantity over past few weeks
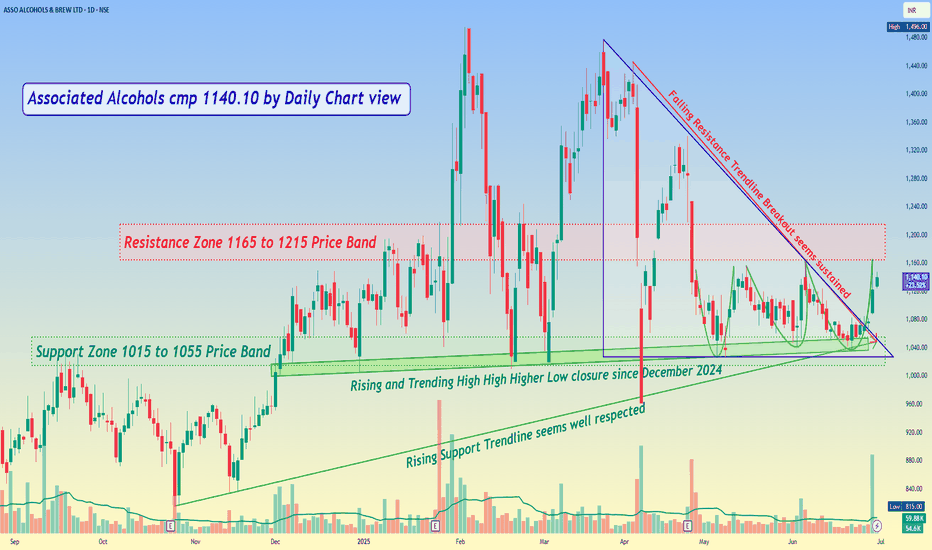
*Associated Alcohols cmp 1140.10 by Daily Chart view* - Support Zone 1015 to 1055 Price Band - Resistance Zone 1165 to 1215 Price Band - Rising Support Trendline seems well respected - Falling Resistance Trendline Breakout seems sustained - Rising and Trending High High Higher Low closure since December 2024 - Descending Triangle Breakout seems well sustained by...
Kronox Lab Science cmp 192.50 by Daily Chart view since listed * Support Zone 178 to 187 Price Band * Resistance Zone 204 to 215 Price Band * Volumes are in good sync with avg traded quantity * Gap Up Opening will need to be closed sooner or later * Rounding Bottom with Cup & Handle by Support Zone neckline * Falling Resistance Trendline Breakout has been...
*Hindustan Copper cmp 276.15 by Weekly Chart view* - Support Zone 250 to 262 Price Band - Resistance Zone 325 to 337 Price Band - All major Technical indicators BB, EMA, MACD, RSI trending positively - Stock is seen trending with positive momentum on Daily and Weekly Charts - Rising Support Trendline respected with Falling Resistance Trendline Breakout - ...
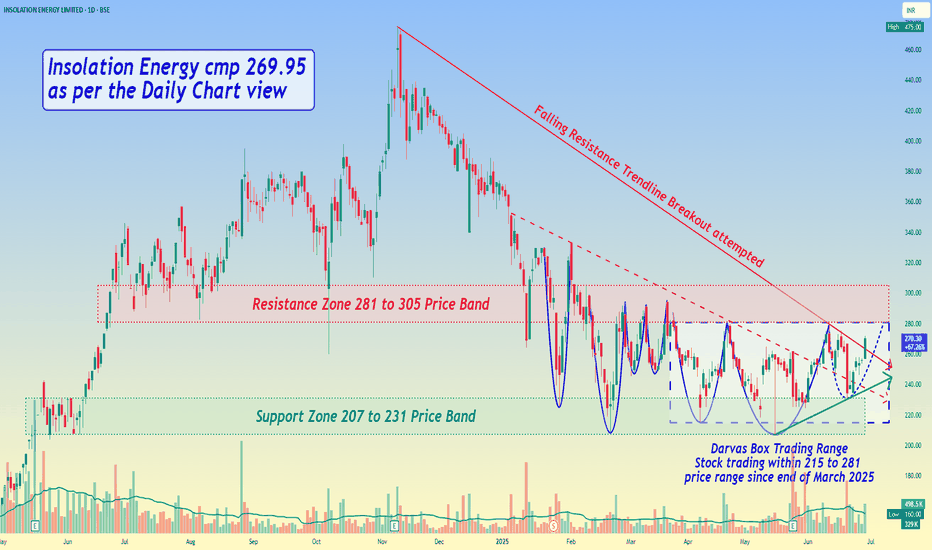
*Insolation Energy cmp 269.95 as per the Daily Chart view* - Support Zone 207 to 231 Price Band - Resistance Zone 281 to 305 Price Band - 1st Falling Resistance Trendline Breakout done - 2nd Falling Resistance Trendline Breakout is been attempted - Technical indicators of EMA, BB, MACD, RSI are seen on the positive trend - Darvas Box : Stock Price trading within...
*City Union Bank cmp 205.81 by Weekly Chart view* - Support Zone 180 to 190 Price Band - Resistance Zone 206 to 218 Price Band - Falling Resistance Trendline Breakout well sustained - Technical Indicators of EMA, MACD, RSI on positive trend - Repeated Bullish Rounding Bottoms with considerate Cup & Handle - *Resistance Zone neckline acting as good hurdle to...
*Senores Pharma cmp 568.20 by Daily Chart view since listed* - Support Zone at 552 to 567 Price Band - Resistance Zone at 555 to 565 Price Band - Falling Resistance Trendline Breakout well sustained - Volumes are in good sync with the avg traded quantity - Rising Support Trendline respected by upside momentum - Back to Back Rounding Bottoms converging into VCP...
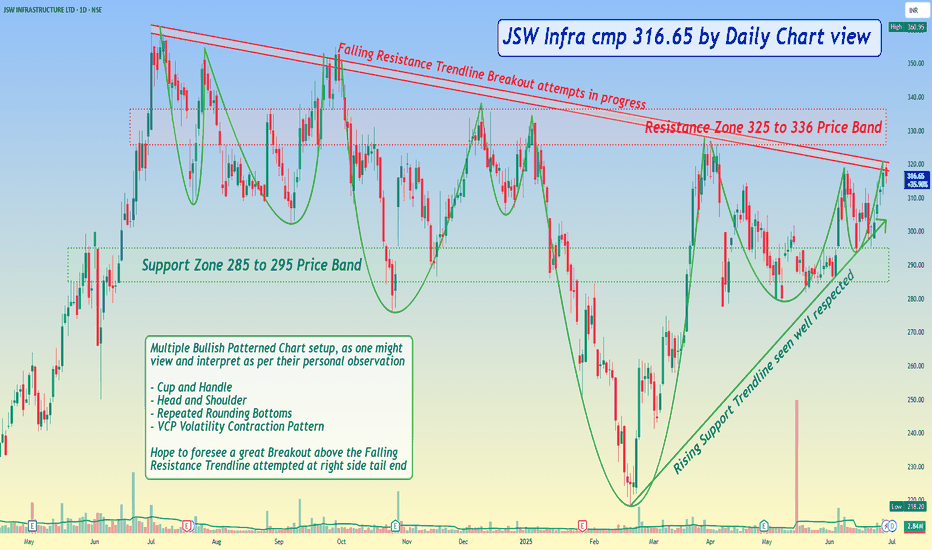
*JSW Infra cmp 316.65 by Daily Chart view* - Support Zone 285 to 295 Price Band - Resistance Zone 325 to 336 Price Band - Rising Support Trendline seen well respected - Falling Resistance Trendline Breakout attempts in progress - [ b]Multiple Bullish Patterned Chart setup, as one might view and interpret as per their personal observation - Cup and Handle -...
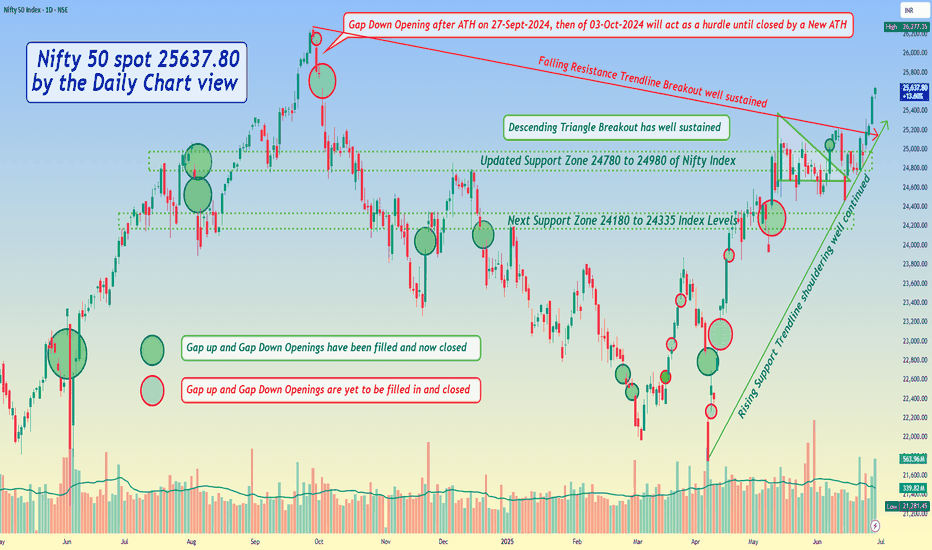
*Nifty 50 spot 25637.80 by the Daily Chart view - Weekly update* - Descending Triangle Breakout has well sustained - Immediate Support Zone 25125 to 25335 of Nifty Index - Next updated Support Zone 24780 to 24980 of Nifty Index - And then next Support Zone 24180 to 24335 of Nifty Index Levels - Resistance Zone seen at 25860 to 26035 and then ATH 26277.35 of...


