PIYUSHCHAVDA
Plus*Bank Nifty spot 57443.90 by Daily Chart view - Weekly update* - Resistance only at Bank Nifty ATH Level 57475.40 - Active Support Zone 55450 to 55950 of Bank Nifty Index - Rising Support Trendlines back in supportive role has sustained - Next decent Support Zone at 54225 to 54575 of Bank Nifty Index Levels - Bullish Rounding Bottom below ATH indicatives more...
Wheels India cmp 789 by Daily Chart view - Support Zone 730 to 750 Price Band - Resistance Zone 730 to 750 Price Band - Bullish chart setup indicative of good upside subject to Resistance Zone Breakout happens and sustains
*Automotive Stampings cmp 585 by Weekly Chart view* - Support Zone 515 to 555 Price Band - Resistance Zone 685 to 730 Price Band - Stock Price testing retesting the Support Zone - Volumes are supportive of probable upside momentum - Rising Support Trendline going steady by the price momentum - Falling Resistance Trendline Breakout too seem as well sustained
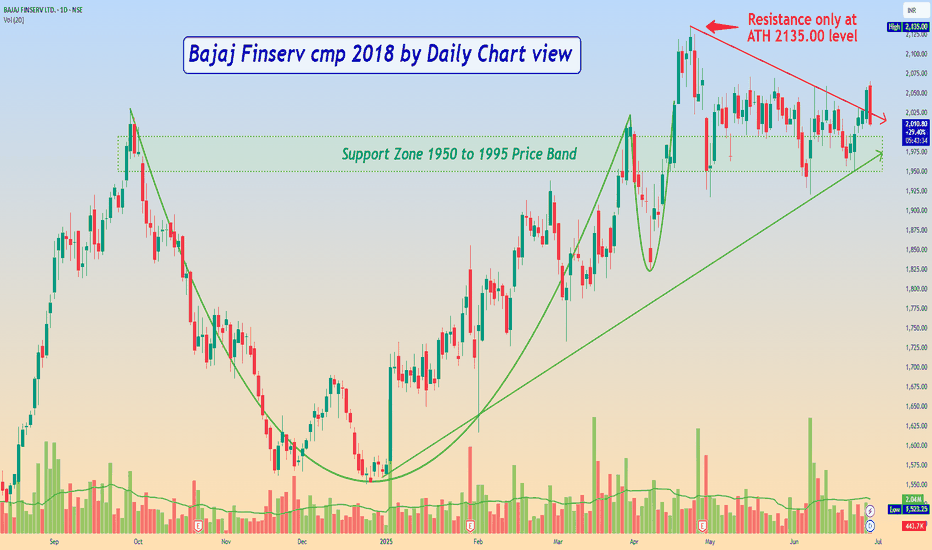
Bajaj Finserv cmp 2018 by Daily Chart view - Support Zone 1950 to 1995 Price Band - Resistance only at the ATH 2135.00 level - Falling Resistance Trendline Breakout seems sustained
*CESC cmp 173.19 by Daily Chart view* - Support Zone 155 to 161 Price Band - Resistance Zone 155 to 161 Price Band - Bullish Double Bottom at 161 Price Level - Rising Support Trendline seems actively sustained - Volumes spiking seen in sync with the avg traded quantity - Double Falling Resistance Trendlines Breakout been attempted - Bullish Cup & Handle with...
*MMP Industries cmp 267.85 by Weekly Chart view* - Support Zone 225 to 248 Price Band - Resistance Zone 225 to 248 Price Band - Rising Support Trendline well respected - Descending Triangle Breakout well sustained - Volume seen in close sync with avg traded quantity - Technical indicators EMA, MACD, RSI, BB turning positive
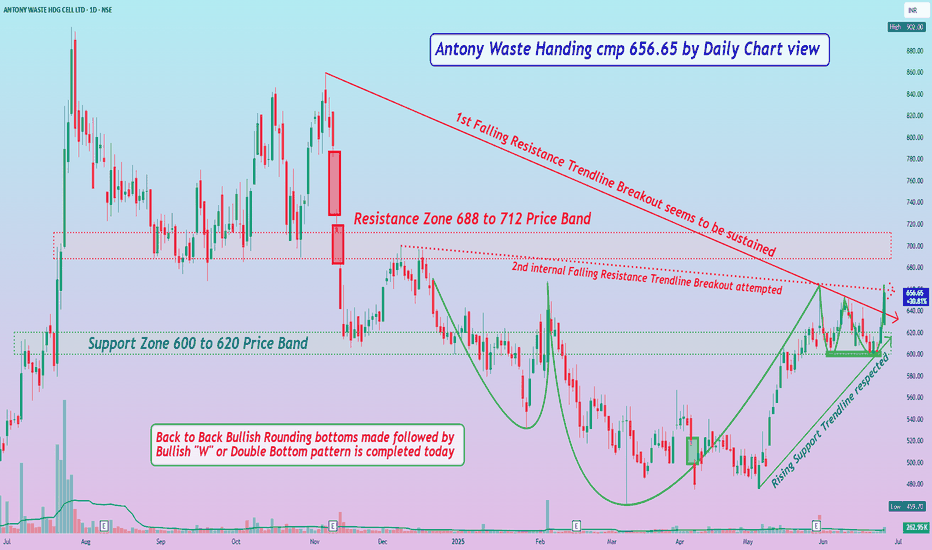
*Antony Waste Handing cmp 656.65 by Daily Chart view* - Support Zone 600 to 620 Price Band - Resistance Zone 688 to 712 Price Band - Rising Support Trendline seems respected - 1st Falling Resistance Trendline Breakout seems sustained - 2nd internal Falling Resistance Trendline Breakout attempted - Bullish Double Bottom has been made at the 598 to 602 Price Band...
Granules India cmp 495 by the Daily Chart view * Support Zone 453 to 475 Price Band * Resistance Zone 523 to 545 Price Band * Stock Price seems riding along Rising Support Trendline * Stock Price Breakout from Falling Resistance Trendline and Resistance Zone awaited * Stock has been attempting Breakout above Resistance Zone couple of times in June 2025 but has...
*Time Technoplast cmp 453.30 by the Daily Chart view* - Support Zone 396 to 408 Price Band - Resistance Zone at 445 to 460 Price Band - Price shouldering along the Rising Support Trendline - Volume are coming in close sync with average traded quantity - Price attempting breakout from Falling Resistance Trendline and Resistance Zone - *Bullish Rounding Bottom...
*Aadhar Housing Finance cmp 442.90 by Daily Chart view since listed* - Support Zone 419 to 432 Price Band - Resistance Zone 464 to 479 Price Band - Rising Support Trendline seems been respected - Hurdles of Falling Resistance Trendline and Resistance Zone - Volumes are pretty flat, need to increase for fresh upside momentum - Multiple Bullish Rounding Bottoms...
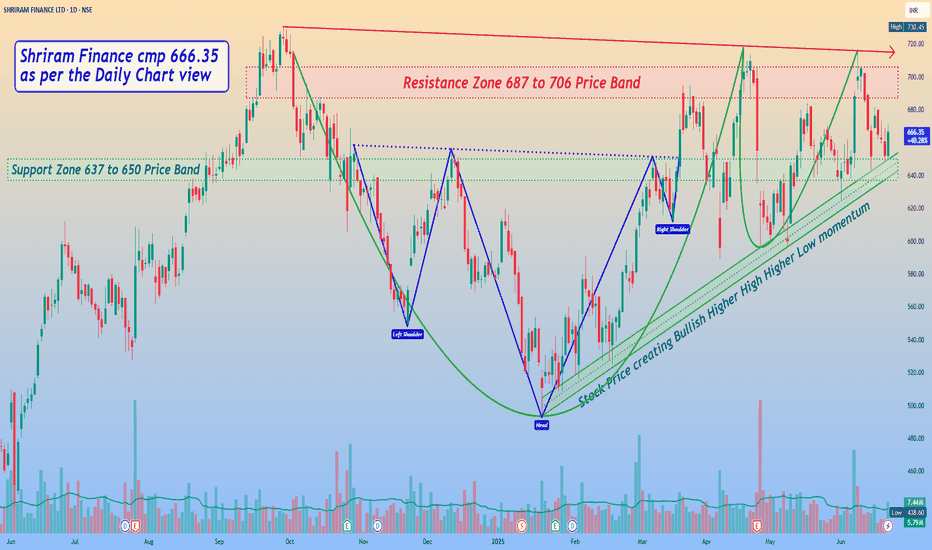
*Shriram Finance cmp 666.35 by Daily Chart view* - Support Zone 637 to 650 Price Band - Resistance Zone 687 to 706 Price Band - *Stock Price creating Bullish Higher High Higher Low momentum* - Volumes are seen to be in good sync with average traded quantity - *Price seems testing and retesting the Support Zone over last week* - Stock made few failed attempts...
*Endurance Techno cmp 2576 by Daily Chart view* - Support Zone 2315 to 2405 Price Band - Resistance Zone 2650 to 2750 Price Band - Falling Resistance Trendline and Resistance Zone Breakout seems attempted - Support Zone got tested and retested well before taking an upside momentum - Stock hit ATH 3061.30, nosedived by profit booking selling for a long downtrend -...
*Tata Consumer cmp 1100.20 by Daily Chart view* - Support Zone 1036 to 1070 Price Band - Resistance Zone 1148 to 1180 Price Band - Support Zone under testing retesting over past week - Volumes surged heavily over the last 2 days of the week - *Technical Indicators for EMA, MACD and RSI getting to positive mode*
*Nifty 50 spot 25112.40 by Daily Chart view - Weekly update* - Active Support Zone 24675 to 24780 of Nifty Index - Next Support Zone 24180 to 24335 of Nifty Index Levels - Resistance Zone seen at 25200 to 25335 of Nifty 50 Index Levels - Descending Triangle Breakout seen back in action after a robust recovery occurrence - *Rising Support Trendline seems to have...
*Nifty 50 spot 24112.40 by Daily Chart view - Weekly update* - Active Support Zone 24675 to 24780 of Nifty Index - Next Support Zone 24180 to 24335 of Nifty Index Levels - Resistance Zone seen at 25200 to 25335 of Nifty 50 Index Levels - Descending Triangle Breakout seen back in action after a robust recovery occurrence - *Rising Support Trendline seems to have...
*Bank Nifty spot 56252.85 by Daily Chart view - Weekly update* - Active Support Zone 55150 to 55500 of Bank Nifty Index - Rising Support Trendlines back in action of supportive roleplay - Falling Resistance Trendline Breakout sustained by Friday closure - Resistance Zone 56475 to 56700 then Bank Nifty ATH Level 57049.50 - Next decent Support Zone at 54225 to...
*Swiggy cmp 374.15 by Daily Chart view since listed* - Support Zone 325 to 350 Price Band - Resistance Zone 385 to 408 Price Band - Rising Support Trendline seems been well respected - Falling Resistance Trendline Breakout seems sustained - *Multiple Bullish Rounding Bottoms plus considerate Head & Shoulders below Resistance Zone*
*Aeroflex Inds cmp 197 by Weekly Chart view since listed* - Support Zone 178 to 184 Price Band - Resistance Zone 207 to 216 Price Band - Rising Support Trendline well respected and sustained - Falling Resistance Trendline Breakout done and maintained - Heavy Volumes traded over past few days and well above avg traded quantity - *Bullish Rounding Bottom in the...


