Trade-Technique
Our minimum expectation of 700 points and maximum 1100 points tomorrow over the nifty tomorrow. A simple trading strategy will result in your 7x to 20x profit on this move. Last hour of today trading secession will be our action time.
Tail it has all the characteristics and underlying implications of the excess price, but is stronger. The less time price spends at a certain price level, the more effective that price level will be in providing support or resistance for future price action. Because less time spent shows greater rejection. Observe how price goes above value and spends there the...
Sell NF(nifty future) between 11816-24 with stoploss at 11830 and, targets 11754-11742 intraday. Very Important for more profit point is, if volume raise with fall and break below 11725, then ready to see 11500 nearby.
There're two excess found above the Value High. 3-price rotation , on the value area. Above the control price , there are not trading activities detected. Last closed price is at control price. Conclusion , Buyers always look at excess 28429 of value low and sellers attraction should be at excess 29316 of value high.
Observe how price behaves at the excess area. It goes outside of what is perceived as value for price but it spends very little time there. It comes back down again to making rotating up and down moves which will consolidate the value area even more.
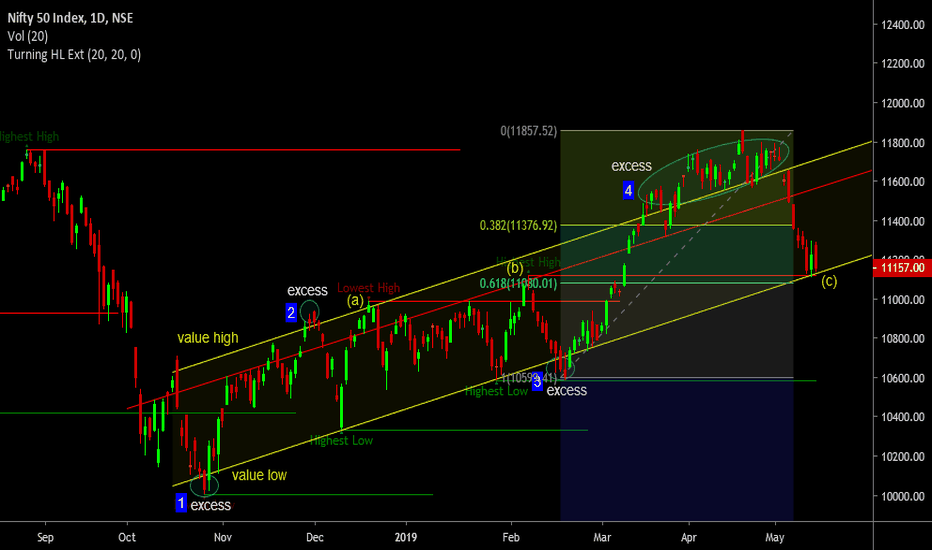
Fin. Retracement 61.8% at 11080. Previous Highest High(b) at 11100. Important level 10985, is at Lowest High(a). At the expected excess-4, where trader's attraction will create for long.
See those value areas. Watch how close they are to one another. They practically merge into one single value area the value areas in the above chart as being small value areas or sideways price movements above and below a shifting control price. shifting value area’s low provides strong additional meaning to this control price as the shifting value area’s low...
In the previous analysis was worked accurate on TATATOMOTORS. The execution of the strongest responsive moved seen in it, and the price come to value low. Traders & Investors attraction always come to at this point to long. The previous Support at 167 nearby , I suggest to take a long position and over the responsive move.
At the value low, found the tail where price moving toward the control price. Trader always tries to short at control price but not aggressive. Short selling aggressively good at the excess, therefore at value high I have mentioned the short point. Short Sellers have two points to short, control price at 1293.5 and 1297 nearby. Exit at comfortable...!
Buy this stock 242-245 and stoploss 240 and go for targets 255-259 intraday and positional targets 268-276
The following all the sign of down break out but the price is still in the channel. Gap has been seen in the value area. The price spike also still in the channel. Volume raised with price fall. The Gap has been seen, and spike with raised volume which very important for a trader. If this is down breaking out, the price can still 100 points to...
i have drawn the value area along with its limits and control price. What observations can be made by analyzing each component? The value areas. Each value area is taking shape at a price level lower than the previous. This is a clear indication of a downtrend. The control price it has a downwards slope. Another indication of a downtrend. In a downtrend, when...
The market does facilitate trading in these price areas as we can see a lot of trading activity going on. Volume can be estimated in a number of ways though. Its main use is to identify support and resistance levels in the market, to gauge the strength of price movements, but it is best used in conjunction with other concepts and methods of analyzing the price....
BUY CADILAHC intraday cash 273.5-271 and stoploss will be 270 below and 286-294 intraday if close above 285.. then hold it 301-314. No worry for weekly chart for long in deeper. For the daily chart, above 270 is good for long at bottom.
Buying in deeper is not bad. For equity 422-426 and is as per comfortable and I have given hints for targets.
The weekly chart has a bullish sign for investors, includes FII, Individual Investors, etc Daily chart the stock is on surge mode. I suggest you this stock for investors but, already found a lot of investors entered.
With Circles, I have tried to introduce about excess. By the callout, mentioned real tails. Excess always pushes to price in channel and Tails are confirmation of it.
This is small channel that is not reliably in a bigger channel's comparing, yet value high " DOJI " is important to short this stock.


