Trade-Technique
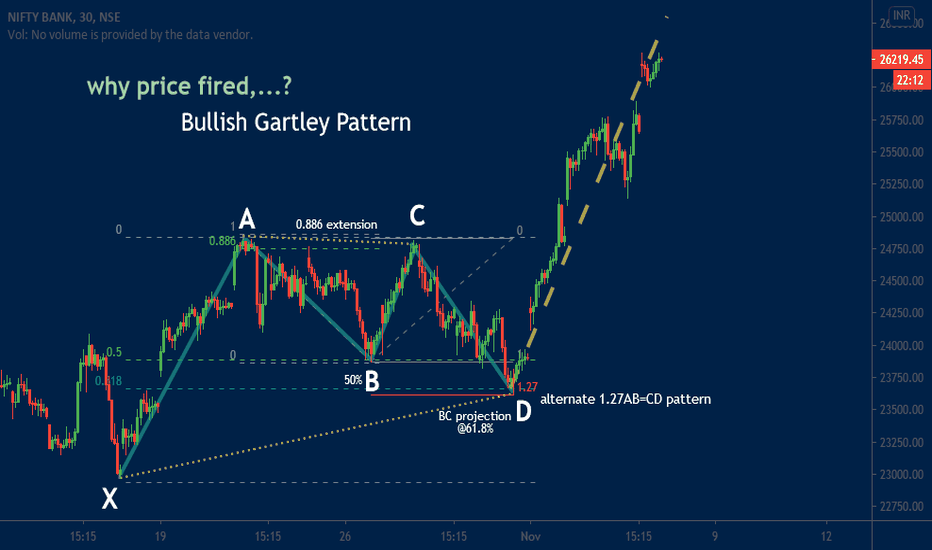
Quick reversals from Bat pattern PRZs are quite common. The mid-point "B" at exactly 50% retracement. Alternate 1.27AB=CD pattern. BC projection @61.8%. The price quickly reversal seen after "D". Question of Harmonic Trader/Analyst is , Bat Or Gartley? Why did birth to this question? - The Gartley Pattern required point "B "50% and 1.27AB=CD ...
In this research, I have relable on the Nifty and plotted Ending Diagonal . This is my recent post and nifty triggered expected target 11900.
Hello Traders, I am back with the new educational concept. You may have often heard the word "RSI" We are going to study about RSI : "Relative Strength Index", which is the most used indicator. RSI is the price following indicator and it provides important levels from 0 to 100. The important levels of RSI are 40-60, 70-30 and...
Value High is good to sell this stock 1372 below for targets 1287(Control Price 2) and Weekly chart 1210. Target 1210 if the price sustain below 1360 As per the weekly chart, Buy INDIGO for targets 1480 nearby only if price close 1350 + Param ount Underline is st ronger resistance and price can fall that why don't you suggest trade heavy volume.
Normally I don't prefer to trade with a heavy position at 5th wave especially, whenever 3rd wave is extended. In this case, we're moving toward forming 5th Wave. I have already predicted 5wave of A, B, and C by using future expected retracement.
Maruti has already made a double top pattern previously followed a continuous move towards up, and formed a curve where buyers and sellers were both confused where the direction of the stock is? After forming a double top pattern the stock has moved towards down direction. At current level it is forming a disjoint channel, and the stock is moving near the...
Banknifty already started to look for the 4th Wave. From Support : 32.8% at 23003=23134 & 50% at 22327, The price can travel for the 5th wave which can be above the 3rd wave.
Hello! Friends, I have come up with a new research an idea but, before starting to talk about technical things, Let's share your LOVE by you giving me LIKES and COMMENTS. Thanks in advance. -------------------------------------------------------------------------- "" 4 hrs TImeframe Chart...
ABC correction is ready for AUROPHARMA and Parallel Channel has penetraction at 5th wave. The 800-700 Levels are possible short for this stock. Kinnari + Elliott's wave theory 5 + 3 = Waves Do you remembers my last research on AUROPHARMA with ELLIOTT WAVE?
What is Dow theory? The Dow theory is a financial theory that says the market is in an up-trend if one of its averages (i.e. industrial or transportation) advances above a previous important high and is accompanied or followed by a similar advance in the other average. For example, if the Dow Jones Industrial Average (DJIA) climbs to an intermediate high, the Dow...
Hello! Friends, I have come up with a new research an idea but, before starting to talk about technical things, Let's share your LOVE by you giving me LIKES and COMMENTS. Thanks in advance. -------------------------------------------------------------------------- "" DAILY CHART "" --------------------------------------------------------------------------...
The Gravitation can push prices upward from support 11108 . If the price fall below will create heavy selling. Let's turn our eye on daily timeframe. Everything is recovered after breaking the support which was 32% fall . Support trendline is reacting as resistace.
The stock has already taken its support, and now trading near the support there is a price rotation, sellers and buyers both are active this the stock is not able to decide its route. thus if the stock cross 211.46 it can move up-to 215.70 and still further up move. Strong support level 206.65, if the price cross this level the stock will be bearish.
Heromotoco is trading in a parallel channel. It has already taken its resistance and follow down price, this stock is bearish. It is still expected to move further down till 2586. The low volume is telling that the stock will continue to move in its direction or there will be a price rotation and less fluctuation. Though if the price cross 2712, stock will be bullish.
Hello! Friends, I can with new research an idea but, before to start talk about technical Let's share your LOVE by giving me LIKES and COMMENTS. Thanks in advanced. ----------------------------------------------------------------------------------------------------------------------------------------------------------------------------- All in chart no need for...
Hello! Friends, I can with new research an idea but, before to start talk about technical Let's share your LOVE by giving me LIKES and COMMENTS. Thanks in advanced. -------------------------------------------------------------------------------------------------------------------------------------------------------------------------- we can see the structure of...
Bajaj Finance has already formed a descending triangle. It has break its triangle in up-direction and now this stock is following an up-direction. You can see in the chart i have mentioned "continues up-move" after every continues up move the stock always form a small triangle and there is a price rotation. The stock has taken perfectly it's support every-time.
The stock is trading near the support of curve line. It has already formed a M-top pattern that is double top. The stock is trading in between 100 and 90 price. The stock can be Bullish from this level and can move till 95.64. Below 88.65 stock can be bearish.


