KRBL daily chart shows the flat bottom channel. This stock is fundamentally very strong and one can initiate a buy entry in deep with the given target and SL. This entire analysis is for educational purposes. Please let me know. your view...
This script has started a new bullish wave. Fundamentally this stock is looking good for long term investments. One can start accumulating the stock from this 481 level to 470 level for short term target 547/560/570/581. Long term target 834/950/1090
ABCD pattern shows a short term opportunity in BTCUSD . Enter into buying in this level can give a short term target of 24237 to 24529. STOP may be below 23101 level.
As this stock is little overvalued but having very strong fundamentals. One can start accumulation of this stock in deep. The levels for accumulations are as follows 190/181/174/167/156/150. These are all Fibonacci retracement level for accumulations. The targets may starts from 214 / 253 / 273
Tatapower having a bullish approach through a changing channel. ABCD harmonic pattern created with multichannel setup where BC has done a perfect Fibonacci retrenchment of 0.786 i.e. at Rs.50.35. Now expected move is CD which could be Rs.67 to Rs.77. as per channel and Fibonacci Extension level.
Euro/Usd is forming a bullish BAT pattern in the hourly format. The price will get support at 1.20676 level (D Point) and start moving up to the target of 1.22212 to 1.23186 level. The is a strong reversal pattern with identified Fibonacci levels.
Meghmani in daily chart B point is retraced at 0.374 ( approx. 0.382 fib level) and C point is the extension of fib 1.272 ( 99.8) to fib 1.414 (107.4) level of XA leg. D point is the retracement of XC leg . So there is a reversal at D point( 50).
The daily chat is explaining the important Fibonacci extensions and the current range is 12722-13185. If it breaks the current higher range then the immediate upside is 13426 and most probably this will be the highest point in this run. One it reaches the given highest point I am expectation these retracement points 12536/12325/12026 before sail towards 14422.
Nifty Long-term trend and levels... Very Bullish It seems Nifty is bullish and breaking the highs on daily basis... and recently its has broken a very important Fibonacci ratio level around 1318. It takes the trend and nifty in to an another dimension. Now question is where... I have a tried lots of patterns in different time frame but the best suited pattern...
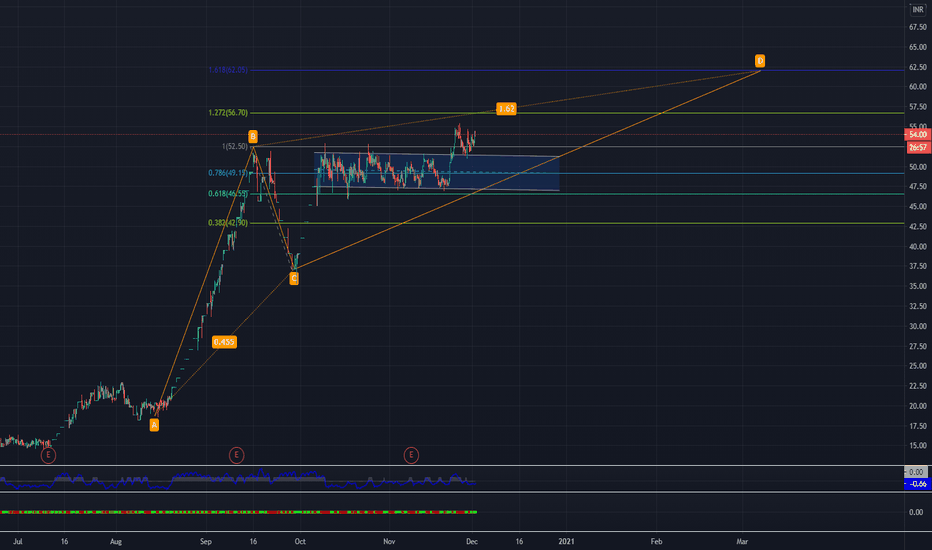
Kellton is in bullish move and has broken one hour channel. It is also an undervalued stock on move. One can start accumulation in this level for future short term target is 56.7 and 62.05
This is a fundamentally strong Script. Though this stock is over valued for time being but one can accumulate at 63.45 level and some more at 59.25 level if you are a lucky one. I can see a possible 1st target of around 83 and further ahead 88.40/ 95.15/ 103.7 Technically it is creating harmonic ABCD pattern ,where BC leg is in formation as a retracement of...
BTC USD is creating an Extended Harmonic Patterns - The Crab Patterns B point retraced XA by Fib 0.618 (13102) level C Point is retraced AB between 0.786 and Fib 0.886 level. Now D point in the process of forming the important Fib extension of XA which is 1.618 level ( 29000 ) That is the projection as of now for BTC-USD in this bull run. Once it...
Tata Metaliks is very bullish and already achieved short term target but very much undervalue stock. One can start accumulation of this stock from below levels if at all you get chance.... accumulation levels : 592/578/568/544 Target 686 and above
Hourly Chart of SGX-nifty shows the speed of movement came down since it got into the yellow parallel Channel and become range bound which is between 13222-13167. Now , until and unless it breaks the higher level of the range it will be in this sideway zone. But if it breaks out the yellow channel then there is the probability of move towards...
1 hour chart has already shown a breakout of a parallel Channel. now target will be 175/182/197/215. Though this is an undervalued stock one can accumulate at 169/164 and 158 levels.
Tata Metaliks is an undervalued stock to invest. We need to get a perfect entry for these types of scripts. Its in a bullish parallel channel since May 2020 and given a healthy reward since then. Now once again there is a chance to enter in to this stock. Entry :533 SL: 516 Target 1:566 Target 2:580 This is a fundamentally strong stock to keep in the portfolio.
The ascending channel has already broken and created lower low. Now it has created 0.786 retracement of AB leg. Expected extensions of AB leg is the target which is cleared in 1 / 1.27 /1/618 and 2 Fibonacci levels. Please manage your trade with a Stop at C level. ** for Educational purpose only
SGX nifty is showing ABCD pattern where CD leg already have created an Fib extension of 1.272 AB at 13184. It is already a bullish script now if it is breaks 1.272 level and goes up then it may go till 1.618 and further more 2 in fib level. So the bullish entry should be above 13184 and Targets are 13622 and 14105. Now if the script comes down and breaks...


