ferros_forex
After break 46800 then started upside move 49200 long time.
As per analysis market reached the all time high so the correction or big fall act the chart. so when see the sell side candle you will take PUT. market will down 38082. thank you
Now the market enter the correction area so waiting for candle confirmation. After break the point 40142 market up the all time high. If market goes down the key level around 37000 then market go all time high, Break out level= 40142 correction point = around 37000
Nifty 50 and sensex to fill the gap then After breakout the trend line it's will be correlation...
triangle pattern form in icici chart so if break up side its goes buy if break down side its goes down side.
Technically Buy Side Possible, & If break 75030 going to SELL.
its a Elliot wave form so take the 2nd point entry, will get more profit.
its breakout the trend line in weekly chart, then only put sell get 700 points.
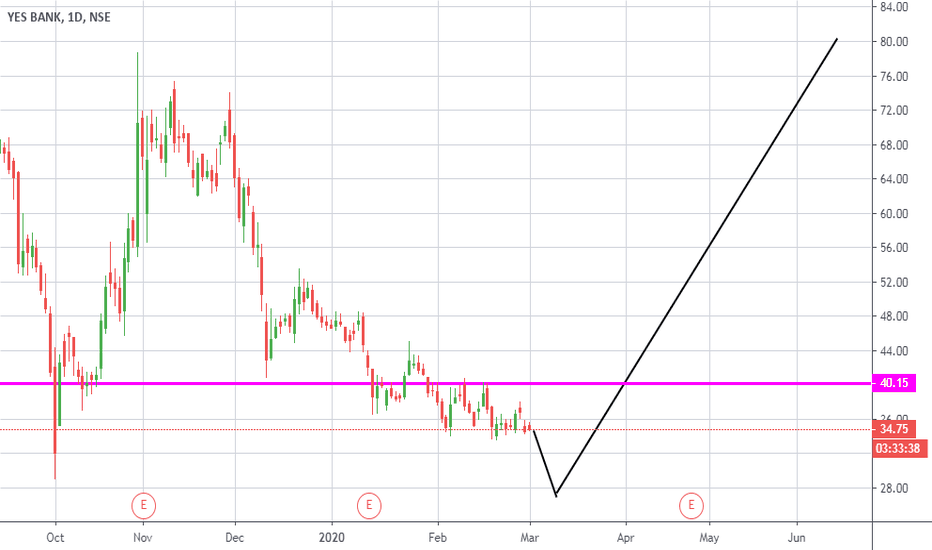
this march yes bank goes to high level...just buy 50 lots or breakout 40 you take trade.
NIFTY,BANK NIFTY AND SENSEX GOES TO UPTREND NEXT WEEK.
Now Indian market goes on perfect Elliot wave pattern. i think its perfect time to learn and earn, so Next i expect its going to down after 11th feb


