kaushal980950
The Redtape shoe-making company has given solid returns over the past year, increasing the investor's wealth by 5x but is it the right time and place to buy the stocks? The chart clearly shows a good rally but it is falling down and if you take the help of Fibonacci retracement then you can clearly see it had taken support at .6 levels. The best place to buy the...
If you closely observe the chart of Bitcoin then you will find that it has retested the trendline and is taking support as well. Apart from this, it had also resisted at the RSI level, signaling that it can move a little bit down but the question arises how much? To find the answer of how much, you can take the help of Fibonacci retracement that would give the...
JK Paper, after facing selling, comes to its demand zone on a weekly time frame. Apart from this in the daily time frame, you can also spot bullish divergence on RSI.
A double bottom pattern formed in the daily time frame of the NMDC stocks. apart from this you can also see the bullish RSI divergence on the chart.
shooting star candlestick is formed on the weekly time frame. As you all know shooting star is a bearish candlestick pattern/reversal pattern and predicts a fall in price. since the stock is trading at its all-time high can't say. On the other hand, if you watch the chart on a daily time frame, then you can encounter a RSI Divergence.
LIC Housing Finance faces the selling from the previously formed supply zone and forms a spinning top candlestick pattern on a daily time frame. apart from this, a blue line shows the weekly time frame support trendline and red line shows daily support.
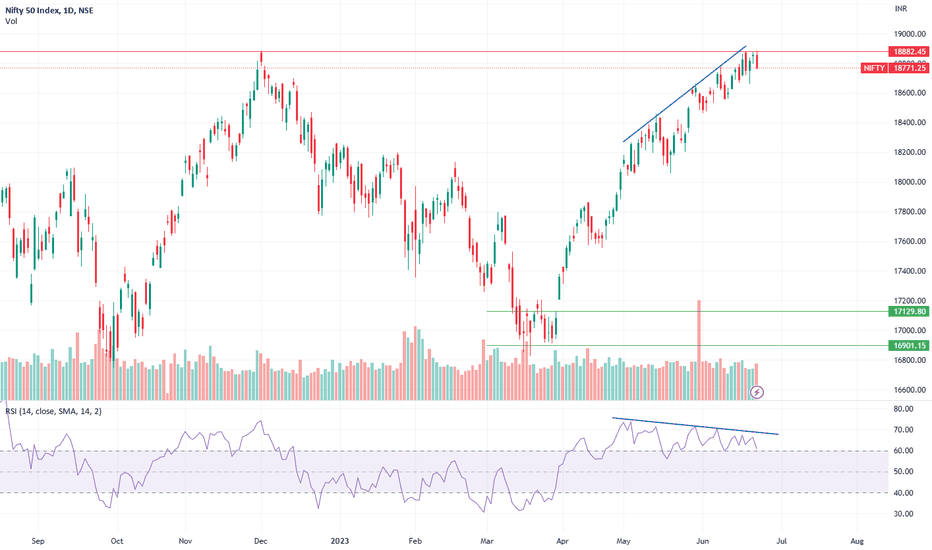
RSI Divergence can be clearly seen on the nifty chart. The same pattern has predicted a fall or correction in the past. The same divergence can be seen before the 2020 crash.


