2000
50
abcdpattern
adani
adanient
adaniports
adanipower
aditya
amarajabat
analysis
apollohospital
apollotyres
axisbank
bajaj
bajajauto
banknifty
bankniftyanalysis
bankniftylong
bankniftytradesetup
bankniftytrading
bankniftytrend
banks
bataindia
batpattern
bearish
bearishbat
bearmarket
beartrendstart
berger
bergerpaint
bergerpaints
beyondta
bhartiairtel
bhartiartl
birla
borosilglass
bottom
breakdown
breakouttrade
breakouttrading
budget
bullish
cadilahealthcare
candlestickpattern
capacit
capacite
cdslpricetrendanalysis
ceatbullish
ceatltd
ceatlts
cera
ceramics
cesc
cesclong
chartpattern
cipla
colpal
cypher-harmonic
cypherpattern
daburindia
demand_zone
dlf
dlfshort
dmart
dmart-market-analysis
doublebottom
downtrend
eichermot
exide
exideind
exideindustries
fallingtrendlines
fallingwedge
fashion
fib
fibonacci
fibonaccicluster
fibonacciextension
fibonacciretracement
fibonnacicluster
fretail
glenmark
glenmarkshare
gmmpfaudler
gmmpfaudlr
godrejagrovetltd
godrejcp
green
harmonicpatterns
harmonictraders
havells
hdfc
hdfcamc
hdfclife
hero
heromoto
heromotoco
heromotocolong
heromotocorp
hindpetro
hourly
icici
icicibank
idfc
idfcbank
ifb
ifbindustries
indicator
indigo
indigolong
infosys
infratel
infy
infyanalysis
infyforecast
infystock
infytrend
insidebar
intradaytrade
ipo
ipo-invest
ipo-stock
ipo-trade
irctc
itc
jublfood
jubliantfoodworks
justdial
keylevel
kotakbank
long
lupin
mahindra
mahindraandmahindra
marico
mcdowell_n
mfsl
mind
mindthegap
mindtree
mindtreelong
m_m
monthlystructure
mothersonsumi
mothersumi
muthootfin
nationalum
nhpc
nift
nift50
nifty
nifty50
nifty50_price_targets
niftyanalysis
niftyindia
niftyoutlook
niftyprediction
niftyshort
niftytrading
niftytrend
niftyview
niftyweekly
nocil
pivotpoints
positional
positionalcall
positionaltrade
positiontrade
price
priceaction
priceactionanalysis
pvr
quickheal
quickhealbatpattern
quickhealfallingwedgepattern
rain
rainindustries
rajesh
rangebound
rblbank
rblshort
sbi
sbic
sbicard
sbin
shortsetup
short-term
shortterm
sideways
siemens
sobha
spinningtop
sterlitetech
sunpharma
supplyanddemand
supplyzone
support
supportandresistance
supportbreakout
support_level
tata
tataglobal
tataglobalbeverages
tatamotors
tatasteel
tcs
techm
techmah
techmahindra
technicalanalysis
threefallingpeaks
time
titan
trap
trendanalysis
trendline
trendlineconfluence
trendlineresisten
trendreversalpattern
vakrangee
vedanta
vedl
venkys
weakness
wipro
yesbank
Less Tags
Show All Tags
All Types
Type
All Types
Indicators
Strategies
Libraries
All Accesses
Script access
All Accesses
Open
Protected
Invite-only
Public & Private
Privacy
Public & Private
Public
Private
There are ideas on different regional versions of TradingView:
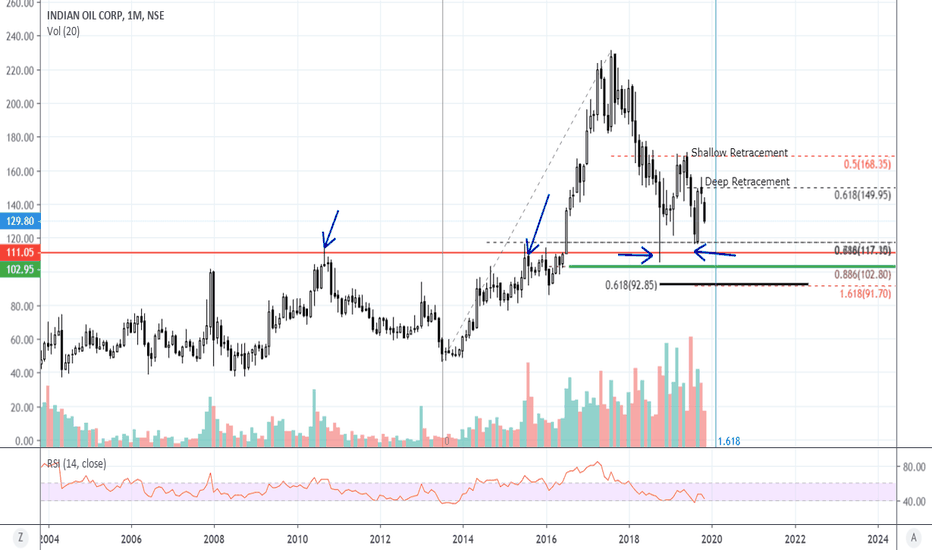
1.) Stock bounces every time it tests .786 Fib support of all-time low and high 2.) Holding this support since Oct 2008, for 10 long years. 3.) Stock always bounces when RSI came near, at or went below 40. 4.] Similar Price Action near Support Range of 240-260
0
Inside candlestick pattern at : Fibonacci .618 Support @ Previous top support Trendline support Rsi near 40
0
8
0
4
Message
Follow
Following
Unfollow
0
0
0
Message
Follow
Following
Unfollow
0
0
0
Message
Follow
Following
Unfollow
1
0
0
Message
Follow
Following
Unfollow
0
0
0
Message
Follow
Following
Unfollow
0
0
0
Message
Follow
Following
Unfollow
0
0
0
Message
Follow
Following
Unfollow
0
0
0
Message
Follow
Following
Unfollow
0
0
0
Message
Follow
Following
Unfollow
0
0
0
Message
Follow
Following
Unfollow
0
0
0
Message
Follow
Following
Unfollow
0
0
0
Message
Follow
Following
Unfollow
0
0
0
Message
Follow
Following
Unfollow
0
0
0
Message
Follow
Following
Unfollow
0
0
0
Message
Follow
Following
Unfollow
0
0
0
Message
Follow
Following
Unfollow
0
0
0
Message
Follow
Following
Unfollow
1
0
0
Message
Follow
Following
Unfollow
0
0
0
Message
Follow
Following
Unfollow
400230
69
1339
Message
Follow
Following
Unfollow
7878
30
284
Message
Follow
Following
Unfollow
3
3
0
Message
Follow
Following
Unfollow
Type
Script access
Privacy


