DOW may reverse from .382 FIb level Targets on chart Happy Trading
AUROPHARMA had some good run in recent times The Price action shows, the first major jump happened with lot of volumes and then consolidation and then smaller jumps based on smaller volume hikes again there is a smaller volume hike, so consolidation expected in the next few days Entry, SL and Target provided on the charts Happy trading MSK
VOLTAS is in an interesting zone providing both buy and sell-side trading opportunity Inference from chart pattern & price action. Looks like it is going to form a double top and fail from there as lot of selling volume is visible details of buy & sell are provided on the chart This hypothesis gets void if Voltas directly falls from here and breaches the buy...
Most of the day traders do look at DOW before taking positions in NIFTY DOW seems to be hitting a resistance zone and may fall from there. would it fall and would this lead to NIFTY further slide, we will see in coming days slideHappy trading
Hitting the resistance line forming bearish AB CD pattern May be shorted , idea invalid if BNF crosses 21040 happy trading
Possible reversal zone (PRZ) - @ 380 Sunpharma has been on a down run since Jan end. Today it got retraced from channel bottom. As the whole pharma sector is going down, tomorrow it may go down a little further. Bullish Bat Harmonic Pattern is seen developing near the channel bottom and possible reversal from 380 can happen The Target for positional...
My Trade plan Have marked a decider zone - above which I would go long and below it would go short Tomorrow if Gap up and crosses the decider we can see a strong short-covering or long Happy Trading MSK
NIFTY after a huge fall yesterday is expected to GAP UP or can retrace in the initial 15 min (just a guess when saying 15min ..), after that it is expected to continue its fall The sell zones are marked and profit booking zones are marked on the chart Happy Trading MSK
MindTree is presently is getting squeezed for one more break-out if it breaks out on long - target would be 1031.5 if it breaks down on short side - target would be 950 Lets see how it plays out in next couple of days Happy Trading MSK
Sunpharma Looks weak after its quarterly results Have provided two entry points High and Low of Fridays candle - You can enter short trade if it touches high of friday candle with stop loss of 5 and if its gaps down and touches friday's low - still you can short with stop loss as fridays close The target is open - so keep booking profits and keep trailing...
Would be shorting Bank Nifty around resistance zone marked in charts If it coincides with the channel upper would be better
Bharti Airtel NSE:BHARTIARTL vs Vodafone Idea NSE:IDEA Both posting heavy losses AGR woes for telecom operators - 24th Jan deadline for payments, airtel 35k crore outstanding, idea 50k crore outstanding both want curative measures from govt airtel claims will be routing some funds from funding that they have secured, idea hasn't published what they...
Most discussed topic these days is - has Nifty peaked out and correction on cards My view - Not yet , it still has some steam left and can possibly touch 12500 before the budget will it reverse from 12500 - Possibly yes reasons - 12500 is near fib level as given on charts - channel upper band my Trade - long with a target of 12450 happy...
a clean cup and handle pattern on weekly chart for bajajfinsv Its going to re-test the neck line on chart soon . after touching the neck line while re-testing its difficult to tell if its going to bounce or drop from there as doesnt have a very clear volume during breakout suggestions - welcome - how do you read this chart ? Thanks
IbulHsgfin looks good for long May reach T1 and T2 in two-three days If it breaches the SL , approach invalid
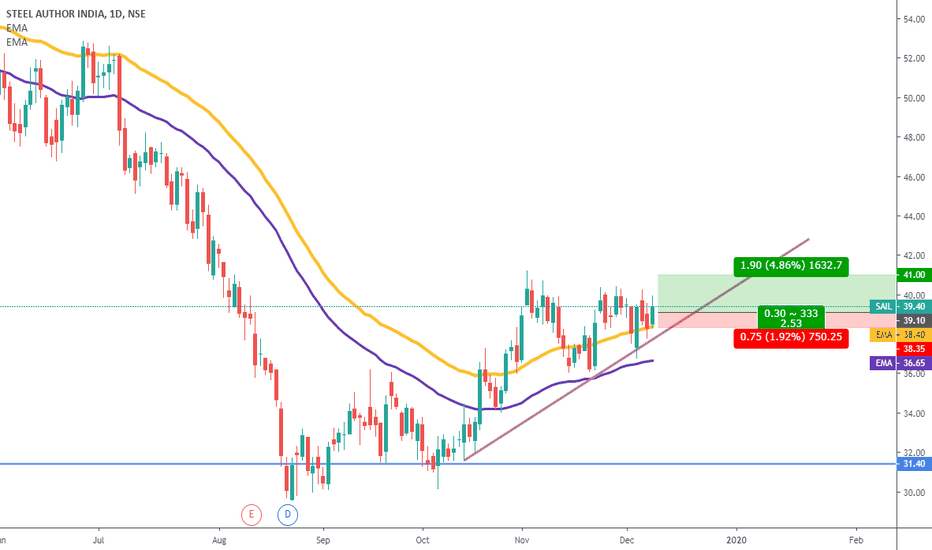
took support from the EMA and closed in green today. tomorrow in opening hour or so may show some correction but likely to end in green - rsi in buying zone entry and sl shown on chart don't enter the trade if the metal index goes for a big gap down tomorrow
broke the support zone and that may act as resistance enter when it retest the earlier support / present resistance target may be the new support as mentioned on the charts


